Vol. 53, p. 25-37, jan./jun. 2020. DOI: 10.5380/dma.v53i0.68494. e-ISSN 2176-9109
Greenhouse gas emissions due to land use change in
Brazil from 1990 to 2015: comparison of methodological
approaches
Emissões de GEE por mudança no uso da terra no Brasil no período 1990 a 2015: comparação de abordagens metodológicas
Carlos SANQUETTA1*, Ana Paula Dalla CORTE1, Mateus SANQUETTA1, Allan PELISSARI1, Margarida TOMÉ2
1 Biofix, Departamento de Ciências Florestais, Universidade Federal do Paraná (UFPR), Curitiba, PR, Brasil. 2 ForChange, Instituto Superior de Agronomia, Universidade de Lisboa (ULisboa), Lisboa, Portugal. * E-mail of contact: [email protected]
Article received on August 13, 2019, final version accepted on January 13, 2020, published on April, 1, 2020.
ABSTRACT: Net CO2 emissions due to land-use change (LUC) resulting from the conversion of natural forest vegetation in
Brazil were analyzed over 25 years (1990-2015). Recognized data sources were studied and emission values were compared. Our analysis included LUC emissions over time, which were stratified by biome. In addition, implications for the fulfillment of commitments assumed by Brazil in the Paris Agreement were discussed. Net LUC greenhouse gas (GHG) emissions from 1990 to 2015 totaled 26GtCO2eq. These values were published and updated officially on the National Emissions Registration System. Another renowned source of information regarding Brazil’s GHG emissions is the System for Greenhouse Gas Emissions and Removals Estimates, which is managed by the Climate Observatory. Although this platform uses a different methodology, it displayed total values that were very similar to the official estimates, except for some differences between individual biome emissions. The Food and Agriculture Organization Corporate Statistical Database, which is based on reports of forest resources, reported lower values of about 21GtCO2eq, thereby showing significant differences among biomes when compared to the two aforementioned sources. Amazonia was responsible for 65% to 80% of all emissions domestic during the studied period. Considering these reductions and the commitments assumed by Brazil (43% reduction in emissions by 2030), the country is expected to reach its goal and contribute to the Paris Agreement. All three analyzed data sources reported estimates for CO2 emissions with differences of up to 18%. The Amazon biome contributed the most to emissions over the studied period, regardless of the source. All analyzed reports displayed reductions in LUC CO2 emissions in Brazil for the last few years of analysis. These results indicate the possibility of Brazil fulfilling the commitments established by the Paris Agreement. The main differences among the methodologies analyzed
are due to the vegetation cover mapping approaches.
Keywords: biomes; carbon stock; forest conversion; deforestation; greenhouse gases.
RESUMO: Analisamos as emissões líquidas de CO2 originadas das mudanças no uso da terra (MUT) causadas pela conversão da vegetação florestal natural no Brasil por um período de 25 anos (1990-2015). Fontes de dados reconhecidas foram examinadas e os valores das emissões comparados. Nossas análises incluem as emissões por MUT ao longo do tempo separadas por bioma. Implicações para o atingimento dos compromissos assumidos em Paris pelo Brasil foram discutidas. As emissões líquidas de GEE por MUT acumuladas no período 1990-2015 publicadas e atualizadas oficialmente pelo governo brasileiro (SIRENE) totalizam 26 GtCO2eq. Outra reconhecida fonte de informações sobre emissões no País, coordenada pelo Observatório do Clima (SEEG), e que usa metodologia distinta, apresenta valores totais muito próximos das estimativas oficiais, mas foram evidenciadas diferenças entre as emissões específicas nos biomas. As estatísticas FAOSTAT da FAO, fundamentadas nos relatórios de avaliação dos recursos florestais (FRA), reportam valores inferiores, da ordem de 21 GtCO2eq, com diferenças expressivas para os biomas em relação aos dois estudos previamente citados. O bioma Amazônia foi responsável por 65 a 80% dessas emissões no País no período considerado. Todas as fontes reportaram redução (de 56 a 63%) nas emissões por MUT nos 25 anos avaliados. Considerando essas reduções e os compromissos pelo Brasil (43% até 2030), o País atingiria seu propósito, contribuindo com o que foi acordado em Paris. As três fontes de dados analisadas reportam estimativas de emissões de CO2 por MUT com diferenças de até 18%. O bioma Amazônia é o que mais contribuiu com as emissões no período considerado, independente da fonte. Todos os estudos analisados mostram redução das emissões de CO2 por MUT no Brasil nos últimos anos da análise, o que possibilita ao País cumprir os compromissos preconizados no Acordo de Paris. As principais diferenças entre as metodologias analisadas estão nas abordagens de mapeamento da cobertura vegetal.
Palavras-chave: biomas; carbono; conversão florestal; desmatamento; gases de efeito estufa.
1. Introduction
The Agriculture, Forestry, and Other Land Use sector is responsible for about 25% of all anthropo-genic greenhouse gas (GHG) emissions worldwide, which currently reach values of approximately 10 to 12 Gt CO2eq y-1. Yearly GHG emissions produced by agricultural production were estimated to be 5.0 to 5.8 Gt CO2eq y-1 between 2000 and 2010. Meanwhile, emissions due to land use and land use change (LU-LUCF) activities were between 4.3 and 5.5 Gt CO2eq y-1 (IPCC, 2014). Deforestation, forest degradation, biomass burning (forest fires and agricultural fires), cattle breeding, and land management are the main emission drivers (Arraes et al., 2012; Cohn et al.,
2014; Steinweg et al., 2016). In addition, mining and hydroelectric power generation are relevant factors given the context (Alvarez-Berríos & Aide, 2015; Zarfl
et al., 2015; Lees et al., 2016; Sonter et al., 2017).
The estimates for LUC GHG emissions are gre-atly affected at different spatial and temporal scales. They are especially difficult to accurately quantify when compared to those emitted by fossil fuels (Le Quéré et al., 2009; Fritz et al., 2016). This is due not only to uncertainties in deforestation and afforestation/ reforestation rates, but also because of the available technologies for area identification and quantification of biomass stored in different land uses. This directly affects carbon stocks and dynamics (Houghton et al., 2012).
LUC emissions in the tropics are closely rela-ted to the production of agricultural commodities for domestic and international markets (Henders et
al., 2015). The expansion of the agricultural frontier
in this region implies deforestation, unsustainable use of wood, and degradation of the surrounding forests. Regarding the conversion of forest to other land uses, thirteen countries from Africa, Latin America, and Tropical Asia were responsible for the emission of nearly 75% of all GHGs released into the atmosphere in 2015 (FAO, 2016). Brazil, which has a large territory and an extensive forest area, contributes the most among these nations, as it displays the highest rates of deforestation worldwide (Keenan et al., 2015) despite efforts to reduce them.
Officially, Brazil has six biomes, namely the Amazonia, Caatinga, Cerrado (Savanna), Atlan-tic Forest, Pampas, and Pantanal (IBGE, 2004). Deforestation in Brazil has a long history in these biomes, starting with the arrival of the Portuguese in the 1500s. Along the coast, where the Atlantic Forest biome occurs naturally, there was a large decrease in coverage of the original forest. This was historically related to the time of colonization and, more recently, to the strong urbanization and industrialization in that zone.
The Atlantic Forest originally occupied 13% of Brazilian territory, while it currently occupies less than 3%. The Pampas biome, which is linked to the Atlantic Forest, is located in the southernmost part of the country. It is typically characterized as steppe, but has enclaves and forest relicts and occupies less than 1% of the national territory. The Caatinga is an arboreal-shrubby biome that typically has a semi-arid climate and is located in the northeast of the country. This biome has undergone a long and
strong process of anthropization. It is estimated that less than 20% of its original area remains. The Cerrado, which is a biome characterized by savanna, is located in the central plateau of the country, and has the second largest area. Recently, this biome has undergone the largest stage of agricultural ex-pansion in Brazil, having lost more than 80% of its original vegetation. The Pantanal, which is a biome linked to the Cerrado, is characterized by extensive plains that are flooded seasonally, as well as forest vegetation. Finally, the Amazonia is the biome with the greatest territorial extension, and is home to the largest tropical rainforest on the planet. It is estimated to have lost about 20% of its forest area.
There are several methodological approaches to estimating GHG emissions, which are described in the Intergovernmental Panel on Climate Chan-ge – IPCC guidelines (IPCC, 2006). Generally, approaches to perform estimates are divided into three levels called tiers. The LUC GHG emissions estimated by the Food and Agriculture Organization (FAO) Corporate Statistical Database (FAOSTAT) are based on a simplified method of forest carbon stock difference, which is equivalent to IPCC Tier 1 (Federici et al., 2015). The methodology adopted by the institution responsible for the GHG inventory in the Brazilian government is also based on Tier 1. However, this employs a more complex land use matrix procedure with parameters and equations per biome. Therefore, it is not typically considered a low level methodology according to the IPCC standards because it has elements of Tiers 2 and 3. The official estimates, besides being part of the Third National Communication to the United Nations Framework Convention on Climate Change (UNFCCC), are also reported to the Sistema de Registro Nacional de Emissões, or National Emissions Registration
System (SIRENE), a platform on the internet. It displays net emissions without segregating emis-sions and removals. The Climate Observatory is a network of 37 Brazilian civil society organizations formed with the purpose of discussing climate change in the Brazilian context. This organization developed its own emissions calculation platform called the System for Greenhouse Gas Emissions and Removals Estimates (SEEG). This platform reports emissions per biome, thereby considering emissions and removals separately according to LUC. In addition, it uses deforestation rates reported by different institutions. This is unlike the official platform, which is based on satellite image mapping at three moments in time, namely 1994, 2002, and 2010. Different methodological approaches entail different GHG estimates. This has repercussions on the emissions calculations and affects decisions related to the country’s fulfillment of the commit-ments assumed in the Paris Agreement.
The objective of this study was to compare LUC CO2 emissions in Brazil from 1990 to 2015 calculated using three data sources and considering different biomes, as well as to discuss their impli-cations for the fulfillment of the commitments as-sumed by the country in its Nationally Determined Contribution (NDC).
2. Results
2.1. SIRENE
By federal decree, SIRENE is an official ins-trument that allows access to GHG emission results (Decree no 9,172/2017). The methodology used to estimate anthropogenic LUC GHG emissions is
described in the Third National Communication to the UNFCCC (MCTIC, 2015). The procedure used to calculate emissions consisted of generating land use matrixes in pre-defined periods according to mapping availability. In this case, the matrixes were generated for 1994-2002, 2002-2005, and 2005-2010 for the Amazon biome, and for 1994-2002 and 2002-2010 for the other biomes. The areas for each LUC and land cover observed in each period were obtained from mapping. A carbon stock value was assigned to each type of land use based on the literature considering all five pools defined by the IPCC (aboveground and belowground biomass, dead wood, litter, and organic carbon in the soil). By using the carbon stock difference of each transition observed between two years of mapping, the net emissions per LUC in CO2eq were calculated using stoichiometry. Yearly emissions for years with no available information were obtained by simple in-terpolation of intermediate years. Emissions of other non-CO2 gases, such as methane and nitrous oxide produced by fires, were accounted for separately.
The SIRENE calculations were based on the Global Warming Potential (GWP) and Global Tem-perature Potential (GTP) metrics by applying the corresponding GHG values for the IPCC, Second Assessment Report (SAR)/AR5, and AR5 reports. In this study, we used the values from the GWP--SAR procedure.
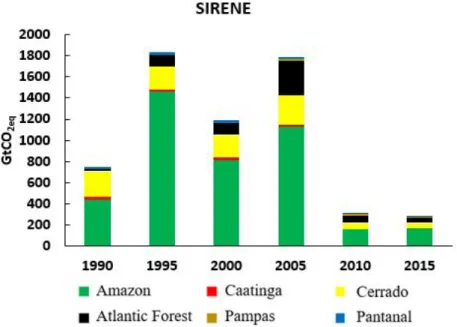
The net anthropogenic emissions due to LUC in CO2eq were estimated by SIRENE as 751,867 Mt CO2eq and 279,611 Mt CO2eq in 1990 and 2015, respectively, thereby implying a 63% reduction in relation to the initial calculated value (Figure 1). The accumulated emission during 1990-2015 was 26,072 Mt CO2eq, with the Amazon being responsi-ble for 67% of this value. Taking 2005 into account,
which is the base year for the Brazilian NDC, the reduction in LUC GHG emissions reached 55% and exceeded the fixed target of 43%. It was noted that the years of 1995 and 2005 displayed periods of high LUC GHG emissions, especially in Amazonia. From 2005 to 2010, there was a significant reduction in emissions, while in the last 5 years the emissions were relatively stable. Emissions reduction was confirmed in all biomes after 2005. However, this was strongly influenced by the marked decrease in deforestation in the Amazon according to the Project for Monitoring Deforestation in the Legal Amazon by Satellite (PRODES) (INPE, 2017).
2.2. SEEG
SEEG is an initiative of the Climate Observa-tory, which is a non-governmental institution whose management is in charge of the Institute of Man and Environment of Amazonia and the Amazon Envi-ronmental Research Institute. It calculates yearly GHG estimates in Brazil and produces analytical documents about the evolution of emissions. Ad-ditionally, it has an internet portal for user queries. SEEG utilizes a different methodology in relation to SIRENE in several ways. First, gross emissions from deforestation and removals in protected areas (conservation units and indigenous areas), secon-dary forests, and LUC are calculated separately. De-forestation rates from several institutions are used to calculate gross emissions. Yearly deforestation data generated by the SOS Mata Atlântica Foundation are used for the Atlantic Forest biome. Data from the PRODES/National Institute for Space Research (INPE) are the basis for the Amazon estimates. The Brazilian Institute of the Environment and
Renewa-ble Natural Resources (IBAMA) provided data for the years 2014, 2015, and 2016. This information was used for Cerrado. As for the other biomes, SE-EG utilizes data from the Monitoring of Deforesta-tion of Brazilian Biomes by Satellite project, which is run by IBAMA. Each forest typology is assigned a carbon stock value that considers all five IPCC pools. In order to complete the removal estimates, a reduction of 3.5% in total removals by protected areas (indigenous land or conservation unit) was adopted. This value was calculated from an estimate of the average deforestation found in the protected areas of the Amazon biome. Estimates of emissions from burning forest waste are also calculated sepa-rately from LUC GHG emissions (deforestation) considering non-CO2 gases. SIRENE allows for emission analysis by the GWP and GTP metrics for SAR, AR4, and AR5. In this work, values given by the GWP-SAR procedure were adopted, and the emissions from waste burning were not disregarded to allow for comparison with other studies.
SEEG calculated the net anthropogenic
emis-sions due to LUC in CO2eq between 1990 and
2015 as 25,807 Mt CO2eq, which differed by less than 1% from the value calculated by SIRENE. The values for 1990 and 2015 were 813,985 Mt CO2eq and 356,135 Mt CO2eq, respectively (Figure 2). In SIRENE, the years 1995 and 2005 marked peak values for LUC GHG emissions due to high emissions from Amazonia, which throughout the period accounted for 65% of the total, according to this source. The temporal behavior of emissions showed that there has been a significant reduction in emissions since 2005, and that the last 5 years have displayed a stable trend. Since 2005, emis-sions in the Amazon have decreased (INPE, 2017). Nonetheless, emissions reductions were observed
in all other biomes, thereby indicating a general pattern of decrease in the loss of forest coverage in the country. On the other hand, emissions from Cerrado have increased, and exceeded those of the Amazon in 2015. Emissions in the Atlantic Forest have also increased according to SEEG. Differences between the emissions reported by SEEG and those reported by SIRENE were noticeable throughout the time series, and ranged from 2.63% in the Amazon to 23.57% in the Pantanal.
2.3. FAOSTAT
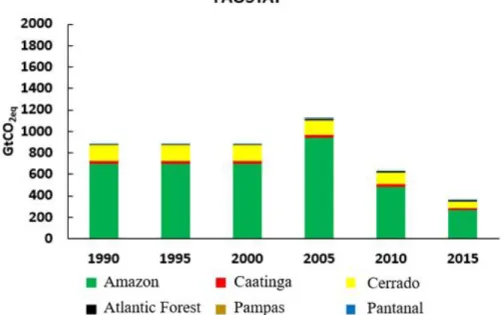
FAOSTAT is a platform created by the FAO that shows statistical information regarding production and consumption of agricultural and food products, among others, for a large number of countries. The information provided includes GHG emissions due to agriculture and land use that specifies changes in total land use for forest, agriculture, pasture, and biomass burning areas (FAO, 2016). The procedure used by FAOSTAT to calculate emissions is derived from the carbon stock difference method between consecutive years. It uses forest area and carbon inventory data reported in the Forest Resources Assessment (FRA) as input in order to calculate GHG emissions every 5 years (1990, 2000, 2005, 2010, and 2015). It then uses linear interpolation to estimate the values for the re-maining years using the nearest available time data. According to Federici et al. (2015), the procedure follows the IPCC Guidelines from 2006 by adopting the method equivalent to the simplest IPCC appro-ach (Tier 1). This is not the IPCC standard given that its application requires the use of statistically
consistent time series of national forest inventory data, which are not available in all countries.
However, this method is much easier to apply than the gain-loss method, especially with a series of data such as that of the FRA. The net emissions/ removals of CO2 from forest areas entail carbon sto-ck net changes in living biomass (aboveground and belowground), along with changes in forest areas and net conversion of forest areas to other land uses. Unlike SIRENE and SEEG, the dead wood, litter, and soil organic carbon compartments were not taken into account. Given that FAOSTAT does not provide individual information regarding emissions from each of the Brazilian biomes, values from the existing carbon stocks in FRA 2015 Brazil (FAO, 2015) were adopted. These were used to allocate proportional values to each vegetative subdivision. Net LUC GHG emissions (emissions - remo-vals) in forest areas estimated by FAOSTAT were 21,293 Mt CO2eq for the 1990-2015 period. This value was 18% and 17% lower than those reported by SIRENE and SEEG, respectively. The temporal behavior of emissions was different when compared to other studies, as it displayed stability in the years between 1990 and 2000, an increase in emissions in 2005, and a gradual decrease until 2015 (Figure 3). The Amazon accounted for 80% of all CO2 emissions over the 25-year period, and this did not change over time. The Atlantic Forest biome, whi-ch was a more notable source of emissions in the other studies (13% and 11% in SIRENE and SEEG, respectively), accounted for only 1% of the total emissions over the period according to FAOSTAT. The Cerrado, Caatinga, and Pampas also showed values that differed from previous studies.
FIGURE 1 – Net anthropogenic emissions in CO2eq due to land use change in Brazilian biomes between 1990 and 2015 according to the
Na-tional Emissions Registration System (SIRENE).
FIGURE 2 – Net anthropogenic emissions in CO2eq due to land use change in Brazilian biomes between 1990 and 2015 according to the System
3. Discussion
We evaluated three data sources on Brazilian LUC GHG emissions from 1990 to 2015. In general, two studies (SIRENE and SEEG) yielded similar re-sults with a difference of less than 1% in the accumu-lated total, because they used similar methodologies regarding land cover change. These methodologies use matrices of land cover change during the period of analysis based on wall-to-wall mapping. Accor-ding to SEEG, the changes in vegetation cover were calibrated based on the transition matrices available in the LUC Sector Reference Report of the Third National Inventory (MCTIC, 2015) and validated with the net emissions published by SIRENE.
On the other hand, FAOSTAT methodological approach displayed a discrepancy on the order of
17% to 18% in terms of GHG emissions as compa-red to SIRENE and SEEG. This methodology is not based on land use transition matrices but on forest area losses (or gains) over 5-year periods (1990-1995, 1995-2000, 2000-2005, 2005-2010 and 2010-2015) estimated from the mapping carried out by the Ministry of Environment, IBGE and IBAMA-CSR (FAO, 2015).
The differences were more significant when the emissions from each Brazilian biome were considered individually. Using SIRENE values as the reference point, SEEG showed less discrepancy. However, for the biomes, the differences ranged from -3% in the Amazon to 24% in the Pantanal. The diver-gence was greater when using FAOSTAT, except in Amazonia (<1%), with differences from -93% in the Atlantic Forest to 136% in the Caatinga. This shows
FIGURE 3 – Net anthropogenic emissions in CO2eq due to land use change in Brazilian biomes between 1990 and 2015 according to the Food
the great uncertainty that surrounds Brazilian LUC GHG emissions, as well as the fact that this might be the case in other countries (Arora & Boer, 2010; Ometto et al., 2014; Sheng, 2017). This highlights the priority of making scientific progress in order to address this issue.
The values exhibited in this study, regardless of the source used, placed Brazil first for gross glo-bal LUC GHG emissions over the studied period. By analyzing the FAOSTAT time series, it was confirmed that Brazil contributed about 26% to net LUC GHG emissions in 1990. Nonetheless, this value decreased to 10% in 2015. Indonesia over-came Brazil in this regard (FAO, 2016). These two geographically large countries are, and have been throughout history, the largest GHG emitters due to deforestation. Other countries, including Bolivia, Colombia, Ecuador, and Paraguay in Latin America; Cambodia, Laos, Malaysia, Myanmar, and Thailand in Asia; Papua New Guinea in Oceania; and Angola, Madagascar, and Mozambique in Africa, produce high emissions due to tropical forest deforestation (Zarin et al., 2016; Global Forest Watch Climate, 2018).
The common feature of the three analyzed studies was the decrease in LUC GHG emissions in Brazil, which ranged from 56% according to SEEG to 63% according to SIRENE. This was clearly due to the significant decrease in the deforestation rate in the country after 2005. The conversion rate of natural lands into agricultural land has signifi-cantly decreased in Brazil since 2010 (Calvin et
al., 2016). Similar patterns have been observed
in most countries that are home to tropical forests (Federici et al., 2015; Zarin et al., 2016; Bebber & Butt, 2017; Houghton & Nassikas, 2018). For Brazil in particular, data from INPE (INPE, 2017)
clearly displayed the decrease in deforestation in the Amazon. However, this was not uniform throughout the region, with variations occurring at different spatial and temporal scales (Godar et al., 2014). Carbon stocks in natural vegetation and rates of agricultural expansion are the most decisive factors for emissions patterns (Novaes et al., 2017). Refined carbon inventory maps are essential to achieve pro-gress regarding this issue and to reduce uncertainty (Ometto et al., 2014).
On the other hand, the results presented by SEEG suggested a resurgence in emissions due to recent increases in deforestation rates in the Cerrado (Noojipady et al., 2017) and in the Atlantic Forest (Fundação SOS Mata Atlântica, 2017). According to SEEG, these two biomes were responsible for inver-sing the trend of decreainver-sing LUC GHG emissions in the country. Although apparently insubstantial, this increase had an impact on the GHG emissions from these biomes from 2010 to 2015; it resulted in a 78% and 46% increase in emissions released by the Cerrado and Atlantic Forest, respectively. This trend was not reflected by SIRENE or FAOSTAT. Brazilian emissions for 2015 given by FAOSTAT were zero; however, the projections were estimated using data up to 2010, which prevented the decrea-sing trend from being captured. The situation with SIRENE was similar because the primary data used by this source were available up to 2010; thus, esti-mates were used for the following years. As such, despite the news reports on the decrease in defores-tation, potential emissions leakage and oversight of other biomes need to be taken into consideration.
Another important feature of the temporal dynamics of GHG emissions in Brazil is the change in the sector profile. According to SIRENE, while emissions from LUC accounted for almost 70% of
the total in 2005, this sector accounted for less than 25% in 2015. This means that despite the increase in emissions in other sectors (agriculture, energy, industrial processes, and waste treatment), the decrease in LUC GHG emissions was enough to lower them to 1990 levels. Considering the 2005-2015 period, emissions reduction in the country was around 50%, and reached 83% for LUC GHG emissions. As such, Brazil had the largest reduction in LUC GHG emissions in the world from 1990 to 2015. This represented more than 50% of global reductions in this sector between 2010 and 2015 (Federici et al., 2015). This reduction provided the country with the necessary conditions for fulfilling the commitments made in its NDC (MMA, 2015; Forsell et al., 2016). The goal of this agreement was a general emissions reduction of 37% by 2010 and 43% by 2030. Despite the evident success in fighting deforestation, additional efforts in this sector are still required. Data for 2016 (INPE, 2017) showed a slight increase in the 2016 rate, as well as an in-crease for other sectors, notably farming, which is closely related to LUC (Cerri et al., 2009; Barona
et al., 2010; Cederberg et al., 2011; Sá et al., 2017).
SIRENE and SEEG CO2 emissions are compa-tible due to the similar approaches involved in the calculations. They use transition matrices of land use and carbon stocks to calculate CO2 emissions from LUC. The matrices are based on wall-to-wall mapping of the vegetation cover throughout the country across the period of analysis. On the other hand, FAO approach is based on forest area loss or gain during the period, based on deforestation rates calculated from Brazilian institutions (MMA, IBAMA and IBGE). Therefore, we concluded that the main differences among the methodological approaches are due to mapping criteria. The use
of the FAOSTAT approach should be restricted when reporting Tier 1 emissions, while SIRENE and SEEG are compatible with Tiers 2 and 3, more appropriate for GHG emissions inventories from countries such as Brazil.
4. Conclusions
The adopted methodology affected the calcu-lation of LUC GHG emissions in Brazil. This was reflected in the 17% to 18% discrepancy between the data provided by SEEG and SIRENE in relation to those provided by FAOSTAT. SIRENE and SEEG CO2 emissions are compatible due to the similar approaches involved in the calculations (land use matrices), corresponding to Tiers 2 and 3. On the other hand, FAO approach is based on forest area loss or gain during the period, based on defores-tation rates calculated from Brazilian institutions (MMA, IBAMA and IBGE), compatible with Tier 1. The differences were more significant when emissions from individual biomes were taken into consideration. Amazonia contributed the most to emissions over the 1990-2015 period regardless of the data source. All the analyzed reports displayed a decrease in LUC CO2 emissions in Brazil for the last 10 years. Variations ranged from 56% to 63% when compared to 1990, and from 68% to 84% when compared to 2005 depending on the source. At this point, this decrease suggests a trend that will make it possible for Brazil to fulfill the commit-ments assumed in the Paris Agreement, as long as the country remains engaged in the task to reduce deforestation and forest degradation.
References
Alvarez-Berríos, N. L.; Aide, T. M. Global demand for gold is another threat for tropical forests. Environmental
Research Letters, 1(10), 029501, 2015. doi:
10.1088/1748-9326/10/1/014006
Arora, V. K.; Boer, G. J. Uncertainties in the 20th cen-tury carbon budget associated with land use change.
Global Change Biology, 24, 350-9, 2010, doi: 10.1111/j.
1365-2486.2010.02202.x
Arraes, R. A.; Mariano, F. Z.; Simonassi, A. G. Causas do Desmatamento no Brasil e seu Ordenamento no Contexto Mundial. Revista de Economia e Sociologia Rural, 50(1), 119-40, 2012, doi: 10.1590/S0103-20032012000100007 Barona, E.; Ramankutty, N.; Hyman, G.; Coomes, O.T. The role of pasture and soybean in deforestation of the Brazilian Amazon. Environmental Research Letters, 5, 024002, 2010. doi: 10.1088/1748-9326/5/2/024002
Bebber, D. P.; Butt, N. Tropical protected areas reduced deforestation carbon emissions by one third from 2000-2012. Scientific Reports, 2017, 7(14005). doi: 10.1038/ s41598-017-14467-w
Calvin, V.; Beach, R.; Gurgel, A.; Labriet, M.; Rodriguez, M. L. G. Agriculture, forestry, and other land-use emissions in Latin America. Energy Economics, 56, 615-624, 2016. doi: 10.1016/j.eneco.2015.03.020
Cederberg, C.; Persson, U. M.; Neovius, K.; Molander, S.; Clift R. Including carbon emissions from deforestation in the carbon footprint of Brazilian beef. Environmental Science
Technology, 45, 5, 1773-9, 2011. doi: 10.1021/es103240z
Cerri, C. C.; Stoecio, M. F. M.; Galdos, M. V.; Cerri, C. E. P.; Feigl, B. J.; Bernoux, M. Emissões de gases do efeito estufa do Brasil: importância da agricultura e pastagem.
Scientia Agricola, 66, 6, 831-43, 2009. doi:
10.1590/S0103-90162009000600017
Cohn, A. S.; Mosnierc, A.; Havlíkc, P.; Valinc, H.; Herre-rod, M.; Schmide, E.; O’haref, M.; Obersteinerc, M. Cattle ranching intensification in Brazil can reduce global gree-nhouse gas emissions by sparing land from deforestation.
Proceedings of the National Academy of Sciences, 111(20),
7236-41, 2014. doi: 10.1073/pnas.1307163111
FAO – Food and Agriculture Organization of the United Nations. FRA2015 Brazil, Country Report. Rome: FAO, 2015. Available on: <http://www.fao.org/3/a-az172e.pdf.> Access on: jul. 2019.
FAO – Food and Agriculture Organization of the United Na-tions. FAOSTAT 2016. Available on: http://faostat3.fao.org/ faostatgateway/go/to/browse/G2/*/E. Access on: jul. 2019. Federici, S.; Tubiello, F.N.; Salvatore, M.; Jacobs, H; Schi-midhuber, J. New estimates of CO2 forest emissions and removals: 1990-2015. Forest Ecology and Management, 352, 89-98, 2015. doi: 10.1016/j.foreco.2015.04.022 Forsell, N.; Turkovska, O.; Gusti, M.; Obersteiner, M.; Den Elzen, M.; Havlik, P. Assessing the INDCs’ land use, land use change, and forest emission projections. Carbon
Balance and Management, 11, 26, 2016. doi: 10.1186/
s13021-016-0068-3
Fritz, S.; Schepaschenko, D.; See, L. Carbon tracking: Limit uncertainties in land emissions. Nature, 533, 446-7, 2016. doi: 10.1038/534621e
Fundação SOS Mata Atlântica - INPE - Instituto Nacional de Pesquisas Espaciais. Atlas dos remanescentes florestais
da Mata Atlântica, período 2015-2016, Relatório Técni-co. 2017. Available on: <https://www.sosma.org.br/link/
Atlas_Mata_Atlantica_2015-2016_relatorio_tecnico_2017. pdf.>. Access on: mai. 2018
Global Forest Watch Climate. Carbon emissions from
tropical deforestation. 2018. Available on: <http://climate.
globalforestwatch.org/pantropical>. Access on: jan 2019. Godar, J.; Gardner, T.A.; Tizado, E.J.; Pacheco, P. Actor-s-pecific contributions to the deforestation slowdown in the Brazilian Amazon. PNAS, 111(43), 15591-96, 2014. doi: 10.1073/pnas.1322825111
Henders, S.; Persson, U. M.; Kastner, T. Trading forests: land-use change and carbon emissions embodied in pro-duction and exports of forest-risk commodities.
Environ-mental Research Letters, 10, 12, 2015. doi:
10.1088/1748-9326/10/12/125012.11
Houghton, R. A.; House, J. I.; Pongratz, J.; van der Werf, G. R.; Defries, R. S.; Hansen, M. C.; Le Quéré, C.;
Ramankut-ty, N. Carbon emissions from land use and land-cover change. Biogeosciences, 9, 5125-42, 2012. doi: 10.5194/ bg-9-5125-2012
Houghton, R. A.; Nassikas, A. A. Negative emissions from stopping deforestation and forest degradation, globally.
Global Change Biology, 24(1), 350-9, 2018. doi: 10.1111/
gcb.13876
IBGE – Instituto Brasileiro de Geografia e Estatística. Mapa
de Biomas e de Vegetação, 2004. Available on: <https://
ww2.ibge.gov.br/home/presidencia/noticias/21052004bio-mashtml.shtm.> Access on: jan. 2019.
INPE – Instituto Nacional de Pesquisas Espaciais.
Moni-toramento da Floresta Amazônica Brasileira por Satélite,
2017. Available on: <http://www.obt.inpe.br/OBT/assuntos/ programas/amazonia/prodes.> Access on: jan. 2019. IPCC – Intergovernmental Panel on Climate Change. 2006
IPCC Guidelines for National Greenhouse Gas Inventories,
2006. Available on: <http://www.ipcc-nggip.iges.or.jp/ public/2006gl/index.html.> Access on: jan 2019.
IPCC – Intergovernmental Panel on Climate Change. Fifth
Assessment Report (AR5), 11 Agriculture, Forestry and Other Land Use (AFOLU), 2014. Available on: <https://
www.ipcc.ch/report/ar5/> Access on: jan. 2019.
Keenan, R. J.; Reams, G. A.; Achard, F.; Freitas, J. V.; Graniger, A.; Londquist, R. Dynamics of global forest area: Results from the FAO Global Forest Resources Assessment 2015. Forest Ecology and Management, 352(7), 9-20, 2015. doi: 10.1016/j.foreco.2015.06.014
Lees, A. C.; Peres, C. A.; Fearnside, P. M.; Schneider, M.; Zuanon, J. A. S. Hydropower and the future of Amazonian biodiversity. Biodiversity and Conservation, 25(3), 451-66, 2016. doi: 10.1007/s10531-016-1072-3
Le Quéré, C.; Raupach, M. R.; Canadell, J. G.; Marland, G.; Bopp, L.; Ciais, L.; Conway T. J.; Doney, S. C.; Feely, R. A.; Foster, P.; Friedlingstein, P.; Gurney, K.; Houghton, R. A.; House, J. I.; Huntingford, C.; Levy, P. E.; Lomas, M. R.; Majkut, J.; Metzl, N.; Ometto, J. P.; Peters, G. P.; Prentice, C.; Randerson, J. T.; Running, S. W.; Sarmiento, J. L.; Schuster, U.; Sitch, S.; Takahashi, T.; Viovy, N.; van der Werf, G. R.; Woodward, F. I. Trends in the sources and sinks of carbon dioxide. Nature Geoscience, 2, 831-6, 2009.
doi: 10.1038/ngeo689
MCTIC – Ministério de Ciência, Tecnologia, Inovações e Comunicações. Third National Communication of Brazil
to the United Nations Framework Convention on Climate Change, 2015. Available on: <http://sirene.mcti.gov.br/
publicacoes>. Access on: jan 2019.
MMA – Ministério do Meio Ambiente. Intended Nationally
Determined Contribution, 2015. Available on: <http://www.
mma.gov.br/images/arquivo/80108/BRAZIL%20iNDC%20 english%20FINAL.pdf.> Access on: jan, 2019.
Noojipady, P.; Morton, D. C.; Macedo, M. N.; Victoria, D. C.; Huang, C.; Gibbs, H. K.; Bolfe, E.L. Forest carbon emissions from cropland expansion in the Brazilian Cerrado biome. Environmental Research Letters 12, 02500, 2017. doi: 10.1088/1748-9326/aa5986
Novaes, R. M. L.; Pazianotto, R. A. A.; Brandão, M.; Alves, B. J. R.; May, A.; Folegatti-Matsuura, M. I. S. Estimating 20-year land-use change and derived CO2 emissions asso-ciated with crops, pasture and forestry in Brazil and each of its 27 states. Global Change Biology, 23(9), 3716-28, 2017. doi: 10.1111/gcb.13708
Ometto, J. P.; Aguiar, A. P.; Assis, T.; Soler, L.; Valle, P.; Tejada, G.; Lapola, D. M.; Meir, P. Amazon forest biomass density maps: tackling the uncertainty in carbon emission estimates. Climatic Change, 124(3), 545-60, 2014. doi: 10.1007/s10584-014-1058-7
Sá, J. C.; Lal, R.; Cerri, C. C.; Lorenz, K.; Hungria, M.; Carvalho, P. C. F. Low-carbon agriculture in South Ame-rica to mitigate global climate change and advance food security. Environment International, 98, 102-112, 2017, doi: 10.1016/j.envint.2016.10.020
Sheng, J. Effect of Uncertainties in estimated carbon reduc-tion from deforestareduc-tion and forest degradareduc-tion on required incentive payments in developing countries. Sustainability, 9(9), 1608, 2017. doi: 10.3390/su9091608
Sonter, L.J.; Herrera, D.; Barrett, D.J.; Galford, G.L.; Moran, C.J.; Soares-Filho, B.S. Mining drives extensive deforesta-tion in the Brazilian Amazon. Nature Communicadeforesta-tions, 8, 1013, 2017. doi: 10.1038/s41467-017-00557-w
of deforestation: sector exposed to sustainability and fi-nancial risks. Washington: Chain Reaction Research, 2016.
Available on: http://www.aidenvironment.org/wp-content/ uploads/2016/08/economic-drivers-of-deforestation-crr--160803-final.pdf. Access on: jan 2019.
Zarfl, C.; Lumsdon, A. E.; Berlekamp, J.; Tydecks, L.; Tockner, K. A global boom in hydropower dam construc-tion. Aquatic Sciences, 77(1), 161-70, 2015, doi: 10.1007/ s00027-014-0377-0
Zarin, D. J.; Harris, N. L.; Baccini, A.; Aksenov, D.; Hansen, M. C.; Azevedo-Ramos, C.; Azevedo, T.; Margono, B.; Alencar, A.; Gabris, C.; Allegretti, A.; Potapov, A.; Farina, M.; Walker, W. S.; Shevade, D. S.; Loboda, T. V.; Uruba-nov, S.; Tyukavina, A. Can carbon emissions from tropical deforestation drop 50% in 5 years? Global Change Biology, 22(4), 1336-47, 2016. doi: 10.1111/gcb.13153