Improving connectivity for
river fish
Tese apresentada para obtenção do Grau de Doutor em
Engenharia Florestal e dos Recursos Naturais
Paulo José de Lemos Branco
Orientadora: Doutora Maria Teresa Marques Ferreira da Cunha Cardoso Co-Orientadores: Doutor António Alberto do Nascimento PinheiroDoutor José Maria Horta e Costa Silva Santos
Júri:
Presidente: Reitor da Universidade de Lisboa
Vogais: Doutor Rui Manuel Victor Cortes, Professor Catedrático da Escola de Ciências Agrárias e Veterinárias da Universidade de Trás-os-Montes e Alto Douro;
Doutor António Alberto do Nascimento Pinheiro, Professor Catedrático do Instituto Superior Técnico da Universidade de Lisboa
Doutora Maria Teresa Marques Ferreira da Cunha Cardoso, Professora Associada com agregação do Instituto Superior de Agronomia da Universidade de Lisboa
Doutor Pedro Miguel Raposo de Almeida, Professor Auxiliar da Escola de Ciências e Tecnologia da Universidade de Évora
Doutor Daniel Hering, Full Professor da University of Duisburg Essen, Germany
Lisboa
2013
This Dissertation should be cited as:
Branco P (2013). Improving connectivity for river fish. PhD Thesis, Instituto Superior de
Agronomia, Universidade de Lisboa, Portugal.
v Rivers are severely impacted by barriers that hamper the longitudinal connectivity of the systems, promoting species isolation and affecting the movements of freshwater fish species, which leads to genetic impoverishment and disappearance of populations. This thesis is focused on defining the problems of connectivity infringement as well as on finding solutions to enhance connectivity in barrier fragmented systems. During the studies that are present in this thesis the impact of barriers on the distribution of freshwater fish species, and the reduction of structural and functional connectivity of river basins are accessed. It is also defined a technique to prioritize barriers to intervene in order to enhance connectivity. To augment connectivity, and because barrier removal is often impractical, strategies to retrofit existing pool-type fishways and guidelines for new fishway projects are determined and present in this thesis. It is also demonstrated how flow regime can have an impact on fish fishway negotiation success, moving a step forward towards a holistic technical fishway.
Key-words: Connectivity, Freshwater fish, Connectivity enhancement, Pool-type fishway, Flow regimes
vii Os rios são fortemente afectados pela construção de barreiras que limitam a conectividade longitudinal, levando ao isolamento de espécies ictíicas e limitando os seus movimentos ao longo do sistema. Esta fragmentação diminui a variabilidade genética e leva ao desaparecimento de populações. Esta tese tem como enfoque a definição dos problemas causados pela quebra de conectividade e a determinação de soluções para o aumento de conectividade em sistemas fragmentados. Nesta tese o impacto das barreiras na distribuição de espécies ictíicas de água doce e a redução de conectividade estrutural e funcional de bacias hidrográficas são determinados. É também definida uma técnica de ordenação de barreiras a alterar de modo a aumentar a conectividade. Uma vez que a remoção de barreiras é por vezes impracticável, estratégias para recondicionar passagens para peixes por bacias sucessivas existentes e directrizes para aplicação em novos projectos são determinadas nesta tese. Demonstra-se ainda o impacto que o regime de escoamento tem no sucesso de transposição dos peixes de uma passagem para peixes por bacias sucessivas, aumentando o conhecimento científico em direcção a uma passagem para peixes técnica que seja holística.
Palavras-chave: Conectividade, Peixes de água doce, Aumento da conectividade, Passagem para peixes por bacias sucessivas, Regimes de escoamento
ix
ACKNOWLEDGEMENTS i
ABSTRACT v
RESUMO vii
TABLE OF CONTENTS ix
LIST OF FIGURES xiii
LIST OF TABLES xvii
SECTION I – Hydrological connectivity: causes and consequences 1
Chapter 1 - Introduction 5 1.1 - Rivers 7 1.2 - Connectivity 7 1.3 - River regulation 10 1.4 - Connectivity loss 11 1.5 - Connectivity enhancement 16 1.6 - Fishways 20 1.7 - Objectives 26 1.8 - Thesis structure 28 1.9 - Literature cited 30
SECTION II – Barriers impact 47
Chapter 2 - Does longitudinal connectivity loss affect the distribution of freshwater fish?
49 2.1 - Abstract 51 2.2 - Introduction 51 2.3 - Methods 54 2.4 - Results 59 2.5 - Discussion 64 2.6 - References 68
Chapter 3 - Prioritizing restoration of structural connectivity in rivers: A graph based approach
75 3.1 - Abstract 77 3.2 - Introduction 77 3.3 - Methods 79 3.4 - Results 82 3.5 - Discussion 83 3.6 - References 87
x 4.1 - Abstract 93 4.2 - Introduction 93 4.3 - Methods 96 4.4 - Results 102 4.5 - Discussion 106 4.6 - References 108
SECTION III – Connectivity enhancement 115
Chapter 5 - Boulders as building blocks: Improving habitat and river connectivity for stream fish
117 5.1 - Abstract 119 5.2 - Introduction 119 5.3 - Methods 122 5.4 - Results 127 5.5 - Discussion 130 5.6 - References 133
Chapter 6 - Effect of two flow regimes on the upstream movements of the Iberian barbel (Luciobarbus bocagei) in an experimental pool-type fishway
139 6.1 - Abstract 141 6.2 - Introduction 141 6.3 - Methods 143 6.4 - Results 147 6.5 - Discussion 150 6.6 - References 152
Chapter 7 - Pool-type fishways: Two different morpho-ecological cyprinid species facing plunging and streaming flows 155 7.1 - Abstract 157 7.2 - Introduction 157 7.3 - Methods 160 7.4 - Results 165 7.5 - Discussion 170 7.6 - References 173
xi
Chapter 8 - Discussion 181
8.1 - Is the distribution of fish species affected by longitudinal connectivity losses?
184 8.2 - Can structural and functional connectivity be
determined for a river network?
185 8.3 - Can the enhancement of structural and functional
connectivity be prioritized for river networks?
186 8.4 - Can boulders enhance habitat availability and
thus connectivity?
187 8.5 - Can boulder placement improve fishway
negotiation?
189
8.6 - Does the flow regime of fishways matter 190
8.7 - Final considerations 191
8.8 - Furthering this… 192
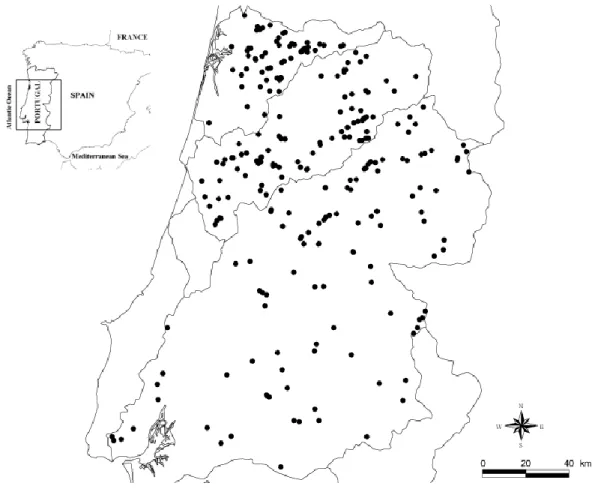
xiii Figure 2.1 – Location of the 196 sampling points in the three river basins (Tagus,
Mondego, and Vouga) in central Portugal.
55
Figure 2.2 – Pure contribution of each environmental variable to the percentage of explained variation of each species distribution using a Hierarchical Variation Partitioning technique. 1 - Geomorphology1, 2 - Geomorphology2, 3 - Slope, 4 - Natural Sediment, 5 - Precipitation, 6 - Altitude, 7 - Temperature, 8 - Morphology, 9 - Hydrology, 10 - Water_Quality, 11 - Barriers_Up, 12 - Barriers_Down.
63
Figure 2.3 – Box and Whiskers plots of the residual analysis. NREF – Non-reference site, i.e. impacted by barriers; REF – Reference site, i.e. not impacted by barriers. On the y-axis zero (0) means no deviation from predicted occurrences, negative (-) values mean that a given species was absent from a site where it was predicted to be present, positive values mean that a given species is present at a site where it was predicted to be absent.
64
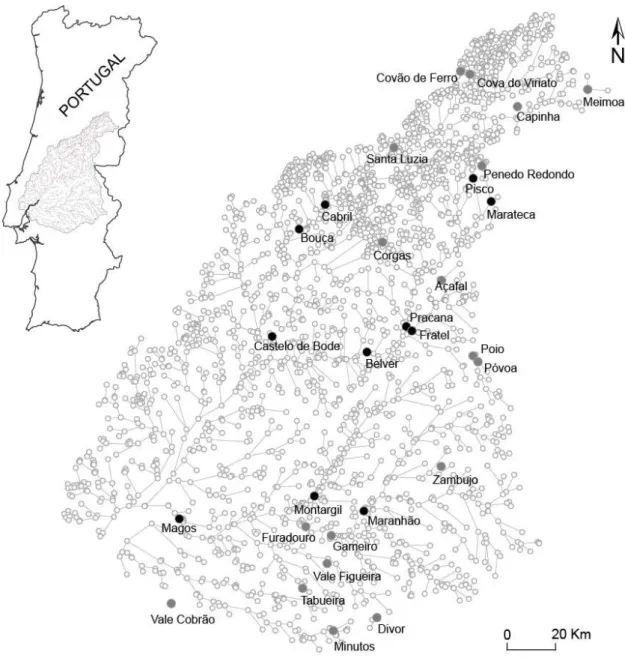
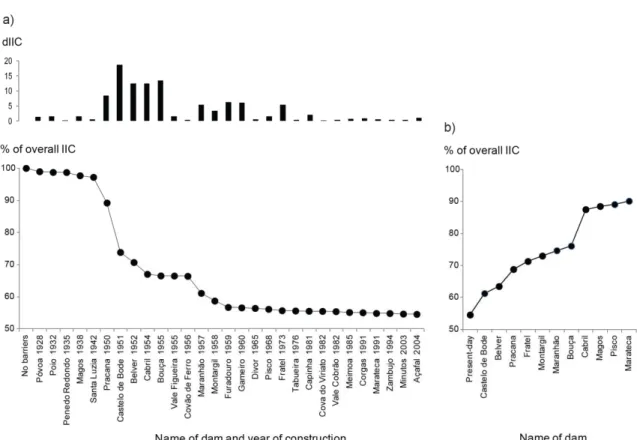
Figure 3.1 - Study area and graph model of the target river basin with the location of the major dams considered in this study (filled circles). Black circles represent the set of eleven dams whose removal would re-establish 90% of the overall connectivity as given by IIC (see results for further details).
80
Figure 3.2 – Percentage of change in the overall connectivity (IIC) based on the historical sequence of dam construction, with the isolated effects of each dam shown in the upper barplot (a), and change in the overall connectivity (IIC) based on the “backward” barrier removal procedure (b).
83
Figure 4.1 – Study area and representation of the graph model of the Tagus river network. The dams considered in this study are represented as black bold lines (\).
97
Figure 4.2 – Map representation of the habitat suitability models, expressed as modeled probability of occurrence, of the Tagus river network for the: a) Barbel, b) Chub, c) combination of the two species.
103
Figure 4.3 – Percentage of change in the overall connectivity (IIC) of the Tagus river network following the chronological sequence of dam construction.
105
Figure 4.4 - Percentage of change in the overall connectivity (IIC) of the Tagus river network following the barrier removal sequence defined by the step-wise procedure.
105
xiv
disturbed site with 15 boulders (BP15); (g) disturbed site with 18 boulders (BP18); and
(h) disturbed site with more than 21 boulders (BP>21). D - depth; V – water velocity;
FN – Froude number.
Figure 5.2 – Side view diagram of the pool-type fishway experimental model. Slope of 8.5%.
127
Figure 5.3 – Diagram of the velocity (m s-1) contours and direction for the two horizontal planes in the two tested configuration. Plane 1 measured at boulders mid-height (5 cm), Plane 2 measured at 25% pool mean depth (hm). Lined and dotted squares represent the boulders and show their position and alignment. Arrows show the direction and magnitude of flow (m s-1). Flow enters the pool at the top left corner of the diagram and exits at the bottom right corner of the diagram. Axis labels are cm.
130
Figure 6.1 - Horizontal velocity field (magnitude and direction) in the pools according to the different flow regimes and measurement planes: (a) regime 1 at the horizontal plane corresponding to the boulders mid-height; (b) regime 2 at the horizontal plane corresponding to the boulders mid-height; (c) regime 1 at the horizontal plane corresponding to 21 cm above the flume bottom; (d) regime 2 at the horizontal plane corresponding to 21 cm above the flume bottom. Arrows show velocity direction and magnitude. Lined and dotted squares represent the boulders and show their position and alignment. Flow enters the pool at the top left corner of the diagram and exits at the bottom right corner of the diagram.
148
Figure 6.2 - Vertical velocity contours in the pools according to the different flow regimes and measurement planes: (a) regime 1 at the horizontal plane corresponding to the boulders mid-height; (b) regime 2 at the horizontal plane corresponding to the boulders mid-height; (c) regime 1 at the horizontal plane corresponding to 21 cm above the flume bottom; (d) regime 2 at the horizontal plane corresponding to 21 cm above the flume bottom. Lined and dotted squares represent the boulders and show their position and alignment. Flow enters the pool at the top left corner of the diagram and exits at the bottom right corner of the diagram.
149
Figure 7.1 - a) Side view diagram of the pool-type fishway experimental prototype on a slope of 8.5%; b) Three dimensional representation of a pool, showing orifice arrangements and the horizontal planes (dashed green lines) where hydraulic measurements were conducted; c) Three dimensional representation of a pool, showing orifice arrangements and the vertical planes (dashed green lines) where
xv two flow regimes. Plane 1 measured at 10 cm, Plane 2 measured at 78% pool mean
depth (hm). Arrows within the diagram show the direction and magnitude of flow. Arrows outside of the diagram show the water inlet and outlet points. i) Plunging flow regime horizontal plane 1; ii) Plunging flow regime horizontal plane 2; iii) Streaming flow regime horizontal plane 1; iv) Streaming flow regime horizontal plane 2.
Figure 7.3 - Velocity contour lines and vectors for the two vertical planes in the two flow regimes. Planes were measured at 50% of the orifice width. Arrows within the diagram show the direction and magnitude of flow. Arrows outside of the diagram show the water inlet and outlet points. i) Plunging flow regime vertical plane 1; ii) Plunging flow regime vertical plane 2; iii) Streaming flow regime vertical plane 1; iv) Streaming flow regime vertical plane 2.
167
Figure 7.4 – Proportions of upstream movements through both opening types by each species for both flow regimes. BP – Barbel in plunging flow regime; BS – Barbel in streaming flow regime; CP – Chub in plunging flow regime; CS – Chub in streaming flow regime.
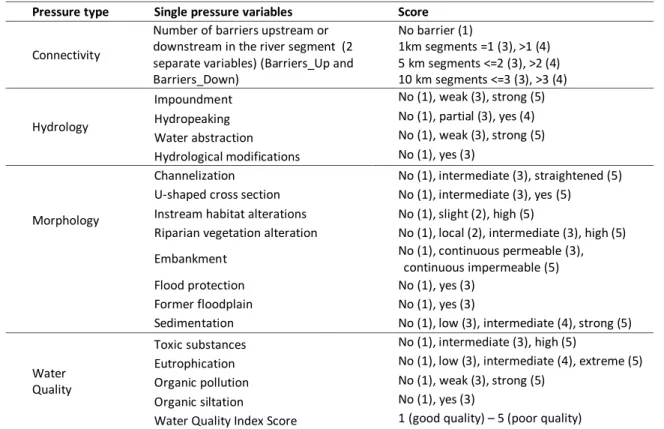
xvii Table 2.1 – Pressure variables and classification scheme. “No” means that no
pressure of that kind was recorded. Parenthesised values state the score given to each of the pressure variable’s classification class.
57
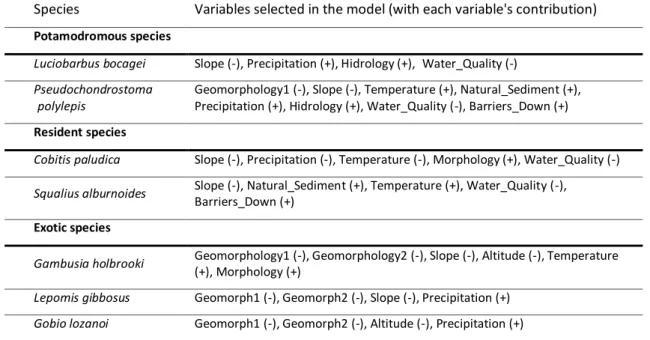
Table 2.2 – Species’ best model chosen through stepwise AIC variable selection. Each variable is represented with its contribution to the model.
60
Table 2.3 – Species’ most parsimonious model chosen through AIC Weights criterion, from an a priori 66 model batch. Each variable is represented with its contribution to the model.
61
Table 2.4 - Mann-Whitney U Test between the residuals, reference and non-reference sites, of each species’ model, with variables selected through stepwise AIC.
62
Table 2.5 - Mann-Whitney U Test between the residuals, reference and non-reference sites, of each species’ model selected through AIC Weights criterion.
62
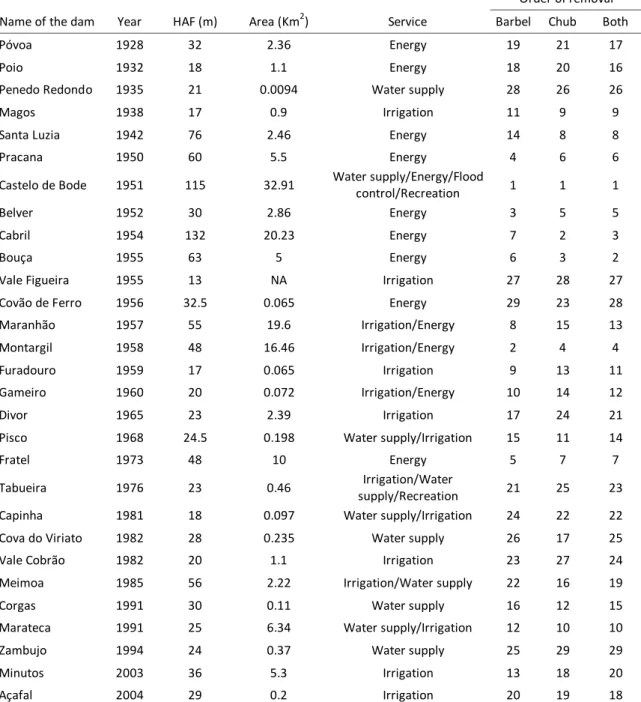
Table 4.1 – Year of construction and principal characteristics of the dams implanted in the Tagus River network, with indication of the ranking order of removal for each species and for the combination of the two (Both). HAF – height above foundation; Area – flooded area; Service – service provided by the dam.
101
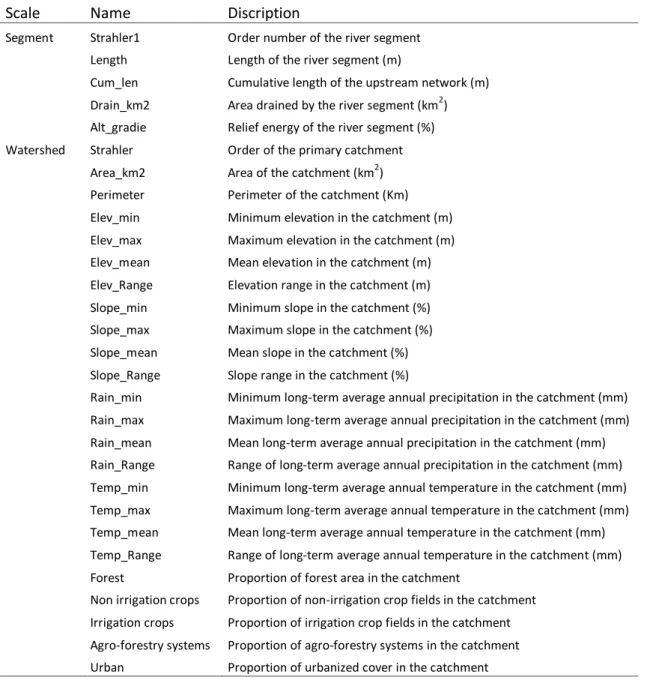
Table 4.2 – Variables used to model species habitat suitability at different spatial scales.
102
Table 5.1 – Physical characteristics of the reference and disturbed sites (Q = 1 m3.s-1) in the Ocreza River. Iberian barbel – Luciobarbus bocagei; Iberian
straight-mouth nase – Pseudochondrostoma polylepis; Southern Iberian spined-loach – Cobitis paludica; Southern Iberian chub – Squalius pyrenaicus; Calandino – Squalius alburnoides; Gudgeon – Gobio lozanoi; Pumpkin-seed sunfish – Lepomis gibbosus.
123
Table 5.2 – WUA (weighted usable area) for the barbel (Luciobarbus bocagei) in the disturbed site and for the different boulder placement scenarios (BPi). WUA
values are presented for the different life-stages and for a combined population.
128
Table 5.3 – Description of the two tested configurations and summary of the mean values of the transit times for the barbel (Luciobarbus bocagei). The rate of successful negotiations is also presented. Conf. – configuration; Q – flow discharge; Ao – area of the orifice; hm – pool mean depth; Pv – volumetric power
dissipation.
xviii
plane 2 (above boulders) monitored by ADV. The number of fish (N) and mean (± SD) size of the individuals used in the experiments is also shown.
Table 6.2 - Passage efficiency (%) and time taken by fish (mean ± SD (min.)) to successfully negotiate the experimental pool-type fishway upon the different flow regimes. 2 (passage efficiency) and Mann-Whitney significance levels are also shown (ns – non-significant).
150
Table 7.1 - Description of the two tested flow regimes. Q – fishway discharge; hm – pool mean depth.
163
Table 7.2 – Point-grid information for the measurements performed with the Acoustic Doppler Velocimeter (ADV) at the 4 planes for each flow regime
164
Table 7.3 - Number of upstream movements (i.e. upstream pool-to-pool displacements of a single individual) performed by all the individuals of each species through the bottom orifice and surface notch in the experimental pool-type fishway in both flow regimes (Plunging and Streaming). The number of successes (i.e. the number of times a fish attained the top of the fishway by the negotiation of the fifth cross-wall) achieved by all the individuals of each species in both flow regimes is also shown. The values of Total length (cm), Standard length (cm) and Body mass (g) are also presented (average ± standard deviation).
168
Table 7.4 – Levels of significance of the two-factor PERMANOVA – permutation of residuals under a reduced model – testing the effects of flow regime plunging/streaming (Regime) and surface notch/bottom orifice (Opening type) on the upstream movements of barbel and chub. * - Significant with an α = 0.05.
Section I
Hydrological connectivity: causes and
consequences
“To write history without putting any water in it is to leave out a large part of the story. Human experience has not been so dry as that."
“Rivers flow on every continent and on all but the smallest island. They occur with an almost bewildering variety, ranging from a mere trickle to a mighty surge. As a source of water, rivers have always been objects of wonder and practical concern for people everywhere. They have acted as cradles for civilization and agents of disaster. A river may be a barrier or a highway. It can bear trade or sediment, culture and conflict. A river may inspire or it may terrify.
(…)
A river can cleave a big canyon and twist like a giant snake across its plains; plunge over great cliffs and stretch fingers of earth into the oceans. Rivers dominate landscapes, eroding and creating them. They are, without a doubt, the product of a complex suite of natural processes. But the evolution of many rivers has been driven as much by social systems as by natural ones, surprise though this may at first seem.”
Chapter 1
Introduction
Sente-se! Já está sentado? Pode-se encostar à vontade! Quero-o sentado comodamente e descontraído. Também pode fumar. O que importa é que me ouça exactamente. Está a ouvir-me bem? É que tenho uma coisa a comunicar-lhe que o há-de interessar. (…) Bertolt Brecht, Nº9 do suplemento a “Um Livro de Leitura Para Habitantes das Cidades”
7
1.1.
Rivers
Rivers have had a very considerable influence on human history. Rivers were the driving force for the first settlements of human beings. At first, they were a permanent source of water and food, further along the way they provided an ease of transportation. Still to our days, society is dependent of a multitude of freshwater ecosystem services. Some of them are the same since pre-historic times, like clean water provision, but other services have been required from these ecosystems since modern until contemporary times, e.g. pollution disposal and leisure (Wilson and Carpenter 1999, Jackson et al. 2001, Postel and Richter 2003). As a result, riverine ecosystems are amongst the most degraded by humans, and are thus some of the most imperiled systems in the world (Naiman and Turner 2000, Sala et al. 2000, Gleick 2003). Nevertheless, healthy river systems provide a river service dependence upon which human life relies (Postel and Richter 2003). To counteract this menace to ecosystems health and to allow these services to be maintained, major restoration efforts in riverine environments are starting to be undertaken (Bernhardt et al. 2005) as humans finally realize the full extent of the impacts forced upon such systems.
In rivers, flow is the overriding force, it is responsible for river geomorphology, it drives sediment transportation, it determines the habitats for fauna and flora, through carbon transport it controls food webs and has a direct impact over behaviour and life histories of animals and plants (Vannote et al. 1980, Frissell et al. 1986, Junk et al. 1989, Calow and Petts 1992, Thorp and Delong 1994, Matthews 1998, Fausch et al. 2002). This overriding force is composed by five elements: magnitude, duration, timing, frequency and rate of change. All five elements are present and act at different temporal and spatial scales which forced biota to evolve in a way to accommodate these variations (Poff et al. 1997, Lake 2003, Richter et al. 2003) (Box 1.1).
1.2.
Connectivity
Connectivity can be defined as a functional “exchange pathway of matter, energy and organisms” (Ward and Stanford 1995) or, from a hydrological perspective, as a “water mediated transfer of matter, energy and/or organisms within or between elements of the hydrologic cycle” (Pringle 2003) acting both at regional and global scales. Connectivity comprises four dimensions: longitudinal - along the stream; vertical - between the channel
8
and the hyporheic zone; lateral - between the stream channel and adjacent riparian and upland areas; and temporal - over time (Ward 1989, Brunke and Gonser 1997, Tockner et al. 1998) (Box 1.2). To these, variation at different landscape scale levels should also be added (Pringle 2001). Nevertheless, longitudinal connectivity is regarded as the most important connectivity dimension for freshwater fish species, because it allows upstream and downstream fish migration cycles to occur (Lucas and Baras 2001). The unimpaired longitudinal dimension is of the essence for the maintenance of a multitude of fish species (Fausch et al. 2002). Primarily due to the fact that the variety of habitats that provide vital conditions for fish, substrate for spawning, foraging grounds and seasonal refugia are spatially and temporally separated (Fausch et al. 2002). Longitudinal connectivity research can help to derive new insights about river dynamics and how spatial elements of the riverine landscape influence ecological processes. For that, both classical theories, such as the River Continuum Concept defined by Vannote et al. (1980) and the hierarchical classification of streams (Frissell et al. 1986, Pickett et al. 1989), as well as newer hypotheses on river evolutionary path and structural arrangements (e.g. River Discontinuum (Poole 2002), Network Dynamic Hypothesis (Benda et al. 2004), Riverine Ecosystem Synthesis (Thorp et al. 2006)) should be used (Fullerton et al. 2010).
Although connectivity has proved to be one of the major players in defining riverscapes and on providing for conditions for fish species to endure, it has not been awarded the consideration it deserves (Fullerton et al. 2010). Connectivity can be looked upon two ways, structural and functional, and both of these connectivity components should be analyzed to provide a better understanding of the biodiversity structuring factors at work in a river landscape (Ward et al. 2002). Structural connectivity refers to the topological structure of physically connected elements of the riverine landscape (Keitt et al. 1997). Functional connectivity refers to the relationship established between the fish species of the system and the structural connectivity, this relationship can vary according to fishes’ behaviour, ecology, and distribution within the riverine landscape (Tischendorf and Fahrig 2000, Taylor et al. 2006).
A variety of ecological questions can be encapsulated into the connectivity concept as it defines the connections between spatial elements, both in space and in time (Fullerton et al. 2010). Connectivity awareness has started to increase and became the focus of many ecological studies, including those of freshwater systems where it plays an important role (Wiens 2002). In fact, publications about connectivity (typically impacts of connectivity loss)
9 in ecology journals have increased from 0.5 to 2.5% in the past 10 years (Fullerton et al. 2010). Rivers are complex systems with great spatial and temporal variability, where the connections between the different elements are permanently shaped by large- and small-scale physical processes, altering constantly the structural connectivity and repeatedly affecting its functional component. In spite of the difficulties in studying such systems, connectivity has been the subject of a variety of studies (Ward 1989, 1997, Naiman et al. 1993, Pringle 2001, 2003, Amoros and Bornette 2002), but the relationship between structural and functional connectivity is still open for debate, and has to be addressed thoroughly.
Box 1.1 – River scales
In river systems there is an inherent directionality promoted by the flow of water, which progresses into shaping an important hierarchy, where the conditions present upstream influence the conditions and processes occuring downstream (Allan et al. 1997). Also, geomorphologic and ecologic processes operate differently at different spatial scales (Frissel et al. 1986).
These systems are organised in a way to incorporate successively lower levels. The hierarchy of a river system is spatially nested,
meaning that while all levels fall within the river basin, each segment, reach or habitat plays a part in the structure and function of the river systems.
A stream reach comprises multiple pool and riffle structures that are constituted by a variety of micro-habitat units. Reaches are found within stream segments that form sub-basins that contribute as tributaries to the primary stream of the river basin. The image below, adapted from Frissel et al. (1986), represents the scale levels at play in a river system.
Freshwater fish species may be very susceptible to connectivity limitations due to the fact that dispersal and recolonization paths are previously defined and limited to a single dimension, the river channel (Fagan 2002, Campbell et al. 2007, Muneepeerakul et al. 2007),
10
which contrasts with terrestrial or marine organisms that can disperse in two dimensions, making their habitat much more connected.
Box 1.2 - River dimensions
Ward (1989), in a seminal article, describes flowing water systems has having four dimensions.
Longitudinal dimension: Connection along the channel. This is the natural dimension of rivers and the one that was first noted. It is still considered to be the most important dimension for stream fish and is the central point of the present thesis.
Lateral dimension: Connection between the channel and the adjacent riparian/floodplain system. This dimension encompasses active and passive movements of organisms, exchange of nutrients and organic matter (Ward 1988). In addition, lateral connectivity can play a part in influencing successional structure of riparian vegetation that contributes to channel morphology, water temperature and light levels, habitat heterogeneity, quality, quantity and timing of allochtonous inputs.
Vertical dimension: Connection between surface and ground waters. The hyporheic zone is composed by interstice area beneath the stream and stream banks that is saturated with channel water. This is now considered to be an integral component of the river due to the important biogeochemical processes occurring there and because it allows for complex invertebrate communities to be created.
Temporal dimension: There is a hierarchy of time scales in ecological systems. The scale at which one tries to perceive the system depends on one’s object of interest. Rivers can be looked upon short, almost instant, to evolutionary time scales. For instance, when studying the response of a stream to hydropeaking, there is the instant response of the fish community, there is a latter response of the habitat below the dam and there is an even latter response by the species due to habitat alteration. Although expressed at different time scales these responses are intertwined.
Latter, Boon (1992) suggested that conservation actions need to account for a fifth dimension.
Conceptual dimension: Is a theoretic dimension that encompasses philosophy, policy and practice. It questions the motivation for restoration actions, and states that restoration actions should be planned within a broader environmental framework (Boon 1998).
Adding to these five dimensions, variation at different landscape levels should also be considered when studying freshwater systems (Pringle 2001).
1.3.
River regulation
Society needs forced rivers to be regulated through the construction of dams and weirs. This regulation is widespread and exists for irrigation demand, hydroelectricity production, flood control, river transport, recreational use, land reclamation in flood plains, among others (Ward and Stanford 1979, Petts 1984, Calow and Petts 1992). The construction of
11 dams and water retention hydraulic structures has increased since the middle of the last century (ICOLD 1998, Ward et al. 1999), and will continue to increase due to increasing water demand and the continuous threat of climatic changes. Estimates point to the existence of more than 16.7 million impoundments worldwide (Lehner et al. 2011). Several works have highlighted the fact that human pressures, especially dams have produced alterations in the abundance and endurance of fish populations (Marmulla 2001). Indeed, over 50% of the world’s largest rivers are negatively affected by barrier placement (Nilsson et al. 2005). These barriers severely alter flow velocity, water depth, create vertical outflow drops that modify thermal and hydrology regimes of river systems, promote the loss of original habitat reducing heterogeneity (Berkamp et al. 2000, Pizzuto et al. 2000, De Groot 2002), hamper the movement of river species (Warren and Pardew 1998, Wheeler et al. 2005), and deteriorate water quality through urban, industrial and agricultural waste water. The combined impact of all these alterations has changed dramatically the constitution of river fish communities (Lelek 1987, Bayley and Li 1992, Waidbacher and Haidvogl 1998, De Groot 2002, De Leeuw et al. 2005).
1.4.
Connectivity loss
Connectivity, or more correctly its opposing concept - isolation (Moilanen and Nieminen 2002), is considered one of the primary factors influencing species’ distribution in riverine environments (MacArthur and Wilson 1967, Levin 1974, Merriam 1984, Fahrig and Merriam 1985), where a single barrier immediately isolates contiguous segments of river (Jager et al. 2001). Dams and weirs promote a breach on the longitudinal connectivity of systems, leading to a significant habitat modification and alterations of the flow regime, with consequences on the existing biotic communities (Larinier 2001). Those impacts have been felt in North America (Quiros 1989, Baum 1994, Meyers 1994, Stolte 1994), Europe (Porcher and Travade 1992), Australia (Barry 1990, Mallen-Cooper and Harris 1990), Africa (Gourène et al. 1999), and Asia (Zhong and Power 1996, Morita and Yamamaoto 2002). These habitat transformations are hazardous, as the alteration of natural flow regimes modifies environmental cues that act as triggers for fish migration (Mallen-Cooper 1995). Migratory fish (Box 1.3) are particularly sensitive to connectivity loss caused by habitat fragmentation (Jungwirth et al. 1998, Lasne et al. 2007) as their ability to reach spawning grounds is seriously affected. Diadromous fish species are obligatory migrants that perform migrations
12
between marine and freshwater environments. For these species, the most downstream barrier completely isolates their access to the rest of the river network. Potamodromous species, although obligatory migrants, only perform migrations within the freshwater environment and are, therefore, able to use habitats found between barriers. Even though this could be seen as granting these species some resilience if suitable spawning habitats are present, the impacts of barriers on potamodromous are widespread (Moyle 1995, Muhar 1996, Dunham et al. 1997, Fagan et al. 2002, Morita and Yamamoto 2002). Such habitat and flow modifications are also usually favorable to generalist species, as so often is the case of exotic species, which are more adapted to the new lentic environments created by barriers (Vila-Gispert et al. 2005).
Although connectivity losses are frequently perceived as main causes of freshwater fish species decline, and its evidence well established for some fish groups such as diadromous species, it is much less clear when and how it affects the distribution of other freshwater fish groups, both potamodromous and sedentary fish. Diadromous fish are amongst the most studied fish species concerning the impacts of man-made structures on the persistence and abundance of their populations, but much less is known on the migratory ecology of potamodromous cyprinids (Lucas and Batley 1997). The establishment of river connectivity is increasingly seen as a basin wide task, and integrating various spatial and temporal scales is essential (Ward et al. 1999, Collares-Pereira and Cowx 2004). This type of information is needed not only to understand overall effects on the targeted populations of river fragmentation by different physical obstacles, but also to develop management guidelines for the connectivity increase to help conservation and management of stream fishes.
The magnitude of connectivity losses and the time period they affect are closely linked to the time of construction, the size and location of the dam, to the characteristics of the river system (Petts 1984, Genhrke and Harris 2001, Gehrke et al. 2002) and to the habitat loss for each particular species and life cycle stage. Therefore, connectivity losses are not linearly related to the number of obstacles, they depend on characteristics such as height, slope and flow alteration. Furthermore, losses are cumulative and dependent on the spatial scale considered (river reach, segment or basin) and on the home range and natural movements of the species affected (sedentary, potamodromous and diadromous). Dams can block or delay fish movements and as a result are responsible for the decline or eradication of many native species throughout Europe (Northcote 1998, Mader and Maier 2008). Even small
13 obstacles can have a significant effect on flow, temperature regime, movement of animals and habitat quality (Larinier 2001), thereby potentially causing change in the composition, structure and distribution of fish assemblages. The fragmentation of the river continuum by such obstacles negatively affects fish populations by increasing loss of genetic variability and risk of extinction through demographic, environmental and genetic stochasticity (Nicola et al. 1996, Peňáz et al. 1999). However, the effects of longitudinal connectivity loss on potamodromous and sedentary Iberian fish species are less well understood, because on one hand, local habitat conditions can mitigate connectivity losses, and on the other hand fish populations are also affected by other human pressures that frequently mask or interfere with connectivity effects.
Connectivity losses should always be viewed within a hierarchical spatiotemporal frame, both for environmental as for biological items (Matthews and Matthews 2003). The direct impacts of dams are more dramatic and immediate. But, and although most studies look at the impact of large hydroelectric developments on fishes (Garcia de Jalon et al. 1994, Chang et al. 1999, Mérona and Albert 1999, Peňáz et al. 1999, Gehrke et al. 2002), the changes in species richness, diversity and community composition (Pusey et al. 1995, Reyes et al. 1996, Gehrke et al. 2002) can also be due to the cumulative impact of small barriers (Nunn et al. 2008, Cote et al. 2009, Lucas et al. 2009).
The Mediterranean systems (Box 1.4) pose an interesting problem regarding the connectivity loss effects. These river systems present large flow variability and tend to naturally present less connectivity during extended parts of the year. The dry summers create extended periods of low to null flow in many parts of the river, naturally fragmenting the systems into a sequence of unconnected habitats (pools) (Gasith and Resh, 1999). As a consequence, fish species become confined in small isolated habitat patches which have the capability to sustain only a reduced number of animals (Pringle 1997, Collares-Pereira et al. 2002). At these temporarily confined habitats, fish face increased predation, competition for resources, water quality degradation (increase of temperature and salinity) and oxygen depletion. Species inhabiting Mediterranean rivers should therefore display adaptations to this natural fragmentation, through higher population resilience and behavioural mechanisms that propels them for a fast colonization of upstream segments when those are reconnected with the remaining river network. Population fragmentation is expected to reduce genetic polymorphism and augment genetic differentiation (Knaepkens et al. 2004). A barrier to fish movement can thus further genetically isolate and deteriorate upstream
14
populations (Knaepkens et al. 2004), leading to a process of genetic erosion that can increase the extinction risk of populations by promoting inbreeding processes and diminish evolutionary flexibility (Meffe and Carroll 1997).
Box 1.3 - Fish migrations
Longitudinal connectivity infringements are of particular concern for species that face the obligation to undertake migrations to complete their life cycle. Different migrations strategies exist enclosing in them different uses of the river network and different degrees of impact from connectivity hindrance (Morita and Yamamoto 2002, Dudley and Platania 2007). Migrations are biologically explained by a rational use of resources recuring to a spatial and temporal displacement according to the specific needs throughout the species life cycle. Population sustainability is closely linked to habitat characteristics, which are the guaranty of successful feeding, locomotion and reproduction (Lucas and Baras 2001).
Migrations can be defined as movements between two or more habitats that take place with a regular periodicity and are undertaken by the majority of the population (Northcote 1978, 1984, Smith 1985). “Migration” has thus far been used to describe movements in marine or freshwater environments and between these two. Here I will only address the migrations in which freshwater environments play a part.
Diadromy refers to obligatory migrants that perform movements between the marine and
freshwater environments. Barriers affect the ability of these species to attain nursery habitats essential for successful recruitment (Hall et al. 2011, Hitt et al. 2012). Diadromy can be divided according to the direction of movement:
i) Anadromy refers to species that live, grow and feed on marine environments, but perform migrations inland to freshwater systems where they find suitable grounds to reproduce;
ii) Catadromy refers to species that live, grow and feed on freshwater environments, but perform reproductory migrations to marine systems.
iii) Anfidromy referes to species that reproduce in freshwater systems, their larvae migrate towards the sea where they feed and grow for a short time period after which post-larvae and juveniles migrate back to freshwater systems where they feed and grow.
Potamodromy refers to obligatory migrant species that incur in reproductory movements exclusively within freshwater systems. Barriers affect the ability of species to move within the systems, causing populations extirpation (Winston et al. 1991, Luttrell et al. 1999).
The effects of connectivity loss in regions where rivers experience seasonal flow intermittency have been less studied. Mediterranean rivers are dominated by autochthonous cyprinids, ranging from large benthic potamodromous to small resident water-column species. River fish diversity is accompanied by morphologic and ecologic variations (Ferreira et al. 2007) as species evolved differently to be adapted to different riverine environments. These specializations can be grouped into different
morpho-15 ecological guilds that introduce differences in swimming abilities, behaviour and niche occupancy. To simplify studies, morpho-ecologic similar species can be grouped into guilds - assortment of organisms free of taxonomic strings that use a common array of resources (Fauth et al. 1996) – and a single species can be used as representative (Chan 2001) of one morpho-ecological guild. This method is suitable for multi-specific approaches (Leonard and Orth 1988).
Box 1.4 – What is a Mediterranean river?
Mediterranean rivers are characterised by a predictable annual cycle of flood and drought that varies in intensity according to levels and duration of annual and interannual rainfall (Gasith and Resh 1999). The climate therein has a high degree of seasonality and is characterized by having skewed hydrographs with extended dry summers, which produce seasonal droughts, and by cool rainy winters. This seasonality is coupled with a high hydrologic annual variability. These systems can be found in five regions where they are influenced by cool off-shore ocean currents: Mediterranean basin (the largest portion and the one from which the epithet was derived), California, central Chile, southern South Africa, southwestern and southern Australia (vide map below).
This climatic specificity has created regions of high endemism, and Mediterranean regions are
considered biodiversity hot-spots. Nonetheless, Mediterranean regions have foster human societies since their birth. Only 4.3% of the Mediterranean biome is protected and 31% has already been converted into urban areas and high impact agriculture lands, making the Mediterranean biome one of the most unprotected biomes on Earth (The Nature Conservancy 2007). The human dependence on water may aggravate human impacts on rivers in these areas due to irregular water availability. The increasing threat of climate change will limit water availability even further and will facilitate the spread of alien species.
The marked seasonality of these regions has a determinant impact shaping rivers and their fish communities. Mediterranean fish species evolved to be adapted to this seasonality, and are naturally more resilient when faced with connectivity hindrance.
16
1.5.
Connectivity enhancement
There is an increasing concern on today’s society over the sustainment of the ecosystems services provided by rivers. To off-set some of the harmful impacts forced upon rivers by human needs and will, river restoration and requalification plans have experienced a boom since the 1980s in number and in allocated resources (Kondolf and Micheli 1995, NRC 1996, Holmes 1998, Bash and Ryan 2002, Henry et al. 2002, Ormerod 2003). Additionally, legislation is starting to be more stringent in relation to impacts enforced on natural ecosystems and species. Recently, the European Water Framework Directive (EWFD – European Commission 2000) was launched by the EU as a tool for adequate management of river basins, the natural geographical and hydrological unit. One of the key objectives of the EWFD is to achieve ‘‘good ecological status’’ of running waters by 2015. The re-establishment of longitudinal connectivity for fish on the basin level is therefore crucial for achieving the main target of the EWFD (Mader and Maier 2008).
Connectivity rehabilitation can be achieved through the installation of fishways, creation of environmental flow regimes suitable for the enhancement of fish movements or the removal of the artificial barrier. The best method to reconnect barrier fragmented systems is undoubtedly the removal of all instream structures that act as barriers (Roni et al. 2002). It is, nonetheless, an endeavour prone to failure due to limiting financial and logistic constraints and to the loss of important services (flood control, irrigation and water supply) provided by these structures. Fishways are a more realistic solution to provide connectivity enhancement as they allow fish to move freely, up and downstream, while working with environmental flow regimes. Nevertheless, both of these options are being used to restore connectivity of river networks (Bednarek 2001, Hart et al. 2002, Calles and Greenberg 2005), because they are preferable over strict habitat enhancement solutions, particularly for isolated populations (Auer 1996).
1.5.1. Prioritization
Restoration objectives are often hampered by budget limitations. There is thus the need to prioritize restoration actions in order to correctly allocate often scarce resources to where they are most needed in order to achieve the restoration goals (Kemp and O’Hanley
17 2010, O’Hanley 2011, Nunn and Cowx 2012). Methodologies constructed to summarize complex data are extremely helpful and their use is increasing (Spellerberg 1993, Olivier and Beattie 1994, Graça and Coimbra 1998, Harris and Silveira 1999, Ladson et al. 1999). These methods facilitate the decision making process by making the data intelligible to everyone while guarantying scientific accurateness (Karr and Chu 1999, Knapp et al. 2003, Paul 2003). Grant et al. (2007) defined rivers as a unique component of spatially structured networks to which special attention must be granted. Because fluvial landscape ecology is in its infancy and has not fully developed into an integrated field, and river geometry and network makes it difficult to apply terrestrial based landscape metrics, there is the need for concepts and methodologies devised specifically for rivers (Poole 2002, Wiens 2002).
Most of the prioritization tools for connectivity restoration are secluded in grey literature (Kemp and O’Hanley 2010) and are generally unavailable to the decision-makers. Furthermore, the existing scoring-and-ranking systems have a limited scope of action because they only consider the impacts of isolated barriers, ignoring the cumulative non-additive impacts of all barriers in a given network (O’Hanley and Tomberlin 2005, Kemp and O’Hanley 2010). Another limitation of the existing methods is that the prioritizing philosophy aims at increasing connected river length (Mader and Maier 2008, Kocovsky et al. 2009), overlooking the habitat suitability/availability increase. These prioritization schemes favor the structural over the functional connectivity. In fact, Fullerton et al. (2010) defined the development of methodologies to tackle the constrains of riverine structure as one of the most important challenges to understand the consequences of connectivity for river fishes. An understanding of the barriers effect on fish movements, the position of barriers within the river network, the size of the disconnected habitats, suitability of those habitats and hindrance to access to suitable habitats are essential to develop schemes of ranking priority restoration actions (Roni et al. 2002).
Graph theory (Box 1.5) is housed on simple concepts and treats spatial elements of a landscape as nodes and the relationships between those landscape elements as links (Dale and Fortin 2010). Spatial graphs are a special case of Graph theory, where the nodes, besides representing spatial structures, have a location and the relationships between those nodes (links) are defined by the location of nodes (Fall et al. 2007). This method has been applied extensively to landscape studies (Urban and Keitt 2001, Minor and Urban 2008, Dale and Fortin 2010, Galpern et al. 2011), but recently this technique has been applied to river networks (Schick and Lindley 2007, Eros et al. 2011, 2012) and has proved to be an excellent
18
connectivity assessment tool. It allows understanding the connectivity of a riverscape from two distinct perspectives: backwards, perceiving how the network got fragmented (Keitt et al. 1997, Bunn et al. 2000, Urban and Keitt 2001); and forwards, perceiving the impact of projected connectivity restoration actions on the overall network connectivity (Palmer et al. 2005). This theory provides the means to study the non-additive cumulative impacts, on longitudinal connectivity, by considering not only the isolated effect of each barrier but also the joint effect of all artificial barriers present in a system.
1.5.2. Instream structures
Undisturbed rivers sustain fish populations that are naturally adapted to the environment. These rivers can act as benchmarks for restoration projects (Boavida et al. 2011). The Field of Dreams Hypothesis (Palmer et al. 1997) has been applied, as the underlying reasoning, to several restoration plans. The general idea is that if you restore a river stretch, fish will return to colonise it. But, in order to restore degraded sites, the specific factors that limit fish populations must be addressed (Rosenfield and Hatfield 2006, Feld et al. 2011). Fish habitat depletion and fragmentation are commonly compensated through mimicking the natural undisturbed physical structure of the river environment (Shamloo et al. 2001, Katopodis 2002). This mimicking engineering design is often referred to as physiomimesis, a design method useful not only for restoration and habitat improvement, but also for fish passage design (Newbury and Gaboury 1993, Shrubsole 1994, Katopodis 1995, Marsden 1995, Katopodis 1996, Katopodis et al. 2001).
To promote habitat improvement and reduce fragmentation, the installation of instream structures such as submerged weirs, boulders, flow deflectors and logs on degraded river stretches has been extensively used (Reeves et al. 1991, Frissel and Nawa 1992), improving habitat quality and biodiversity (Cowx and Welcome 1998, Roni et al. 2006). These structures develop localized alterations to the channel morphology quite rapidly. If a flood event occurs, habitat changes promoted by the implanted structures will be seen within the first year (Fuller and Lind 1991). Boulder placement is a method for improving fish habitat that is more effective on smaller streams (Stewart et al. 2009) because it changes the physical conditions of the stream by increasing pool habitats and water depth (O’Grady 1995, Vehanen et al. 2003, Roni et al. 2006). These structures also provide fish with cover from visual predators by increasing turbulence and scour, and are known to provide
19 spawning grounds for litophilic fish due to increased gravel retention (Roni et al. 2006) as well as retention of organic matter, contributing for the improvement of food webs (Negishi and Richardson 2003). Boulder placement has been extensively examined for salmonids (O’Grady 1995, Vehanen et al. 2003, Roni et al. 2006), but the effectiveness of boulder placement on the enhancement of habitat for non-salmonid species was only scarcely accessed (Roni et al. 2006).
Box 1.5 – Graph theory
Graph theory is the study of graphs, third lattice mathematical structures that model pairwise relationships between objects (Urban and Keitt 2001). A graph can thus be described as a collection of nodes and of edges that connect pairs of nodes; and can be represented as G = (N,E), where N is a set of n nodes linked by a set E of e edges (Harary 1969). This has been extensively applied in geography, information technology and computer science (Bunn et al. 2000), mostly concerning efficient flow and connectivity in networks (Gross and Yellen 1999). This theory has been applied to rivers and has shown to adapt well to these constricted networks (Schick and Lindley 2007, Eros et al. 2011, 2012). Below are some definitions of key graph theory terms and vocabulary used throughout the thesis.
Node: Dimensionless point. A set of nodes (elements) compose the graph network. Nodes can exist on a graph without any associated edge, and can be the endpoint of the network.
Edge: Link between two nodes, representing the relationship between the nodes. Edges must have nodes at their ends, each edge needs two nodes. In the present thesis “Edges” are referred to as “Links”.
Network: Graph structures in which the nodes are usually weighted by characteristics like abundance, length, area, habitat suitability, etc.; and where edges represent interactions such as physical connections, which can be weighted and have asymmetrical directionalities. Spatial graph: Graph structure characterized by the spatialization of the nodes. The endpoints of edges are defined by the location of the nodes.
Connectivity: A graph has a high degree of connectivity if node or edge connectedness is high.
Subgraph: Subset of nodes of a graph.
Schematic representation of a graph. Nodes are represented by circles and edges by lines.
20
1.6.
Fishways
Fish ability to recolonise a river stretch depends equally on the existence of suitable habitat as on the ability to navigate there (Hughes 2007). The investment on restoration should be done in an integrated manner, bonding habitat/stretch restoration with connectivity enhancement (Pringle 2003, Kondolf et al. 2006). Otherwise, newly restored habitats will be unconnected and the effort made will be unsuccessful. This is crucial to systems management and conservation (Muhar 1996, Stanford et al. 1996, Cooper and Mangel 1999), as species may need a variety of habitats during their life cycle and may display distinct life histories and behaviours that are evidentiated at different spatial scales.
The construction of fish migration facilities has been one of the most common approaches to mitigate the negative effects associated with the presence of obstacles to fish migration (Larinier 2002, Santos et al. 2005). However, due to their multiple designs and configurations, ranging from conventional ladders to nature-like oriented structures (Box 1.6), the behaviour of fish when facing such devices is virtually unknown and their success is often questionable (Katopodis and Williams 2012). It is rather challenging to ensure that flow and turbulence patterns in each fishway type can provide suitable swimming conditions for multiple fish species.
Pool-type fishways are one of the most widespread types (Larinier and Marmulla 2004). These facilities consist of a rectangular flume with cross-walls arranged in a stepped pattern, forming consecutive pools with water levels increasing in the upstream direction. These pools offer resting areas for fish to recover after cross-wall negotiation and provide an appropriate dissipation of water energy between consecutive pools to ensure that the flow pattern is similar in each pool (Larinier and Marmulla 2004). The cross-walls may be equipped with different openings, such as surface notches and/or submerged orifices at the bottom, which are used by fish to move from pool to pool. The most common pool-type fishway in southwest Europe is the alternate surface notch and submerged orifice design (Larinier 2008) which need a small water flow to operate, a crutial factor in latitudes with extended low flow periods. Such facilities can accommodate moderate upstream water level variations without the need for installing any upstream flow-regulation section. Flow in these facilities depends on the size of the river and can vary from less than 0.1 m3.s-1 in small mountain streams to more than 2 m3.s-1 in large rivers. Head drops between pools can vary between 0.30-0.45 m for salmon and sea-trout, to less than 0.20 m for cyprinids and other
21 species with limited swimming abilities, the length of the pools may vary from 1.2 m to more than 4.5 m, with common fishway slopes of 10 to 12% (Larinier 2008).
The normal flow circulation in a pool-type fishway is the plunging regime. This circulation is created by the jet from the upstream pool plunging towards the fishway floor, moving downstream along the floor, then rising along the face of the next cross-wall and either dropping over the notch or rolling back upstream along the surface of the pool. The streaming flow regime typically occurs at higher flow levels relative to the plunging regime. When streaming flow occurs, a continuous surface jet passes over the crests of the cross-walls and skims along the surface of the pools. Plunging, streaming and other flow regimes that occur in pool-type fishways, depending on slope, discharge, and weir spacing, are presented by Ead et al. (2004) (Box 1.7). Fish selection for either orifices or notches will depend on the species, swimming ability and on the type of flow regime (plunging or streaming) through the fishway (Katopodis 2005).
When working with determined terms one must be certain of their meaning, because they are frequently misused in ecology, promoting communication problems, only solved by correct term determination. Larinier (2008) defined the terms effectiveness and efficiency of fishways. Effectiveness is a qualitative concept that determines if the fishway is negotiable by all target species during the migration period. Efficiency is on the other hand a quantitative concept that refers to the fishway’s performance defined by the proportion of the population that successfully navigates the fishway in a suitable time frame. Throughout the thesis these terms are used and applied as defined above. Nevertheless, the terms might be at times misused due to concurrence with cited literature.
Noonan et al. (2012), on a review of passage efficiency in existing fishways, found that although pool-type was the most efficient technical fishway type both for salmonids and non-salmonids, design features of many existing fishways seem to match fish species needs rather poorly. Most of the fish transposition devices of Iberian regions are not suited for native migrants, since they were built based on guidelines created for salmonids (Pinheiro and Ferreira 2001) which have movement and jumping abilities quite different from those of non-salmonid fish. Only the very best designed fishways can approach high performance rates, while even well-designed fishways have variable success due to differences in fish swimming ability, behaviour (Hinch and Bratty 2000, Katopodis 2005, Katopodis and Gervais
22
2012) and physiologic state (Pon et al. 2009, Hasler et al. 2011), as well as hydraulic (Katopodis and Williams 2012) and turbulence parameters (Silva et al. 2012).
Box 1.6 - Fishways
Fish transposition devices, often termed fish passes, fish ladders or fishways are constructed at barriers to aid fish negotiation of these transversal structures that hinder longitudinal connectivity. Fishways have been regularly built since the 1850’s, following the implantation of the first hydroelectric developments during the industrial revolution (Kamula 2001). We can divide fishways into three major groups: technical, nature-like and special (FAO/DVWK 2002).
Technical fishways
Pool-type: Creates a succession of stepped pools that divide the height to be negotiated and provide adequate energy dissipation at each step. Fish negotiation of the cross-walls is done by the orifices that can be placed near the bottom, at the surface or a combination of the two.
Vertical slot: Similar to pool-type fishways, in which the openings are extended from the surface until the bottom creating slots. Each cross-wall can be equipped with one or two slots.
Denil: Linear channel with baffles arranged at regular short intervals and angled against the main direction of flow. The baffles create back flows that dissipate a great deal of energy and cumulatively allow a low flow velocity to be shaped near the bottom of the baffles. This fishway can be built with relatively steep slopes.
Nature-like fishways
Bottom ramp: Occupies the total width of the river channel. It aims at dispersing the hydraulic head (difference in the water level between the impoundements and the water surface downstream) over a determined river length by
maintaining a gentle hydraulic gradient of the slope.
Fish ramp: Similar to bottom ramps. Integrated in a portion of the weir, occupies only a part of the river width and concentrates all discharge at low and intermediate water levels.
Bypass channel: Consists on a side-channel that mimics a natural river. These structures can occupy a vast area due to the usually low slopes. Besides helping fish to move past the barrier, bypass channels have the additional advantage of generating new habitat for fish species.
Special fishways
Eel ladders: These can be divided into two types: i) Eel pipes – pipes filled with brush-like structures or gravel, fitted into the base of the barrier. These structures have proved to be not very effective due to cluttering; ii) Eel channels – small shallow channels with brush-like structures or gravel placed at the bottom.
Fish lock: Consists of a lock chamber limited by a lower inlet and an upper outlet structures with closing devices. These devices work by lowering the lock chamber water level to match the inlet water level, then a guiding current is created to attract fish into the lock chamber. The chamber is locked and water level raised to match the outlet level, flow coming from headwaters attracts fish out of the lock chamber.
Fish lift: Fish are attracted to the lift by a guiding current. A trough “captures” the fish by moving upwards until the headwater, where a guiding current guides fish out of the lift. Optimal to be placed at high barriers, and in places were available space is limited, it is also advantageous in locations with presence of low swimming ability species.
23 Turbulence is a measure of tree-dimensional variation in flow velocity that has direct impact on the fish swimming energy expenditure (Liao et al. 2003), increasing the costs of fishway navigation (Enders et al. 2003). When the turbulence is very high fish might be injured or even die (Cada 2001, Odeh et al. 2002, Neitzel et al. 2004). To reduce navigation costs, fish may exploit the vortices generated by the passage of water around structures, by the motion of other fish (Liao 2007, Przybilla et al. 2010) or even by their own motion (Liao 2003). Recent studies have pointed out the differing effect of turbulence according to its scale in relation to the size of the fish; small scale turbulence can in fact aid fish’s locomotion, contrarily larger scale turbulence can disorientate fish and detract its movements (Odeh et al. 2002, Tritico and Cotel 2010). Reynolds shear stress is a force created by the transfer of momentum between adjacent water layers of varying velocities (Tennekes and Lumley 1972) and also infers on fish behaviour. When exercised parallel to a fish it induces alteration in swimming performance and stability (Odeh et al. 2002) causing injuries or death at extreme levels (Cada 2001, Odeh et al. 2002).
1.6.1. Technical holistic fishway
Several authors (Hinch and Rand 2000, Pavlov et al. 2000, FAO/DVWK 2002, Baker and Boubée 2003) state that the inclusion of heterogeneity through the use of structures like logs, boulders or stones at the base of fish passes may potentiate fish negotiation of such devices. Boulder placement at the bottom of fishways presumably potentiates fish passage of pool-type fishways (FAO/DVWK 2002), as the reduction of flow velocity near the bottom promoted by these structures facilitates fishway negotiation particularly by benthic species such as the gudgeon (Gobio lozanoi), loach (Cobitis paludica) and eel (Anguilla anguilla). The boulder substrata increase roughness that allows species with limited swimming capabilities to take advantage of the small velocity refuges, created by each boulder, to migrate upstream, and also to benefit from the velocity breaks and hydraulic shadows that create resting areas. A parameter that should also be regarded as key is the relative depth of flow – relation between the water depth in a pool and the height of the boulder. Shamloo et al. (2001) studied the flow around a hemispherical boulder in a rectangular channel, and found that the relative depth of flow defined the flow regime around an obstacle which influenced the suitability of hydraulic conditions for fish passage. Lower relative depths (low water depth and high boulders) are, in principle, more favourable for fish movements because