JEL Classification: C23, E52, G10
Keywords: sovereign bonds, non-conventional monetary policy, euro area, panel data
Euro Area Sovereign Yields and the Power of
Unconventional Monetary Policy*
António AFONSO** - ISEG/UL – Universidade de Lisboa, Portugal (aafonso@iseg.utl.pt)
corresponding author
Mina KAZEMI - ISEG/UL – Universidade de Lisboa, Portugal (mminakazemi@gmail.com)
Abstract
We assess the determinants of long-term sovereign yield spreads, vis-à-vis Germany, using a panel of 10 Euro area countries over the period 1999.01–2016.07 notably regarding the ECB’s conventional and unconventional monetary policies. Our findings indicate that the international risk, the bid-ask spread and real effective exchange rate increased the 10-year sovereign bond yield spreads, while sovereign ratings’ improvements decreased the spreads. Moreover, Longer-term Refinancing Operations and the Securities Market Program decreased the yield spreads. The overall announcements of the unconventional policies also significantly decreased the yield spreads, notably in the periphery countries.
1. Introduction
After the 2010-11 sovereign debt crisis in the Economic and Monetary Union (EMU) and the significant increase of the spreads on 10-year sovereign bond yields vis-à-vis Germany, there was also an increase in the credit risk premium for periphery countries. The existing literature has confirmed that both international and country-specific risk factors such as liquidity or default risk premium, have significant impact on bond yield differentials, but little evidence is available regarding the role of the ECB securities’ purchases. This is a relevant issue since sovereign bond yields are used as benchmark for private debt markets, like the yields on German Bunds for the euro area.
In fact, several studies have found that sovereign bond yield spreads are driven by international risk factors (e.g. Codogno et al. 2003, Geyer et al., 2004, Pozzi and Wolswijk 2008, Favero et al., 2010). Regarding liquidity risk this was a key factor for yield differentials in the EMU countries mentioned notably by Gomez-Puig (2006) and Codogno et al. (2003), Afonso et al. (2012), Constantini et al. (2014). Afonso, Arghyrou and Kontonikas (2014), by assessing the determinants of the government bond yield spreads for 10-euro area countries using monthly data for the period from January 1999 to December 2010 report also the role of the credit agencies.
In the aftermath of the financial crisis several central banks have been conducting unconventional monetary policy, which is part of a broader category of balance sheet policies where the central bank uses its balance sheet to affect asset
* We thank two anonymous referees for very useful suggestions. The opinions expressed herein are those of the authors and do not necessarily reflect those of the authors’ employers.
** REM – Research in Economics and Mathematics, UECE – Research Unit on Complexity and Economics. UECE is supported by FCT (Fundação para a Ciência e a Tecnologia, Portugal)
prices and financial market conditions that can be distinguished from the interest rate policy (Borio and Disyatat (2009), Joyce et al. (2012)).
Regarding the literature that focus on the effect of conventional and unconventional policy measures we can mention Pattipeilohy, et al. (2013), which found that Longer-term Refinancing Operations had a favorable short-term effect on sovereign bond yields. In addition, Ghysels et al. (2017) report that Securities Market Program (SMP) interventions have been effective in reducing yields of government bonds for Ireland, Greece, Spain, Italy, and Portugal. Gibson et al. (2016) also find a negative effect of the SMP on the yield spreads. Altavilla et al. (2015) find that the ECB’s APPs has significantly reduced yields in a broad set of market segments. They conclude that the effects of the asset purchases are not just limited to times of financial market stress but also to the differences of the strength of the transmission channels across risk and liquidity regimes. Additionally, Andrade et al. (2016) grouped the transmission channels of the ECB’s APPs to three main categories of signalling channel, asset valuation channel (or portfolio rebalancing channel) and re-anchoring channel.
For the US, Krishnamurthy and Vissing-Jorgensen (2011) find evidence of six transmission channels through which the Federal Reserve’s quantitative easing (QE) lowers medium and long-term interest rates, namely signalling channel, liquidity channel, safety premium channel, prepayment risk premium channel default risk channel and inflation channel.
In another strand of the literature, Aßmann and Boysen-Hogrefe (2012), Bernoth and Erdogan (2012), D’Agostino and Ehrmann (2013), and Afonso and Jalles (2016), by analysing the time-varying coefficient of the determinants of sovereign yield spreads also highlight the relevance of a volatility index, bid-ask spread, and debt-to-GDP ratio. There is also evidence that the relevance of the determinants can change over time. Several of those fundamentals such as general risk aversion and liquidity risks were not priced in the first years of the monetary union.
Finally, some studies focused on the role of the redenomination risk on the rising bond yield spreads across euro area countries. For instance, Di Cesare et al. (2012) conclude that the eventual reversibility of the euro has likely played a key role in the rising sovereign yield spreads. Klose and Weigert (2014) show that this risk had been present in sovereign yield spreads between September 2011 and August 2012.
Therefore, we add to the literature by assessing the role of the ECB unconventional monetary policy measures on sovereign yield spreads using a panel of euro area countries and monthly data over the period 1999–2016. In addition, we consider both the size of the measures and the announcement dates as determinants of the sovereign yields, for core and for periphery euro area economies.
Our findings show that the international risk, the bid-ask spread and real effective exchange rate increased the 10-year sovereign bond yield spreads, while improvements of the sovereign ratings and of the outlooks from S&P, Moody’s and Fitch, have reduced the sovereign bond yield spreads.
Moreover, Longer-term Refinancing Operations (LTROs) and the Securities Market Program decreased the yield spreads. The overall announcements of the unconventional policies also significantly decreased the yield spreads, particularly in the periphery countries.
The reminder of the paper is organized as follows. Section two explains the methodology. Section three reports and discusses the results of the analysis. Section four is the conclusion.
2. Methodology
We used a panel of 10-euro area countries namely Austria, Belgium, Finland, France, Greece, Ireland, Italy, the Netherlands, Portugal and Spain, over the period 1999.01-2016.07.
For the euro area, which is the country sample of our study, we use the commonly accepted benchmark, the yield on German government bonds, and we compute the sovereign bond spreads in the euro area by subtracting the German yield from the yield of other euro area member states. Therefore, the sovereign bond spread is the difference between the sovereign yield of country i and the benchmark yield of Germany (yieldDE) with the same maturity in t:
𝑠𝑝𝑟𝑒𝑎𝑑𝑖𝑡= 𝑦𝑖𝑒𝑙𝑑𝑖𝑡− 𝑦𝑖𝑒𝑙𝑑𝐷𝐸𝑡. (1)
We use the following specification for 10-year sovereign bond yield spreads against Germany, where we assume that the error term is an i.d.d. process:
𝑠𝑝𝑟𝑒𝑎𝑑𝑖𝑡= 𝛼 + 𝛽1𝑣𝑖𝑥𝑖𝑡+ 𝛽2𝐵𝐴𝑆𝑖𝑡+ 𝛽3𝑅𝐸𝐸𝑅𝑖𝑡+ +𝛽4𝐸𝑥𝑝𝑒𝑐𝑡𝑒𝑑_𝐷𝑒𝑏𝑡𝑖𝑡+
𝛽5𝐸𝑥𝑝𝑒𝑐𝑡𝑒𝑑_𝑂𝐵𝑖𝑡+ 𝛽6𝑎𝑣𝑒𝑟𝑎𝑔𝑒_𝑟𝑎𝑡𝑖𝑛𝑔𝑖𝑡+ 𝛽7𝑎𝑣𝑒𝑟𝑎𝑔𝑒_𝑜𝑢𝑡𝑙𝑜𝑜𝑘𝑖𝑡+
𝛽8𝐿𝑇𝑅𝑂𝑖𝑡+ 𝛽9𝑁𝑒𝑡_𝐿𝑇𝑅𝑂𝑖𝑡+ 𝛽10𝑇𝐿𝑇𝑅𝑂_𝐼𝑖𝑡+ 𝛽11𝑆𝑀𝑃𝑖𝑡+ 𝛽12𝐶𝐵𝑃𝑃1𝑖𝑡+
𝛽13𝐶𝐵𝑃𝑃2𝑖𝑡+𝛽14𝐶𝐵𝑃𝑃3𝑖𝑡+𝛽15𝐴𝐵𝑆𝑃𝑃𝑖𝑡+ 𝛽16𝑃𝑆𝑃𝑃𝑖𝑡+ 𝜀𝑖𝑡.
(2)
We use the 𝑣𝑖𝑥𝑖𝑡, Chicago Board of Exchange Volatility Index (VIX), as a
proxy for the international risk aversion factor with higher (lower) values increasing (decreasing) bond spreads (also considered by Beber et al. (2009), Gerlach et al. (2010), Bernoth and Erdogan (2012)). Moreover, we used the US corporate to government bond spread (𝑈𝑆_𝑠𝑝𝑟𝑒𝑎𝑑𝑖𝑡) alternatively as a factor capturing the
international uncertainty in a separated regression model for robustness check purposes. 𝐵𝐴𝑆𝑖𝑡 is the 10-year bond yield bid-ask spread, used as a measure of
illiquidity. The higher (lower) values of the bid-ask spread indicate a decrease (increase) in liquidity and increases (decreases) yield spreads (also in line with Codogno et al. (2003) and Gomez-Puig (2006)).
𝑅𝐸𝐸𝑅𝑖𝑡 is the real effective exchange rate and a positive (negative) change
appreciates (depreciates) the currency thus increasing (decreasing) yield spreads (see also Aryghyrou and Kontonikas (2012)). 𝐸𝑥𝑝𝑒𝑐𝑡𝑒𝑑_𝐷𝑒𝑏𝑡𝑖𝑡 denotes the expected
government debt-to-GDP ratio against Germany, and an increase indicates a higher risk so we expect the spreads to increase. 𝐸𝑥𝑝𝑒𝑐𝑡𝑒𝑑_𝑂𝐵𝑖𝑡 denotes the expected
government budget balance-to-GDP ratio against Germany, with an increase implying a decrease in yield spreads (see notably Gerlach et al. (2010), Bernoth and Erdogan (2012)).
In addition to the baseline model, we included the 𝑎𝑣𝑒𝑟𝑎𝑔𝑒_𝑟𝑎𝑡𝑖𝑛𝑔𝑖𝑡 and the
𝑎𝑣𝑒𝑟𝑎𝑔𝑒_𝑜𝑢𝑡𝑙𝑜𝑜𝑘𝑖𝑡 (simple average of the three main credit ratings, Standard &
Poor’s, Moody’s and Fitch) to investigate the impact of sovereign credit ratings and announcements on the EMU sovereign bond yields. In this case we have followed
Afonso et al. (2012) in transforming the qualitative rating scores of the three main rating agencies into a linear scale, which is then easily tractable for the estimations.1
Moreover to capture the credit risk premium we alternatively included the CDS spreads vis-á-vis Germany to the baseline model.
Regarding the monetary policy instruments of the ECB we used the growth rate of two open market operations, the Longer-term Refinancing Operations (LTRO) and the first Targeted Longer-term Refinancing Operations (TLTRO_I), as well as the growth rate of different asset purchases programmes such as the Securities Market Program (SMP), the first Covered Bond Purchase Program (CBPP1), the second Covered Bond Purchase Program (CBPP2), the third Covered Bond Purchase Program (CBPP3) the Asset Backed Securities Purchase Program (ABSPP) and the Public Sector Purchase Program (PSPP). Expecting that these policies are effective in reducing the sovereign bond yield spreads in the EMU.
3. Empirical Analysis 3.1 Baseline Results
We have collected the data from various sources and Table A1 in the appendix reports the data sources. Given our period of analysis, with monthly data between 1999:01 and 2016:07, the maximum time span available consists of 2090 cross-section observations.
We have included standard and non-standard measures of the ECB, namely several open market operations and asset purchases programmes. Regarding the open market operations, we used data on all the Longer-term Refinancing Operations with the maturity from 3 months (the regular LTRO) to 3 years LTRO which are liquidity providing reverse transactions and provide longer-term refinancing to the financial sector (Net-LTRO)2. The first Targeted Longer-term Refinancing Operations
(TLTRO_I) provides financing to credit institutions for periods up to four years and aims at easing private sector credit conditions and stimulating bank lending to the real economy, therefore, strengthening the transmission of monetary policy. It was announced on June 2014. This first series of the TLTRO together with the second series (which was announced on March 2016) and the APPs are part of a package of measures that have similar objectives.
Regarding the asset purchases carried out by the ECB since 2008, we studied the effects of the three terminated programmes (SMP, CBPP1 and CBPP2) and four ongoing programs namely the Expanded Asset Purchase Programmes (APPs). The Securities Market Programme (SMP), launched in May 2010 aimed to address malfunctioning of public and private debt securities markets and restore an appropriate monetary policy transmission mechanism. Under the first Covered Bond Purchase
1 We group the ratings in 17 categories by putting together the few observations below B -, which are given
the value one, while AAA observations receive the value 17.
2 LTROs provide additional longer-term refinancing to the financial sector. We denoted the holdings of the
Longer-term Refinancing Operations by LTRO, it includes LTROs, TLTRO_I and TLTRO_II. It is collected from the weekly financial statement of the ECB using the values at the end of each month. These values are in Euro billions. Net-LTRO is the holding of the LTROs that excludes TLTROs (𝑁𝑒𝑡_𝐿𝑇𝑅𝑂𝑡= 𝐿𝑇𝑅𝑂𝑡−
𝑇𝐿𝑇𝑅𝑂_𝐼𝑡− 𝑇𝐿𝑇𝑅𝑂_𝐼𝐼𝑡). From the 1 September 2014 the values are based on our calculations using the
Programme (CBPP1), which was launched on July 2009, the ECB purchased euro-denominated covered bonds issued in the euro area with the goals of promoting the ongoing decline in money market term rates, easing funding conditions for credit institutions and enterprises, encouraging credit institutions to maintain and expand their lending to clients and improving market liquidity in important segments of the private debt securities market. Therefore, supporting a specific segment of the financial market that is important for banks funding and had been specially affected by the financial crisis.3 The Second Covered Bond Purchase Programme (CBPP2) was
launched on November 2011 with the similar objectives as the CBPP1 and it ended when it reached the nominal value of €16.4 billion.
The Expanded asset purchase programmes (APPs) (ongoing purchase programmes), namely, the third Covered Bond Purchase Programme (CBPP3) the Asset Backed Securities Purchase Programme (ABSPP), Public Sector Purchase Programme (PSPP) and the Corporate Sector Purchase Programme (CSPP) aim at further enhancing the transmission of monetary policy, facilitating the credit provision to the euro area economy, easing borrowing conditions for households and firms and therefore contributing in returning inflation rates to levels closer to 2% which is consistent to the primary objective of the ECB that is to maintain price stability.4
Regarding the conventional and non-conventional instruments of monetary policy in the euro area, we summarise them in the Appendix Table A2. For instance, it is possible to observe that the ECB CBPP1 was announced as earlier as May 2009.
Moreover, for the quarterly fiscal forecasts, sourced from the European Commission, we use them in the three months of each quarter in order to align the data frequency of such variables with the monthly frequency. For the daily frequency series, as VIX and sovereign bond yields, we align them to a monthly frequency by using the end of the month observations.
To examine the time series properties of the data we test for the existence of unit roots using the Im-Pesaran-Shin unit root test. As reported in the Annex the null hypothesis of non-stationarity is broadly rejected for the sample series. For our panel analysis, we have estimated equation (2) via OLS and 2SLS and the results of the Hausman test confirms the use of a fixed effects model (where we reject the null hypothesis in the favour of the alternative hypothesis which indicates that the preferred model is the fixed effect model). The result of the Hausman test for the baseline model is represented in Table 1. Due to the natural correlation between the expected debt and the expected budget balance, we do not include them together in the specifications at the same time.
3 The SMP started in 10May 2010 and ended on 6 September 2012. Here we used the SMP holdings at the
end of each month. The ECB bought the bonds of peripheral countries (Italy, Greece, Ireland, Portugal and Spain) under this programme. The CBPP1 was launched on 2 July 2009 and ended on 30 June 2010 when it reached a nominal amount of €60 billion. We used the holdings at the end of each month.
4 Monthly purchases of public and private sector securities under APPs was €60 billion where this value
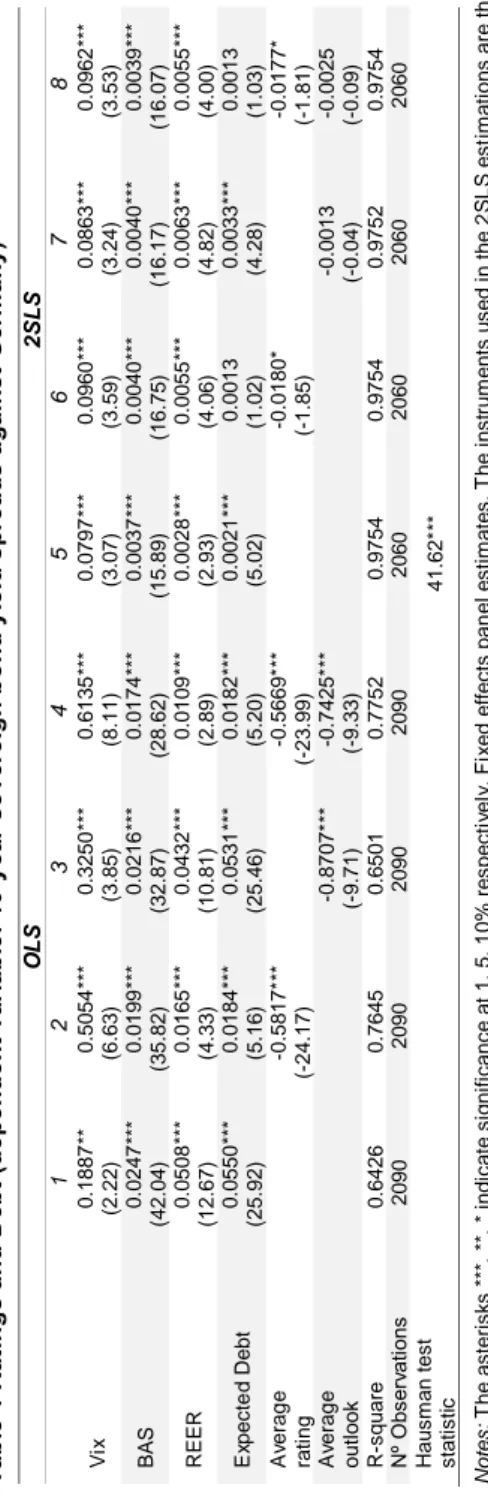
Ta bl e 1 R at in gs a nd D eb t ( de pe nd en t v ar ia bl e: 1 0-ye ar s ov er ei gn b on d yi el d sp re ad s ag ai ns t G er m an y) O LS 2 S LS 1 2 3 4 5 6 7 8 V ix 0 .1 8 8 7 ** (2 .2 2 ) 0 .5 0 5 4 ** * (6 .6 3 ) 0 .3 2 5 0 ** * (3 .8 5 ) 0 .6 1 3 5 ** * (8 .1 1 ) 0 .0 7 9 7 ** * (3 .0 7 ) 0 .0 9 6 0 ** * (3 .5 9 ) 0 .0 8 6 3 ** * (3 .2 4 ) 0 .0 9 6 2 ** * (3 .5 3 ) BAS 0 .0 2 4 7 ** * (4 2 .0 4 ) 0 .0 1 9 9 ** * (3 5 .8 2 ) 0 .0 2 1 6 ** * (3 2 .8 7 ) 0 .0 1 7 4 ** * (2 8 .6 2 ) 0 .0 0 3 7 ** * (1 5 .8 9 ) 0 .0 0 4 0 ** * (1 6 .7 5 ) 0 .0 0 4 0 ** * (1 6 .1 7 ) 0 .0 0 3 9 ** * (1 6 .0 7 ) RE E R 0 .0 5 0 8 ** * (1 2 .6 7 ) 0 .0 1 6 5 ** * (4 .3 3 ) 0 .0 4 3 2 ** * (1 0 .8 1 ) 0 .0 1 0 9 ** * (2 .8 9 ) 0 .0 0 2 8 ** * (2 .9 3 ) 0 .0 0 5 5 ** * (4 .0 6 ) 0 .0 0 6 3 ** * (4 .8 2 ) 0 .0 0 5 5 ** * (4 .0 0 ) E xp e c te d De b t 0 .0 5 5 0 ** * (2 5 .9 2 ) 0 .0 1 8 4 ** * (5 .1 6 ) 0 .0 5 3 1 ** * (2 5 .4 6 ) 0 .0 1 8 2 ** * (5 .2 0 ) 0 .0 0 2 1 ** * (5 .0 2 ) 0 .0 0 1 3 (1 .0 2 ) 0 .0 0 3 3 ** * (4 .2 8 ) 0 .0 0 1 3 (1 .0 3 ) A ve ra g e ra ti n g -0 .5 8 1 7 ** * (-2 4 .1 7 ) -0 .5 6 6 9 ** * (-2 3 .9 9 ) -0 .0 1 8 0 * (-1 .8 5 ) -0 .0 1 7 7 * (-1 .8 1 ) A ve ra g e o u tl o o k -0. 8 7 0 7 ** * (-9 .7 1 ) -0 .7 4 2 5 ** * (-9 .3 3 ) -0 .0 0 1 3 (-0 .0 4 ) -0 .0 0 2 5 (-0 .0 9 ) R -s q u a re 0 .6 4 2 6 0 .7 6 4 5 0 .6 5 0 1 0 .7 7 5 2 0 .9 7 5 4 0 .9 7 5 4 0 .9 7 5 2 0 .9 7 5 4 Nº O bs er va tio ns 2090 2090 2090 2090 2060 2060 2060 2060 Hau s m a n t e s t s ta ti s ti c 4 1 .6 2 ** * Not e s : T h e a s te ri s k s * ** , ** , * i n d ic a te s ig n ifi c a n c e a t 1 , 5 , 1 0 % r e s p e c ti ve ly . F ix e d e ff e c ts p a n e l e s ti m a te s . T h e i n s tr u m e n ts u s e d i n t h e 2 S L S e s ti m a ti o n s a re t h e s e c o n d a n d t h ir d l a g s o f th e d e p e n d e n t v a ri a b le a n d t h e f ir s t th re e l a g s o f th e i n d e p e n d e n t v a ri a b le s .
The results of the baseline model in Table 1 show that all the coefficients are statistically significant and have the expected signs. Notably, the VIX, the bid-ask spread, expected debt differential, and REER, while the average rating has a significant negative effect on 10-year bond yield spreads. Therefore, higher international risk and the appreciation of the real effective exchange rate increases the sovereign yield spreads, as expected, while better ratings and improved outlooks decrease the yield spreads.
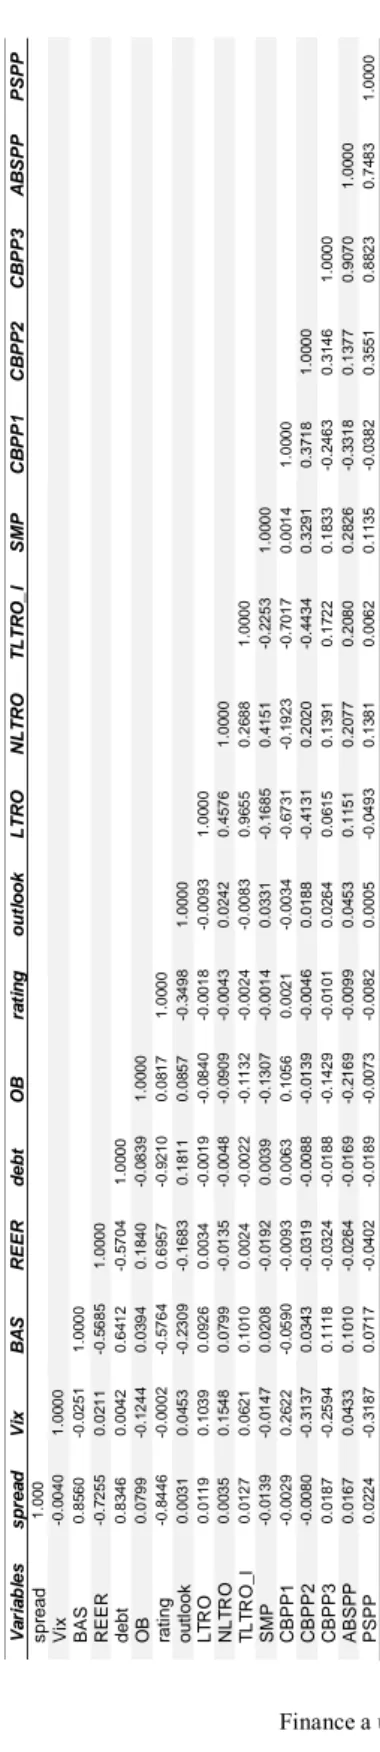
As the expected debt is inversely correlated with the average ratings (see Annex Table A3), we include the ratings and add the unconventional policy measures to the specification one at the time. We see that the LTROs have a significant negative impact on the 10-year bond yield spreads (Table 2). Moreover, Net-LTRO, which includes only the LTROs, and the SMP also have negative significant impacts on the spreads. On the other hand, we found negative but not significant results for the CBPP1 and PSPP (although the time span is shorter).
In Table 3, we report the results with the expected budget balance. The estimation provides the correct coefficient signs for each exogenous variable (except for the CBPP2 and ABSPP), although the expected balance has no significant impact on the spreads. The LTRO, Net-LTRO and the SMP still have negative significant impacts on yield spreads.
Ta bl e 2 U nc on ve nt io na l M on et ar y Po lic y an d D eb t (2 SL S) ( de pe nd en t va ria bl e: 1 0-ye ar s ov er ei gn b on d yi el d sp re ad s ag ai ns t G er m an y) 1 2 3 4 5 6 7 8 9 V ix 0 .0 9 0 6 ** * (3 .3 4 ) 0 .0 9 1 2 ** * (3 .4 5 ) 0 .3 3 5 6 ** (2 .5 3 ) 0 .1 8 5 3 * (1 .8 6 ) 0 .0 3 9 1 (0 .3 6 ) 0 .0 4 1 4 (0 .3 6 ) 0 .3 4 9 6 ** (2 .1 9 ) 0. 0384 (0 .3 1 ) 0 .0 3 7 5 (0 .2 9 ) BAS 0 .0 0 4 0 ** * (1 6 .9 2 ) 0 .0 0 4 0 ** * (1 6 .9 2 ) 0 .0 0 4 4 ** * (8 .8 9 ) 0 .0 0 4 2 ** * (9 .6 1 ) 0 .0 1 4 7 ** * (4 .7 1 ) 0 .0 0 9 5 ** * (3 .2 8 ) 0 .0 0 0 3 (0 .2 7 ) 0 .0 1 0 5 ** * (3 .4 2 ) 0 .0 1 1 2 ** * (3 .4 8 ) RE E R 0 .0 0 6 4 ** * (4 .9 3 ) 0 .0 0 6 3 ** * (4 .8 4 ) 0 .0 1 7 8 ** (2 .0 3 ) 0 .0 1 4 4 ** (1 .9 8 ) 0 .1 0 4 5 * (1 .7 7 ) 0 .0 3 3 5 (0 .8 3 ) 0 .0 0 6 2 (0 .4 7 ) 0 .0 6 6 8 (1 .3 5 ) 0 .0 8 2 1 (1 .3 4 ) E xp e c te d De b t 0 .0 0 3 2 ** * (4 .1 4 ) 0 .0 0 2 9 ** * (3 .7 5 ) 0 .0 0 0 3 (0 .1 1 ) 0 .0 0 2 0 (0 .8 1 ) 0 .0 1 9 9 ** (2 .3 6 ) -0 .0 2 0 2 ** * (-3 .4 1 ) -0 .0 1 0 2 ** (-2 .5 6 ) -0 .0 2 1 0 ** * (-3 .0 2 ) -0 .0 2 3 3 ** * (-2 .8 7 ) L T RO _ g ro wth -0 .0 0 1 6 ** (-2 .4 4 ) NLT RO _ g ro wth -0 .0 0 1 6 ** (-2 .3 6 ) S M P _ g ro wth -0 .0 0 8 0 ** (-2 .1 1 ) CB P P 1 _ g ro wth -0 .0 0 7 0 (-1 .3 8 ) P S P P _ g ro wt h -0 .0 0 7 4 (-1 .3 9 ) T L T RO _ l_ g ro wth -0 .0 0 0 7 (-0 .3 0 ) CB P P 2 _ g ro wth 0 .0 0 2 3 (0 .3 4 ) CB P P 3 _ g ro wth -0 .0 0 2 9 (-0 .7 1 ) A B S P P _ g ro wth -0 .0 0 0 8 (-0 .2 4 ) R -s q u a re 0 .9 7 5 2 0 .9 7 5 2 0 .9 6 8 1 0 .9 6 9 6 0 .8 8 5 3 0 .7 7 0 3 0 .9 5 4 3 0 .6 5 7 9 0 .4 0 7 2 Nº o bs er va tio ns 2050 2050 690 790 110 170 510 160 150 Not e s : T h e a s te ri s k s * ** , ** , * i n d ic a te s ig n ifi c a n c e a t 1 , 5 , 1 0 % r e s p e c ti ve ly . S e e T a b le 1 .
Ta bl e 3 U nc on ve nt io na l M on et ar y Po lic y an d B ud ge t B al an ce (2 SL S) (d ep en de nt v ar ia bl e: 1 0-ye ar s ov er ei gn b on d yi el d sp re ad s ag ai ns t G er m an y) 1 2 3 4 5 6 7 8 9 V ix 0 .0 6 3 4 ** (2 .4 6 ) 0 .0 6 8 8 ** * (2 .6 5 ) 0 .0 7 2 6 ** * (2 .7 9 ) 0 .3 4 0 5 ** * (2 .6 4 ) 0 .1 6 0 5 * (1 .6 9 ) 0 .1 7 6 1 (1 .6 3 ) 0 .3 5 3 9 ** (2 .2 0 ) 0 .1 8 6 1 (1 .5 8 ) 0 .1 8 3 9 (1 .5 3 ) BAS 0 .0 0 3 9 ** * (1 6 .2 7 ) 0 .0 0 4 0 ** * (1 6 .3 9 ) 0 .0 0 4 0 ** * (1 6 .4 7 ) 0 .0 0 4 4 ** * (8 .9 8 ) 0 .0 0 4 3 ** * (9 .7 5 ) 0 .0 1 4 1 ** * (5 .1 2 ) 0 .0 0 0 8 (0 .6 9 ) 0 .0 1 4 2 ** * (4 .8 9 ) 0 .0 1 4 7 ** * (4 .8 8 ) RE E R 0 .0 0 3 0 ** * (2 .8 9 ) 0 .0 0 3 2 ** * (3 .0 7 ) 0 .0 0 3 4 ** * (3 .2 4 ) 0 .0 1 6 3 ** (2 .0 8 ) 0 .0 1 0 7 (1 .5 9 ) 0 .0 1 4 9 (0 .4 0 ) 0 .0 1 2 7 (0 .9 4 ) 0 .0 2 8 4 (0 .6 3 ) 0 .0 4 4 3 (0 .8 1 ) E xp e c te d _ O B -0 .0 0 3 0 (-0 .8 0 ) -0 .0 0 2 9 (-0 .7 6 ) -0 .0 0 2 1 (-0 .5 4 ) -0 .0 1 6 6 (-0 .7 3 ) -0 .0 0 3 3 (-0 .1 8 ) 0 .2 1 9 9 ** * (6 .6 7 ) -0 .0 1 7 7 (-0 .5 9 ) 0 .2 1 2 ** * (5 .9 8 ) 0 .2 4 0 8 ** * (5 .9 5 ) L T RO _ g ro wth -0 .0 0 1 8 ** * (-2 .6 7 ) Net _ L T RO _ g ro wth -0 .0 0 2 0 ** * (-3 .0 9 ) S M P _ g ro wth -0 .0 0 8 0 ** (-2 .1 0 ) CB P P 1 _ g ro wth -0 .0 0 7 9 (-1 .5 5 ) T L T RO _ l_ g ro wth -0 .0 0 1 1 (-0 .5 3 ) CB P P 2 _ g ro wth 0 .0 1 2 1 * (1 .8 9 ) CB P P 3 _ g ro wth -0 .0 0 0 9 (-0 .2 3 ) A B S P P _ g ro wth 0 .0 0 2 1 (0 .7 2 ) R -s q u a re 0 .9 7 4 9 0 .9 7 5 0 0 .9 7 5 0 0 .9 6 7 8 0 .9 6 8 9 0 .9 4 7 7 0 .9 6 4 1 0 .9 4 2 5 0 .9 0 7 7 Nº o bs er va tio ns 2060 2050 2050 690 790 170 510 160 150 Not e s : T h e a s te ri s k s * ** , ** , * i n d ic a te s ig n ifi c a n c e a t 1 , 5 , 1 0 % r e s p e c ti ve ly . S e e T a b le 1 .
3.2 Robustness Checks
In order to check the robustness of the baseline we estimated two separated models. Therefore, we used the US corporate to government bond spread (US_spread) as an alternative for the VIX and in another regression we included CDS spread. We found that the estimated coefficients in both cases are highly significant (see Annex Table A5).
In addition, we also estimated themodel using the announcement dates of the unconventional ECB monetary policy measures. In practice, we introduced dummy variables for all the measures, where these dummy variables take the value of 0 from the beginning of the sample period until the programme is being announced and takes the value of 1 on the announcement date and after its’ announcement date until the end of the sample period. Moreover, we also added another variable called “dannounce” that considers all the announcement dates of the various unconventional policy measures (this dummy variable takes the value of 1 just for the announcement dates of each instrument and the value of 0 for the other dates).
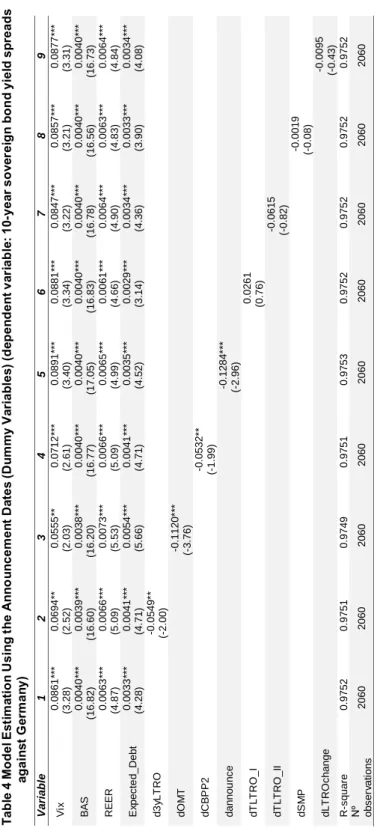
As we can see in Table 4 the announcement of the three-year LTRO (3yLTRO), OMT (Outright Monetary Transactions (as this programme was never implemented we just studied its’ announcement effect)) and the CBPP2 negatively affected the yield spreads. The dummy variable “dannounce” is also statistically significant with a negative sign, showing that the overall announcements of the unconventional policies reduced the EMU’s sovereign bond yield spreads.
We also investigated if there was a structural break when the ECB introduced a fixed interest rate with full allotment (FRFA) policy on all the Longer term Refinancing Operations to accommodate the unpredictable increase in the bank’s demand for liquidity on October 2008 (Boeckx et al., 2017), by adding the dummy “dLTROchange”. According to the results (see Table 4), we did not find a structural break.
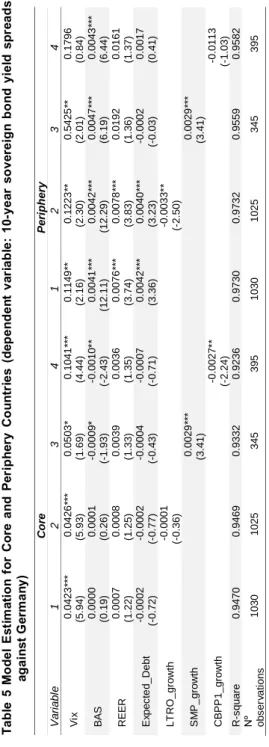
Next, we have divided the sample in two sub-samples: core countries (Austria, Belgium, France, Finland and the Netherlands); and periphery countries (Italy, Ireland, Greece, Portugal and Spain) countries to assess the unconventional measures’ effects for these two different country groups. We performed this exercise once using the growth rate of each purchase and once using the dummies on the announcement dates. The results are reported in Table 5 and 6.
Ta bl e 4 M od el E st im at io n U si ng th e A nn ou nc em en t D at es (D um m y Va ria bl es ) ( de pe nd en t v ar ia bl e: 1 0-ye ar s ov er ei gn b on d yi el d sp re ad s ag ai ns t G er m an y) V a ri a bl e 1 2 3 4 5 6 7 8 9 V ix 0 .0 8 6 1 ** * (3 .2 8 ) 0 .0 6 9 4 ** (2 .5 2 ) 0 .0 5 5 5 ** (2 .0 3 ) 0 .0 7 1 2 ** * (2 .6 1 ) 0 .0 8 9 1 ** * (3 .4 0 ) 0 .0 8 8 1 ** * (3 .3 4 ) 0 .0 8 4 7 ** * (3 .2 2 ) 0 .0 8 5 7 ** * (3 .2 1 ) 0 .0 8 7 7 ** * (3 .3 1 ) BAS 0 .0 0 4 0 ** * (1 6 .8 2 ) 0 .0 0 3 9 ** * (1 6 .6 0 ) 0 .0 0 3 8 ** * (1 6 .2 0 ) 0 .0 0 4 0 ** * (1 6 .7 7 ) 0 .0 0 4 0 ** * (1 7 .0 5 ) 0 .0 0 4 0 ** * (1 6 .8 3 ) 0 .0 0 4 0 ** * (1 6 .7 8 ) 0 .0 0 4 0 ** * (1 6 .5 6 ) 0 .0 0 4 0 ** * (1 6 .7 3 ) RE E R 0 .0 0 6 3 ** * (4 .8 7 ) 0 .0 0 6 6 ** * (5 .0 9 ) 0 .0 0 7 3 ** * (5 .5 3 ) 0 .0 0 6 6 ** * (5 .0 9 ) 0 .0 0 6 5 ** * (4 .9 9 ) 0 .0 0 6 1 ** * (4 .6 6 ) 0 .0 0 6 4 ** * (4 .9 0 ) 0 .0 0 6 3 ** * (4 .8 3 ) 0 .0 0 6 4 ** * (4 .8 4 ) E xp e c te d _ Deb t 0 .0 0 3 3 ** * (4 .2 8 ) 0 .0 0 4 1 ** * (4 .7 1 ) 0. 0 0 5 4 ** * (5 .6 6 ) 0 .0 0 4 1 ** * (4 .7 1 ) 0 .0 0 3 5 ** * (4 .5 2 ) 0 .0 0 2 9 ** * (3 .1 4 ) 0 .0 0 3 4 ** * (4 .3 6 ) 0 .0 0 3 3 ** * (3 .9 0 ) 0 .0 0 3 4 ** * (4 .0 8 ) d 3 yL T RO -0 .0 5 4 9 ** (-2 .0 0 ) d O M T -0 .1 1 2 0 ** * (-3 .7 6 ) d CB P P 2 -0 .0 5 3 2 ** (-1 .9 9 ) d a n n o u n c e -0 .1 2 8 4 ** * (-2 .9 6 ) d T L T RO _ I 0 .0 2 6 1 (0 .7 6 ) d T L T RO _ II -0 .0 6 1 5 (-0 .8 2 ) d S M P -0 .0 0 1 9 (-0 .0 8 ) d L T RO c h a n g e -0 .0 0 9 5 (-0 .4 3 ) R -s q u a re 0 .9 7 5 2 0 .9 7 5 1 0 .9 7 4 9 0 .9 7 5 1 0 .9 7 5 3 0 .9 7 5 2 0 .9 7 5 2 0 .9 7 5 2 0 .9 7 5 2 Nº ob s e rv a ti o n s 2060 2060 2060 2060 2060 2060 2 060 2060 2060 Not e s : T h e a s te ri s k s * ** , ** , * i n d ic a te s ig n ifi c a n c e a t 1 , 5 , 1 0 % r e s p e c ti ve ly . S e e T a b le 1 .
Ta bl e 5 M od el E st im at io n fo r C or e an d Pe ri ph er y C ou nt rie s (d ep en de nt v ar ia bl e: 1 0-ye ar s ov er ei gn b on d yi el d sp re ad s ag ai ns t G er m an y) C ore P e ri ph e ry V a ri a b le 1 2 3 4 1 2 3 4 V ix 0 .0 4 2 3 ** * (5 .9 4 ) 0 .0 4 2 6 ** * (5 .9 3 ) 0 .0 5 0 3 * (1 .6 9 ) 0 .1 0 4 1 ** * (4 .4 4 ) 0 .1 1 4 9 ** (2 .1 6 ) 0 .1 2 2 3 ** (2 .3 0 ) 0 .5 4 2 5 ** (2 .0 1 ) 0 .1 7 9 6 (0 .8 4 ) BAS 0 .0 0 0 0 (0 .1 9 ) 0 .0 0 0 1 (0 .2 6 ) -0 .0 0 0 9 * (-1 .9 3 ) -0 .0 0 1 0 ** (-2 .4 3 ) 0 .0 0 4 1 ** * (1 2 .1 1 ) 0 .0 0 4 2 ** * (1 2 .2 9 ) 0 .0 0 4 7 ** * (6 .1 9 ) 0 .0 0 4 3 ** * (6 .4 4 ) RE E R 0 .0 0 0 7 (1 .2 2 ) 0 .0 0 0 8 (1 .2 5 ) 0 .0 0 3 9 (1 .3 3 ) 0 .0 0 3 6 (1 .3 5 ) 0 .0 0 7 6 ** * (3 .7 4 ) 0 .0 0 7 8 ** * (3 .8 3 ) 0 .0 1 9 2 (1 .3 6 ) 0 .0 1 6 1 (1 .3 7 ) E xp e c te d _ Deb t -0 .0 0 0 2 (-0 .7 2 ) -0 .0 0 0 2 (-0 .7 7 ) -0 .0 0 0 4 (-0 .4 3 ) -0 .0 0 0 7 (-0 .7 1 ) 0 .0 0 4 2 ** * (3 .3 6 ) 0 .0 0 4 0 ** * (3 .2 3 ) -0 .0 0 0 2 (-0 .0 3 ) 0 .0 0 1 7 (0 .4 1 ) L T RO _ g ro wth -0 .0 0 0 1 (-0 .3 6 ) -0 .0 0 3 3 ** (-2 .5 0 ) S M P _ g ro wth 0 .0 0 2 9 ** * (3 .4 1 ) 0 .0 0 2 9 ** * (3 .4 1 ) CB P P 1 _ g ro wth -0 .0 0 2 7 ** (-2 .2 4 ) -0 .0 1 1 3 (-1 .0 3 ) R -s q u a re 0 .9 4 7 0 0 .9 4 6 9 0 .9 3 3 2 0 .9 236 0 .9 7 3 0 0 .9 7 3 2 0 .9 5 5 9 0 .9 5 8 2 Nº ob s e rv a ti o n s 1030 1025 345 395 1030 1025 345 395 Not e s : T h e a s te ri s k s * ** , ** , * i n d ic a te s ig n ifi c a n c e a t 1 , 5 , 1 0 % r e s p e c ti ve ly . S e e T a b le 1 .
Table 6 Model Estimation for Core and Periphery Countries Using the Announcement Dates (Dummy Variables) (dependent variable: 10-year sovereign bond yield spreads against Germany)
Core Periphery Variable 1 2 3 1 2 3 Vix (5.94) 0.0423*** (6.11) 0.0478*** (5.89) 0.0414*** (3.28) 0.0861*** (1.41) 0.0763 (2.28) 0.1209** BAS (0.19) 0.0000 (-0.46) -0.0001 (0.05) 0.0000 (16.82) 0.0040*** (9.37) 0.0035*** (12.31) 0.0042*** REER (1.22) 0.0007 (1.25) 0.0008 (1.02) 0.0006 (4.87) 0.0063*** (4.84) 0.0109*** (3.91) 0.0080*** Expected_Debt (-0.72) -0.0002 (-1.55) -0.0006 (-0.46) -0.0001 (4.28) 0.0033*** (4.69) 0.0097*** (3.63) 0.0046*** dOMT (1.69) 0.0137* (-3.39) -0.2878*** dannounce (-5.65) -0.0652*** (-2.24) -0.1952** R-square 0.9470 0.9457 0.9490 0.9752 0.9719 0.9732 Nº observations 1030 1030 1030 1030 1030 1030
Notes: The asterisks ***, **, * indicate significance at 1, 5, 10% respectively. See Table 1.
The results for the country split show that the coefficients of the regression for the core countries don’t seem to be too significant, apart from the VIX factor and the CBPP1 variable. On the other hand, there is more statistical significance in the case of the periphery countries, where again LTROs have a significant negative impact on yield spreads while the bid-ask spread and the expected debt differential vis-à-vis Germany are both pushing the yield spreads upwards. After including the announcement dates to the baseline and implementing the regressions once again we found that the announcement of the OMT as well as the overall announcements of the unconventional policies had significantly decreased the yield spreads, with a more important magnitude in the case of the periphery countries (see Table 6).
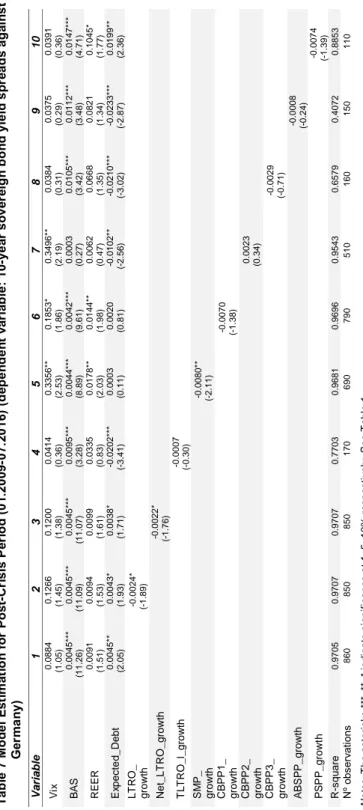
Finally, we analysed the period after the financial crisis, the period 01.2009 to 07.2016. We report in Table 7 the results, which show that in the post crisis period variables such as the VIX and the REER have a much more mitigated impact on the yield spreads. However, we again find that the LTRO, the Net LTRO and the SMP have a significant negative effect on the yield spreads.
Ta bl e 7 M od el E st im at io n fo r Po st -C ris is P er io d (0 1. 20 09 -0 7. 20 16 ) ( de pe nd en t v ar ia bl e: 1 0-ye ar s ov er ei gn b on d yi el d sp re ad s ag ai ns t G er m an y) V a ri a bl e 1 2 3 4 5 6 7 8 9 10 V ix 0.0884 (1.0 5 ) 0.1266 (1.4 5 ) 0.1200 (1.3 8 ) 0.0414 (0.3 6 ) 0.3 35 6* * (2 .5 3 ) 0.1853* (1.8 6 ) 0.3 49 6* * (2 .1 9 ) 0.0384 (0.3 1 ) 0.0375 (0.2 9 ) 0.0391 (0.3 6 ) BAS 0 .0 0 4 5 ** * (1 1 .2 6 ) 0 .0 0 4 5 ** * (1 1 .0 9 ) 0 .0 0 4 5 ** * (1 1 .0 7 ) 0 .0 0 9 5 ** * (3 .2 8 ) 0 .0 0 4 4 ** * (8 .8 9 ) 0 .0 0 4 2 ** * (9 .6 1 ) 0 .0 0 0 3 (0 .2 7 ) 0 .0 1 0 5 ** * (3 .4 2 ) 0 .0 1 1 2 ** * (3 .4 8 ) 0 .0 1 4 7 ** * (4 .7 1 ) RE E R 0 .0 0 9 1 (1 .5 1 ) 0 .0 0 9 4 (1 .5 3 ) 0 .0 0 9 9 (1 .6 1 ) 0 .0 3 3 5 (0 .8 3 ) 0 .0 1 7 8 ** (2 .0 3 ) 0 .0 1 4 4 ** (1 .9 8) 0 .0 0 6 2 (0 .4 7 ) 0 .0 6 6 8 (1 .3 5 ) 0 .0 8 2 1 (1 .3 4 ) 0 .1 0 4 5 * (1 .7 7 ) E xp e c te d _ De b t 0 .0 0 4 5 ** (2.0 5) 0 .0 0 4 3 * (1.9 3) 0 .0 0 3 8 * (1.7 1) -0 .0 2 0 2 ** * (-3.41) 0 .0 0 0 3 (0.1 1) 0 .0 0 2 0 (0.8 1) -0 .0 1 0 2 ** (-2.56) -0 .0 2 1 0 ** * (-3.02) -0 .0 2 3 3 ** * (-2.87) 0 .0 1 9 9 ** (2.3 6) L T RO _ g ro wth -0 .0 0 2 4 * (-1 .8 9 ) Net _ L T RO _ g ro wth -0 .0 0 2 2 * (-1 .7 6 ) T L T RO _ l_ g ro wth -0 .0 0 0 7 (-0 .3 0 ) S M P _ g ro wth -0 .0 0 8 0 ** (-2 .1 1 ) CB P P 1 _ g ro wth -0 .0 0 7 0 (-1 .3 8 ) CB P P 2 _ g ro wth 0 .0 0 2 3 (0 .3 4 ) CB P P 3 _ g ro wth -0.0029 (-0.7 1 ) A B S P P _ g ro wth -0 .0 0 0 8 (-0 .2 4 ) P S P P _ g ro wt h -0 .0 0 7 4 (-1 .3 9 ) R -s q u a re 0 .9 7 0 5 0 .9 7 0 7 0 .9 7 0 7 0 .7 7 0 3 0 .9 6 8 1 0 .9 6 9 6 0 .9 5 4 3 0 .6 5 7 9 0 .4 0 7 2 0 .8 8 5 3 Nº o bs er va tio ns 860 850 850 170 690 790 510 160 150 110 Not e s : T h e a s te ri s k s * ** , ** , * in d ic a te s ig n ifi c a n c e a t 1 , 5 , 1 0 % r e s p e c ti ve ly . S e e T a b le 1 .
4. Conclusions
In this paper we have assessed the relevance of sovereign credit ratings and of the ECB’s unconventional policy measures for yield spreads using a panel of 10-euro area countries over the period 1999.01–2016.07.
The findings of our regression analysis show that the VIX, bid-ask spread and the real effective exchange rate increase 10-year sovereign bond yield spreads. We also found a significant positive impact of expected debt-to-GDP ratio against Germany on the sovereign yield spreads. We also concluded that the improvements of the sovereign ratings and of the outlooks from the three main rating agencies, S&P, Moody’s and Fitch, have reduced the sovereign bond yield spreads.
Moreover, our results suggest that the ECB’s policy measures such as Longer-term Refinancing Operations, the Securities Market Program and the announcement of the overall unconventional monetary policies have negatively affected 10-year sovereign yield spreads in the euro area. Hence, the power of the so-called non-conventional monetary policy in the euro area receives support in this regard, notably in the case of the periphery country group.
We also uncovered stronger statistical significance in the case of the periphery countries that LTROs have a negative impact on yield spreads while the bid-ask spread and the expected debt differential vis-à-vis Germany are both pushing the yield spreads upwards.
Therefore, and regarding policy implications, one can conclude that the ECB unconventional measures helped in containing the sovereign yield spreads in the euro area, after the 2008-2009 economic and financial crisis and after the 2010-2011 sovereign debt crisis. Still, if one considers that such measures might be slowly discontinued by the ECB, the macroeconomic and fiscal fundamentals would then play again a predominant role as yield spread determinants.
APPENDIX Table A1 Data Set
Variable Description Source
Bond_Spread_
DEU_10y 10-year bond yield spread against German
ECB/Own calculations
Vix Chicago Board of Exchange Volatility Index Bloomberg
BAS 10-year bond yield bid_ask Spread Bloomberg and
ECB
REER Real Effective Exchange Rate, CPI based IFS
Expected_Debt Expected government debt against Germany, % of GDP EC Expected_OB Expected government budget balance against Germany, % of
GDP EC
Rating_SP Credit rating S&P Standard and
Poors
Rating_M Credit rating Moody’s Moody’s
Rating_F Credit rating Fitch Fitch Ratings
Outlook_SP Credit Outlook S&P Standard and
Poors
Outlook_M Credit Outlook Moody’s Moody’s
Outlook_F Credit Outlook Fitch Fitch Ratings
LTRO Longer-term Refinancing Operation (includes TLTRO_l and
TLTRO_ll), Holdings, Euro billions ECB
Net_LTRO Longer-term Refinancing Operation, Holdings, Euro billions ECB and own calculations TLTRO_l First Targeted Longer-term Refinancing Operation, Holdings,
Euro billions
ECB and own calculations TLTRO_ll Second Targeted Longer-term Refinancing Operation, Holdings,
Euro billions ECB
SMP Securities Market Programme, Holdings, Euro billions ECB
CBPP1 Covered Bond Purchase Programme 1, Holdings, Euro billions ECB CBPP2 Covered Bond Purchase Programme 2, Holdings, Euro billions ECB CBPP3 Covered Bond Purchase Programme 3, Holdings, Euro billions ECB ABSPP Asset Backed Securities Purchase Programme, Holdings, Euro
billion ECB
PSPP Public Sector Purchase Programme, Holdings, Euro billions ECB Table A2 Monetary Policy Instruments and Programmes (Euro Area)
Instruments Monetary policy measures Conventional instrument?
Announcement and implementation
Open market operations
Main refinancing operations Yes -
Longer-term refinancing operations
(LTRO) Yes
- Targeted longer-term refinancing
operations I (TLTRO I) No
5 June 2014 June 2014 – May 2016 Targeted longer-term refinancing
operations II (TLTRO II) No
10 March 2016 Since June 2016
Asset purchase programmes
Covered bond purchase programme
(CBPP1) No
7 May 2009 July 2009 – June 2010 Securities Markets Programme
(SMP) No
10 May 2010 May 2010 - September
2012 Covered bond purchase programme
(CBPP2) No
6 October 2011 Nov.2011 – Oct. 2012 Outright Monetary Transactions
(OMT) No
2 August 2012 - Covered bond purchase programme
(CBPP3) No
4 September 2014 Since October 2014 Asset-backed securities purchase
programme (ABSPP) No
4 September 2014 Since November 2014 Public sector purchase programme
(PSPP) No
22 January 2015 Since March 2015 Corporate sector purchase
programme (CSPP) No
10 March 2016 Since June 2016 Source: ECB.
Ta bl e A3 C or re la tio ns V a ria b le s s p re a d V ix BA S RE E R d e b t OB ra ti n g o u tl o o k L T RO NL T RO T L T RO _ l S M P CB P P 1 CB P P 2 CB P P 3 A BS P P PSPP s p re a d 1 .0 0 0 V ix -0 .0 0 4 0 1 .0 0 0 0 BAS 0 .8 5 6 0 -0 .0 2 5 1 1 .0 0 0 0 RE E R -0 .7 2 5 5 0 .0 2 1 1 -0 .5 6 8 5 1 .0 0 0 0 debt 0 .8 3 4 6 0 .0 0 4 2 0 .6 4 1 2 -0 .5 7 0 4 1 .0 0 0 0 OB 0 .0 7 9 9 -0 .1 2 4 4 0 .0 3 9 4 0 .1 8 4 0 -0 .0 8 3 9 1 .0 0 0 0 ra ti n g -0 .8 4 4 6 -0 .0 0 0 2 -0 .5 7 6 4 0 .6 9 5 7 -0 .9 2 1 0 0 .0 8 1 7 1 .0 0 0 0 o u tl o o k 0 .0 0 3 1 0 .0 4 5 3 -0 .2 3 0 9 -0 .1 6 8 3 0 .1 8 1 1 0 .0 8 5 7 -0 .3 4 9 8 1 .0 0 0 0 L T R O 0 .0 1 1 9 0 .1 0 3 9 0 .0 9 2 6 0 .0 0 3 4 -0 .0 0 1 9 -0 .0 8 4 0 -0 .0 0 1 8 -0 .0 0 9 3 1 .0 0 0 0 NLT R O 0 .0 0 3 5 0 .1 5 4 8 0 .0 7 9 9 -0 .0 1 3 5 -0 .0 0 4 8 -0 .0 9 0 9 -0 .0 0 4 3 0 .0 2 4 2 0 .4 5 7 6 1 .0 0 0 0 T L T R O _ l 0 .0 1 2 7 0 .0 6 2 1 0 .1 0 1 0 0 .0 0 2 4 -0 .0 0 2 2 -0 .1 1 3 2 -0 .0 0 2 4 -0 .0 0 8 3 0 .9 6 5 5 0 .2 6 8 8 1 .0 0 0 0 S M P -0 .0 1 3 9 -0 .0 1 4 7 0 .0 2 0 8 -0 .0 1 9 2 0 .0 0 3 9 -0 .1 3 0 7 -0 .0 0 1 4 0 .0 3 3 1 -0 .1 6 8 5 0 .4 1 5 1 -0 .2 2 5 3 1 .0 0 0 0 CB P P 1 -0 .0 0 2 9 0 .2 6 2 2 -0 .0 5 9 0 -0 .0 0 9 3 0 .0 0 6 3 0 .1 0 5 6 0 .0 0 2 1 -0 .0 0 3 4 -0 .6 7 3 1 -0 .1 9 2 3 -0 .7 0 1 7 0 .0 0 1 4 1 .0 0 0 0 CB P P 2 -0 .0 0 8 0 -0 .3 1 3 7 0 .0 3 4 3 -0 .0 3 1 9 -0 .0 0 8 8 -0 .0 1 3 9 -0 .0 0 4 6 0 .0 1 8 8 -0 .4 1 3 1 0 .2 0 2 0 -0 .4 4 3 4 0 .3 2 9 1 0 .3 7 1 8 1 .0 0 0 0 CB P P 3 0 .0 1 8 7 -0 .2 5 9 4 0 .1 1 1 8 -0 .0 3 2 4 -0 .0 1 8 8 -0 .1 4 2 9 -0 .0 1 0 1 0 .0 2 6 4 0 .0 6 1 5 0 .1 3 9 1 0 .1 7 2 2 0 .1 8 3 3 -0 .2 4 6 3 0 .3 1 4 6 1 .0 0 0 0 A B S P P 0 .0 1 6 7 0 .0 4 3 3 0 .1 0 1 0 -0 .0 2 6 4 -0 .0 1 6 9 -0 .2 1 6 9 -0 .0 0 9 9 0 .0 4 5 3 0 .1 1 5 1 0 .2 0 7 7 0 .2 0 8 0 0 .2 8 2 6 -0 .3 3 1 8 0 .1 3 7 7 0 .9 0 7 0 1 .0 0 0 0 PSPP 0 .0 2 2 4 -0 .3 1 8 7 0 .0 7 1 7 -0 .0 4 0 2 -0 .0 1 8 9 -0 .0 0 7 3 -0 .0 0 8 2 0 .0 0 0 5 -0 .0 4 9 3 0 .1 3 8 1 0 .0 0 6 2 0 .1 1 35 -0 .0 3 8 2 0 .3 5 5 1 0 .8 8 2 3 0 .7 4 8 3 1 .0 0 0 0
Table A4 Stationarity Test Results (Im-Pesaran-Shin)
Table A5 Model Estimation Using the Sovereign CDS Spreads and the US Corporate to Government Spread 1 2 Vix 0.0951*** (3.62) BAS 0.0046*** (17.78) 0.0040*** (17.05) REER 0.0071*** (5.46) 0.0058*** (4.51) Expected_Debt 0.0031*** (4.06) 0.0028*** (3.73) Sov_CDS_DEU 0.00004*** (4.76) US_spread 0.0234** (2.03) R_square 0.9752 0.9751 Nº observations 2060 2060
Notes: The asterisks ***, **, * indicate significance at 1, 5, 10% respectively.
Variable spread Vix BAS REER debt OB rating outlook
Statistic -2.2415 -3.2070 -3.0624 -0.4954 -13.3690 -17.7223 -10.2774 -2.6807
p-value 0.0125 0.0007 0.0011 0.3101 0.0000 0.0000 0.0000 0.0037
order I(0) I(0) I(0) I(0) I(1) I(1) I(1) I(0)
Variable LTRO NLTRO TLTRO_l SMP CBPP1 CBPP2 CBPP3 ABSPP PSPP
Statistic -11.5553 -7.6409 -1.7977 -4.6967 -15.5931 -5.6674 -10.3035 -2.8719 -2.7355
p-value 0.0000 0.0000 0.0361 0.0000 0.0000 0.0000 0.0000 0.0020 0.0031
REFERENCES
Afonso A, Furceri D, Gomes P (2012): Sovereign Credit Ratings and Financial Markets Linkages: Application to European Data. Journal of International Money and Finance, 31(3):606-638. Afonso A, Arghyrou M, Kontonikas A (2014): Pricing Sovereign Bond Risk in the EMU Area: An Empirical Investigation. International Journal of Finance and Economics, 19(1):49–56.
Afonso A, Jalles J (2016): Economic Volatility and Sovereign Yields' Determinants: A Time-Varying Approach. ISEG Economics Department, WP 04/2016/DE/UECE.
Altavilla C, Carboni GG, Motto R (2015): Asset Purchase Programmes and Financial Markets: Lessons from the Euro Area. ECB Working Paper, No 1864.
Andrade P, Breckenfelder J, de Fiore F, Karadi P, Tristani O (2016): The ECB’s Asset Purchase Programme: An Early Assessment. ECB Discussion Paper, No 1956.
Arghyrou MG, Kontonikas A (2012): The EMU Sovereign-Debt Crisis: Fundamentals, Expectations and Contagion. Journal of International Financial Markets, Institutions and Money, 22(4):658-677. Aßmann C, Boysen-Hogrefe J (2012): Determinants of Government Bond Spreads in the Euro Area: in Good Times as in Bad. Empirica, 39 (3):341-356.
Beber A, Brandt M, Kavajecz K (2008): Flight-to-Quality or Flight-to-Liquidity? Evidence from the Euro-Area Bond Market. Review of Financial Studies, 22(3):925-957.
Bernoth K, Erdogan B (2012): Sovereign Bond Yield Spreads: A Time-Varying Coefficient Approach. Journal of International Money and Finance, 31(3):639-656.
Boeckx J, Dossche M, Peersman G (2017): Effectiveness and Transmission of the ECBs Balance
Sheet Policies. International Journal of Central Banking, 13(1)297-333.
Borio C, Disyatat P (2010): Unconventional Monetary Policies: An Appraisal. The Manchester School, 78(s1):53-89.
Codogno L, Favero C, Missale A (2003): Yield Spreads on EMU Government bonds. Economic Policy, 18(37):503-532.
Costantini M, Fragetta M, Melina G (2014): Determinants of Sovereign Bond Yield Spreads in the EMU: An Optimal Currency Area Perspective. European Economic Review, 70:337-349.
D’Agostino A, Ehrmann M (2014): The Pricing of G7 Sovereign Bond spreads–The Times, They Are A-Changin. Journal of Banking & Finance, 47:155-176.
De Santis R (2016): Impact of the Asset Purchase Programme on Euro Area Government Bond Yields Using Market News. ECB Working Paper, No.1939.
Di Cesare A, Grande G, Manna M, Taboga M (2012): Recent Estimates of Sovereign Risk Premia for Euro-Area Countries. Questioni di Economia e Finanza (Occasional Papers). Bank of Italy. Favero C, Pagano M, Von Thadden EL (2010): How Does Liquidity Affect Government Bond Yields?
Journal of Financial and Quantitative Analysis, 45:107-134.
Gerlach S, Schulz A, Wolff G (2010): Banking and Sovereign Risk in the Euro Area. CEPR
Discussion Paper, No 7833.
Geyer A, Kossmeier S, Pichler S (2004): Measuring Systematic Risk in EMU Government Yield Spreads. Review of Finance, 8(2):171-197.
Ghysels E, Idier J, Manganelli S, Vergote O (2017): A High-Frequency Assessment of the ECB Securities Markets Programme. Journal of the European Economic Association, 15(1):218–243. Gibson H, Hall S, Tavlas G (2016): The Effectiveness of the ECB's Asset Purchase Programs of 2009 to 2012. Journal of Macroeconomics, 47:45-57.
Gomez-Puig M (2006): Size Matters for Liquidity: Evidence from EMU Sovereign Yield Spreads. Economics Letters, 90(2):156-162.
Joyce M, Miles D, Scott A, Vayanos D (2012): Quantitative Easing and Unconventional Monetary Policy – An Introduction. Economic Journal, 122:(564).
Klose J, Weigert B (2014): Sovereign Yield Spreads During the Euro Crisis: Fundamental Factors Versus Redenomination Risk, International Finance, 17(1):25-50.
Krishnamurthy A, Vissing-Jorgensen A (2011): The Effects of Quantitative Easing on Interest Rates: Channels and Implications for Policy. Brookings Papers on Economic Activity, 2:215.287.
Oliveira L, Curto JD, Nunes JP. (2012): The Determinants of Sovereign Credit Spread Changes in the Euro-Zone. Journal of International Financial Markets, Institutions & Money, 22:278-304. Pattipeilohy C, Van Den End J, Tabbae M, Frost J, De Haan J (2013): Unconventional Monetary Policy of the ECB During the Financial Crisis: An Assessment and New Evidence. DNB Working
Paper, No. 381.
Pozzi L, Wolswijk G (2008): Have Euro Area Government Bond Risk Premia Converged to Their Common State? Discussion Papers, No. 08-042/2, Tinbergen Institute.