i Janeiro 2018
Frederico Cabral da Camara Oliveira Soares
Energy dissipation devices for structures
under blast
Dissertação para obtenção do Grau de Mestre em Engenharia Civil – Perfil Estruturas
Orientador: Professor Doutor Válter da Guia Lúcio,
Professor Associado, FCT/UNL
Co-orientador: Major Gabriel de Jesus Gomes, Exército Português
Juri:
Presidente: Prof. Doutor Corneliu Cismasiu
Energy dissipation devices for structures under blast
Copyright © Frederico Cabral da Camara Oliveira Soares, Faculdade de Ciências e Tecnologia, Universidade Nova de Lisboa.
i
ACKNOWLEDGMENTS
First and foremost, I would like to thank my scientific advisor Professor Válter Lúcio for the opportunity, trust, motivation and continuous support. I am very thankful for the knowledge I gained through this experience and for Prof. Válter Lúcio’s availability throughout the entire process.
A special thanks to my scientific co-advisor, Engr. Major Gabriel Gomes for the assistance and knowledge provided.
I would also like to thank Prof. Rodrigo Gonçalves for all the help given with the computer program ADINA. Without this support it would not have been possible to complete this thesis.
Thank you to Captain José Pedro Basto, Captain João Marques, and to the Laboratory Technician José Gaspar for the support offered in Sta. Margarida’s Military Camp. Thank you for making the tests possible. I would also like to acknowledge the company Concremat Lda for the manufacture of the test specimens, the company Orica Mining Services S.A. for providing the explosives, and the Portuguese Army, especially the Counter-IED and NBQR Centre of Excellence of the Engineering regiment nº 1 and to the Mechanised Brigade.
Thanks to Eng. Vitor Silva, for all the help in the laboratorial experiments done in the DEC.
To my rugby team, CDUL, thank you for understanding my absence from practice and social events during my thesis development.
ii
iii
ABSTRACT
Terrorism pose a serious threat nowadays and many countries have the concern of protecting his people and most important buildings. This concern is an opportunity to strengthen the research of the behaviour of buildings under blast in order to reduce the magnitude of the effects of these catastrophic events.
The present thesis aims to create a functional system to improve the security of critical buildings, either new or adapting old buildings to receive this new system. This system also tries to be cost efficient, so this can be used in most buildings.
This thesis was centred in one system with two variations. The systems had the same lower reinforced concrete slab with 2,60 x 2,00 m and 0,12 m of thickness. The first system consisted in using 32 steel tubes of 76,1 mm outer diameter arranged uniformly and eight concrete panels, each one with 1,00 x 0,65 m and 0,07 m of thickness, on top of these tubes. The second system was the same concrete panels on top of 32 steel tubes with 48,3 mm outer diameter.
To test these systems four blast trials were prepared: the first is the reference specimen and the other two using the two mentioned variations of the system. These slabs were tested simply supported in two parallel edges, with a span of 2,30 m. In all tests 6,00 Kg of the explosive Eurodyn 2000 were used at a distance of 1,85 m from the top of the slab to the centre of the explosive. The results show an improvement in the residual deformation and on the opening of the visible cracks of the base reinforced concrete slab.
v
RESUMO
No mundo de hoje o terrorismo constitui uma séria ameaça e muitos países apresentam a preocupação de proteger as pessoas e os seus edifícios mais importantes. Esta preocupação é uma oportunidade para se reforçar o estudo da protecção dos edifícios contra explosões, de maneira a diminuir a magnitude dos efeitos destes eventos catastróficos.
A presente dissertação tem a intenção de criar um sistema funcional para melhorar a segurança dos edifícios estratégicos, sendo estes novos ou adaptados de edifícios antigos. Este sistema também tenta ser económico para que o sistema seja utilizado no maior número de edifícios.
Esta dissertação centrou-se num sistema com duas variações, ambas com a mesma laje inferior, em betão armado, com 2,60 x 2,00 m e 0,12 m de espessura. O primeiro sistema consistia em usar 32 tubos de aço com 76,1 mm de diâmetro exterior, dispostos uniformemente e oito placas, cada uma com 1,00 x 0,60 m e 0,07 m de espessura, posicionada sobre estes tubos. O segundo sistema tinha as mesmas oito placas sobre 32 tubos de aço com 48,3 mm de diâmetro exterior. Para testar este sistema foram preparados quatro ensaios, sendo o primeiro com uma laje de referência e os outros dois usando as duas variações do sistema já mencionado. Estas lajes estavam simplesmente apoiadas em duas vigas paralelas, formando um vão de 2,30 m. Em todos os testes foram usados 6,00 Kg de explosivo Eurodyn 2000 a uma distância de 1,85 m entre o topo das lajes e o centro do explosivo. Os resultados mostraram um melhoramento na deformação residual e na abertura das fendas visíveis em relação à laje de referência.
vii
CONTENTS
Acknowledgments ... i
Abstract ... iii
Resumo ... v
Contents ... vii
List of Illustrations ... ix
List of Tables ... xi
List of Abbreviations and Acronyms ... xiii
1. Introduction ... 1
Blast threat ... 1
Objectives... 1
Organisation ... 2
2. State of Art ... 3
Introduction ... 3
Research Works ... 3
3. Energy Dissipation Devices ... 21
Introduction ... 21
Principle of conservation of energy ... 21
Steel characterization ... 24
Experimental tests of the tubes under compression ... 26
Numerical model ... 27
Analytical model ... 29
Analysis of the results ... 33
4. Test of Large Scale Models ... 35
Introduction ... 35
Experimental Models ... 36
Testing System ... 40
Test results ... 43
Concrete characterization ... 48
5. Analysis of the Results ... 51
Blast action ... 51
viii
5.2.1. Dynamic materials behaviour ... 53
5.2.2. Plates and tubes on a rigid support ... 56
5.2.3. Reference slab with the designed reinforcement ... 58
5.2.4. Slab behaviour with the mass of the plates ... 60
5.2.5. Slab with the designed reinforcement protected by dissipation system 60 Real behaviour of the models ... 61
5.3.1. Model FS1 – Reference model ... 62
5.3.2. Dynamic behaviour of the used steel tubes ... 62
5.3.3. Models FS2 and FS3 ... 65
Results interpretation ... 65
6. Conclusions and Future Developments ... 69
Conclusions ... 69
Future developments ... 70
Bibliography ... 71
Annex A – Designed large scale models ... 73
ix
LIST OF ILLUSTRATIONS
Fig. 2-1 - Layered design in Guruprasad and Mukherjee [2] [3] ... 9
Fig. 2-2 - Deformation of three layers [2] [3] ... 10
Fig. 2-3 - Force in load cell and hammer decelerating force vs system: a) Five-layer aluminium; b) single mild-steel tube [4] ... 4
Fig. 2-4 - High speed film of deformation of five-layer aluminium tube [4] ... 5
Fig. 2-5 - Sledge apparatus for high speed compression of ring systems [4] ... 6
Fig. 2-6 - Non-dimensional quasi-static load-deflection curves for rings tested [4] ... 7
Fig. 2-7 - Deformed states of thick, annealed brass ring systems [4] ... 8
Fig. 2-8 - Deformation of the rings using plates and masses [4] ... 8
Fig. 2-9 - Material and geometry details of an empty metal beverage can [6] .... 11
Fig. 2-10 - Global view of the large-scale experiment [6] ... 12
Fig. 2-11 - Propagation of blast pressure wave inside concrete sewage pipe [6] 12 Fig. 2-12 - Progressive crushing stages of beverage cans [6] ... 13
Fig. 2-13 - (a) Example of final deformation pattern of a beverage can. (b) Comparison of transferred load-time histories [6] ... 13
Fig. 2-14 - Implementation of BRDC to building envelope panel [7] ... 14
Fig. 2-15 - Illustration of the System Response States (a) without BRDC and (b) with BRDC [7] ... 14
Fig. 2-16 - Free-field pressure-time variation [7] ... 15
Fig. 2-17 - Potential Loading and Support Conditions for Round HSS ... 17
Fig. 2-18 - Stress-strain values used in the Multi-Linear Hardening Material Model [7] ... 18
Fig. 2-19 - Force-Deformation Response of a Round HSS7x0.25 and Deformed Configuration at approximately 152 mm [7] ... 19
Fig. 3-1 - Test pieces from 48,3 mm and 76,1 mm ... 24
Fig. 3-2 - Dimensions of the test specimens ... 25
Fig. 3-3 - Results of the tensile test to the tubes of 48,3 mm and 76,1 mm ... 25
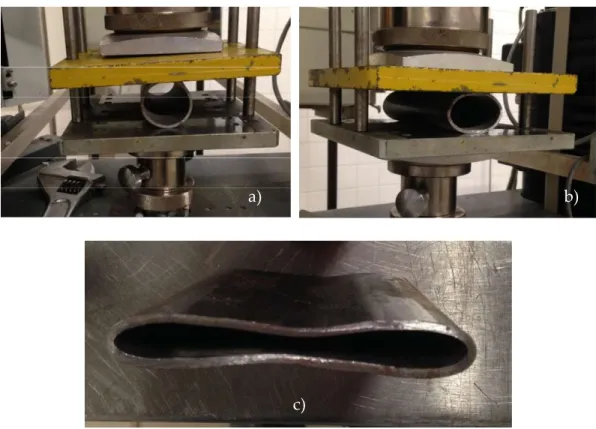
Fig. 3-4 – Sequence of the compression test a) tube before suffers any deformation; b) tube while being deformed; c) tube totally deformed ... 26
Fig. 3-5 - Results of the compression test on the tubes of 48,3 mm and 78,3 mm diameter ... 27
Fig. 3-6 - Finite Element mesh and the deformed of the ADINA model ... 28
Fig. 3-7 - Force/displacement graphic from ADINA ... 29
Fig. 3-8 - Mechanism used to calculate the analytical model ... 31
Fig. 3-9 - Dimension of the steel tube ... 32
Fig. 3-10 – Force/displacement graphic for the plastic model ... 32
x
Fig. 3-12 - Comparison from the laboratorial, analytical and ADINA for 76,1
mm tube ... 34
Fig. 4-1 - Worker drilling a slab ... 37
Fig. 4-2 - Layout of the steel tubes and the upper panels ... 37
Fig. 4-3 - Casting of the bottom slab ... 38
Fig. 4-4 - Bottom view of the concrete slab with reinforcement ... 38
Fig. 4-5 - 48,3 mm and 76,1 mm tubes ... 39
Fig. 4-6 - Slab with 48,3 mm steel tubes assembled ... 39
Fig. 4-7 - Scheme of the testing system ... 40
Fig. 4-8 - 6 kg of Eurodyn 2000 ... 41
Fig. 4-9 - Gallows structure to position the explosive ... 41
Fig. 4-10 – Measurements of the residual deformation of the slab ... 42
Fig. 4-11 - Measuring system for the instantaneous deflection of the model ... 43
Fig. 4-12 – Model FS1 - Cracking on the edge of the slab ... 44
Fig. 4-13 – Model FS1 - Cracks on the bottom surface of the slab ... 44
Fig. 4-14 – Model FS2 - prepared to be tested ... 45
Fig. 4-15 - Model FS2 - Deformation on the steel tubes ... 45
Fig. 4-16 - Model FS2 - Cracks in the bottom surface of the slab ... 46
Fig. 4-17 - Model FS3 ready to test ... 46
Fig. 4-18 - Model FS3 - Deformed tubes ... 47
Fig. 4-19 - Model FS3 - Cracks on the bottom surface of the slab ... 47
Fig. 4-20 - Cracks on the bottom and on the edge of the slab ... 48
Fig. 4-21 - Cube testes in the laboratorial of the civil department of FCT-UNL . 49 Fig. 5-1 – Dynamic force-displacement for both tubes using expression (3-18) . 55 Fig. 5-2 – Energy deformation-displacement ... 55
Fig. 5-3 – Plates and tubes on a rigid support ... 56
Fig. 5-4 – Dynamic force-displacement for the tubes used in the tests ... 63
Fig. 5-5 – Energy deformation-displacement of the tubes used in the tests ... 64
Fig. 5-6 - Position of the tubes on the slab for Fig. 5-7 and Fig. 5-8 ... 66
Fig. 5-7 - Graphic with the residual deformation of the 76,1 mm tubes after blast. ... 67
xi
LIST OF TABLES
Table 2-1 - Reflected overpressure [2] [3] ... 10
Table 2-2 - Details of tube systems tested in [5]... 4
Table 2-3 - Transient Finite Element Analysis Cases and Results [7] ... 16
Table 2-4 - BRDC Experimental Specimen Details [7] ... 18
Table 2-5 - BRDC FEA Results [7] ... 18
Table 3-1 - Steel characteristics ... 25
Table 3-2 - Yielding forces from the tubes compression tests ... 27
Table 3-3 - Representative values of the analytical model ... 32
Table 4-1 - Explosion characteristics ... 42
Table 4-2 – Tested large scale models ... 43
Table 4-3 - Deformations of the slab models ... 48
Table 4-4 - Results of the compression tests ... 49
Table 5-1 - Dynamic increments ... 53
Table 5-2 - Concrete characteristics ... 53
Table 5-3 - Steel characteristics ... 54
Table 5-4 - Tubes dynamic characteristics ... 54
Table 5-5 - Tubes characteristics incremented ... 54
Table 5-6 - Scaled distance on the two plates analysed ... 56
Table 5-7 – Calculated energy characteristics ... 57
Table 5-8 – Deformation and force needed to dissipate the energy for each tube ... 57
Table 5-9 – Force applied per square meter in the lower slab ... 58
Table 5-10 – Comparison of the tube forces with the cracking and yielding slab forces ... 61
Table 5-11 - Characteristics of the tubes used ... 63
Table 5-12 – Deformation and force of the tubes ... 64
Table 5-13 – Force applied per square meter in the lower slab ... 65
xiii
LIST OF ABBREVIATIONS AND
ACRONYMS
Abbreviations
a Deformation
A Area
As Area of steel in a reinforced concrete cross section b Width of a cross section
D Tube diameter
d Horizontal distance from both hinges Ecm Young modulus of concrete
Ep Strain-hardening modulus Es Young modulus of steel
fck Characteristic value of the concrete stress resistance in compression for cylindrical specimens
fcm Average value of the concrete stress resistance in compression for cylindrical specimens
fcm,cube Average value of the concrete stress resistance in compression for cube specimens
fcm,d Average of the dynamic value of the concrete stress resistance in compression for cylindrical specimens
fctm Average value of the concrete stress resistance in tension
fctm,d Average of the dynamic value of the concrete stress resistance in tension ft Maximum steel stress
fy Yielding steel stress
fym,d Dynamic yielding steel stress H Hardness number of the material
h Height
Ir Reflected impulse
xiv
Lw Wave length
m Mass
Mcr,d Dynamic cracking moment Meq Equivalent mass
Mp Plastic moment
Mp,d Dynamic plastic moment My Yielding moment
My,d Dynamic yielding moment P0 Yielding load of the tube Pa Atmosphere pressure
Pr Reflected overpressure peak value Pp Collapse load of the tube
Pso Incident overpressure peak value Py Yield force
R Distance to the centre of the blast
ρ Density
σ0 Yield stress t Wall thickness T Kinetic energy
t0 Duration of the positive shock wave U Velocity of the wave
Veq Equivalent velocity W Absorbed energy
Wc Bending modulus of the concrete cross section WTNT Equivalent TNT weight of the explosive Z Scaled distance
xv Acronyms
BRDC Blast resistant ductile connector DIF Dynamic increment factor HSS Hollow structural section SIF Strength increment factor
1
1.
INTRODUCTION
Blast threat
A statistic developed by Study of Terrorism and Responses to Terrorism (START) [1], presented in July 2017, shows that the terrorism is an everyday occurrence. According to this study in 2016 there were 11 072 terrorist attacks, that resulted in 25 621 deaths. The peak of deaths in the year of 2016 was in October of almost 100 deaths per day. To a rate of 2.4 deaths per attack the urge is massive to develop a system that can protect buildings and their users
The explosion of a bomb can induce enormous damages in his surroundings. Current buildings are not designed for the dynamic effects that an explosion introduces, what can destroy them. These dynamic effects are a shock wave, the expel of hot gases, ground vibrations and throw of materials, all of this in a split second. Most buildings are not prepared to face these, and these can result in a catastrophe.
Objectives
The objective of this thesis is to take an experimental campaign to study a system able to reduce the blast effects in buildings. This system is a precast concrete sandwich panel, composed by a “sacrificial layer” of steel tubes in between the two concrete plates. Two steel dimensions are studied: 48,3 mm of outer diameter and 2,6 mm of wall thickness and 76,1 mm of diameter and 3,2 mm of wall thickness.
2
The research aims to study the efficiency of each tubes geometry used in large-scale models and how it can affect the mitigation of energy. It is also a major objective to test the viability of this system to be used as a protection against a terrorist attack.
Organisation
3
2.
STATE OF ART
Introduction
Due to the devastating effects of an explosion and with the growing of terrorist threat, the possibility of mitigation the damage on buildings due to explosions has been studied by several authors. This chapter will describe the most relevant researches in the scope of this subject.
Therefore, an investigation of the inertia effects in one-dimensional metal ring systems. An analytical study on sacrificial claddings under blast loading will be presented. A large scale testing program of recyclable metal beverage cans. An experimental investigation about a mitigation of pressure impulses through blast resistant connectors. These studies improve the understanding in the capacity of energy dissipation and how can these tubular structures be used. The characterization of the explosion is essential to ensure that the design of the system is the correct one. Some important characteristics are the peak pressure (PS0) and the duration of the explosion, these parameters will be described in chapter 3.
Research Works
In 1983 Reid and Reddy [2] studied the inertia effect in a one-dimensional metal ring system subjected to end impact. The knowledge acquired with this experiment will allow us to predict and to see how this type of structures react to an impact situation.
4
penetration of an indenter, the Ep is the strain-hardening modulus of the
material, D is the diameter, t the thickness and b the extent of the ring.
Table 2-1 - Details of tube systems tested in [3]
Test Material System tested
Dimensions
(mm) Impact
speed (ms-1)
Mass of hammer (kg)
Quasi-static material properties
D t b (kgf/mmH 2) (MPa)σo (GPa)Ep
3 Mild-steel Single tube 50 1,6 100 3,42 35,00 113 269 1,65 4 Mild-steel Single tube 50 1,6 100 5,40 13,70 113 269 1,65 7 Aluminium Single tube 50 1,6 100 2,18 35,00 34 100 1,24 8 Aluminium Ten tubes in
five layers 50 1,6 100 7,16 37,19 34 100 1,24
The conclusion of the impact speeds attainable using the drop hammer apparatus is that the response of a tube system can be deduced from that of a single tube by a scaling process equivalent to that demonstrated for quasi-static loading. The main reason for this was that, to a good approximation, the deformation is uniformly distributed throughout the system.
In Fig. 2-1 a) the response of the five-layered systems of aluminium tubes can be seen, and Fig. 2-1 b) shows the response of a single mild steel tube.
5
In the vertical axis the P/L is the force divided by the length of the tubes, P/P0 is
the force divided by the initial collapse load. The horizontal axis is the total compression of the system divided by the diameter of the tubes multiplied by the number of layers.
The Fig. 2-2 shows a sequence of images of the deformation of the five-layer tubes. The mode of deformation of each tube is almost the same as seen during quasi-static compression. The deformation happens in an even way throughout the all system.
6
To emphasise the effects of the inertia of tube-like systems, tests were done using the device shown in Fig. 2-3.
Fig. 2-3 - Sledge apparatus for high speed compression of ring systems [2]
The main quasi-static material properties can be deduced from the load-deflection curves for single rings laterally compressed between flat plates. These curves are presented in non-dimensional form in Fig. 2-3 and the main material and geometrical parameters are summarized in Table 2-1. These are derived from the following formula.
𝑃 = 𝜎 ∗ 𝑡 ∗ 𝑏
𝐷 − 𝑡2 [𝑘𝑁] (2-1)
Where P0 is the collapse load of the ring, 𝜎0 is the yield stress of the material, D
7
Fig. 2-4 - Non-dimensional quasi-static load-deflection curves for rings tested [2] Numerous systems were tried to observe each response in function of impact speed, in the sledge mass and in the number of rings in the system as well as the material used.
8
Fig. 2-5 - Deformed states of thick, annealed brass ring systems [2]
The inertia effect is higher when the impact tests speed was lower. The deformation of these systems, based in rings, is affected by the spread of a shock wave. The speed of the impact and the load ricochet of the ring are the controlling factors. The deformation is perhaps determined by the remaining kinetic energy in the system at the moment of the encounter of the reflected plastic wave and the shock wave. The systems with plates indicate how masses can be used to improve the distribution of deformation (Fig. 2-6).
9
In 1999 Guruprasad and Mukherjee [4] [5] made a study showing the analytical model of a sacrificial cladding under a blast load. This paper shows how a structure behave while having a sacrificial cladding to a blast load.
Fig. 2-7 - Layered design in Guruprasad and Mukherjee [4] [5]
The cladding layers are manufactured of thin mild steel sheets and the structure can be designed in two layers: a sacrificial and a non-sacrificial (Fig. 2-7).
The final configuration of this system (Fig. 2-7) needs to ensure three important aspects: there should be enough space available within each layer for large plastic deformations to take place; it is important that the layers should not break during the blast loading; and the layers should get crushed effectively and the pattern of deformation should remain unchanged every time for the expected blast loading. These three aspects are essential since it is the sacrificial cladding that dissipates the blast energy.
10
Table 2-2 - Reflected overpressure [4][5]
Case no. Sheet thickness (mm) No. of layers Peak pressure (N/mm2) Time duration (sec)
1 1,6 1 3,38 0,0010803
1a 1,6 3 3,38 0,0010803
2 1,6 1 5,35 0,0010815
2a 1,6 3 5,35 0,0010815
3 1,2 (1,6 web) 3 2,71 0,0014469
4 1,2 3 2,71 0,0014469
From Fig. 2-8 it can be concluded that a simple analytical model is able to predict the layer collapses accurately. The simple analytical model achieves a realistic distribution of mass by lumping the masses at very close intervals. This may be the key to the success of the simple model.
Fig. 2-8 - Deformation of three layers [4] [5]
11
In 2011, a group of engineers [6] tested a sacrificial cladding made of empty recyclable beverage cans in a large-scale air blast load. This study shows how an every-day object can be used for the protection of civil engineering structures.
They selected empty recyclable metal beverage cans. A special care was taken to choose cans without defects, so the tests won’t be compromised. The cans chosen to the study were those from a combination of two materials, body in steel and the top cover made of aluminium (Fig. 2-9)
Fig. 2-9 - Material and geometry details of an empty metal beverage can [6]
12
Fig. 2-10 - Global view of the large-scale experiment [6]
Fig. 2-11 shows the explosion of C4 and the propagation of the pressure wave inside the concrete pipes. In the same illustration can be seen a perfectly plane shock wave was formed at the other end of the tube.
Fig. 2-11 - Propagation of blast pressure wave inside concrete sewage pipe [6]
13
showed that the use of beverage cans reduces substantially the peak crush load and the duration of the event was extended considerably (Fig. 2-13 b)).
Fig. 2-12 - Progressive crushing stages of beverage cans [6]
Fig. 2-13 - (a) Example of final deformation pattern of a beverage can. (b) Comparison of transferred load-time histories [6]
From the obtained results, the conclusion is that the beverage cans can be used to protect structures from an air blast load.
14
The panel tested is a 3,66 m by 7,32 m with 0,15 m thick pre-cast 34,5 MPa concrete panel. This panel is reinforced only for temperature and shrinkage action according to ACI 318-08 [8] and is designed to remain elastic by capacity design to the BRDC. The BRDC is connected to the exterior building frame on top and bottom edges of the panel (Fig. 2-14).
Fig. 2-14 - Implementation of BRDC to building envelope panel [7]
The strength and deformation of this concrete panel was designed to determine the limits on the BRDC for protecting a minimally reinforced panel. The yield strength of the panel will provide an upper limit on the strength of the BRDC (Fig. 2-15).
15
A simplified triangular linear function representing the positive phase of the impulse from the blast history is considered instead of the more complex real pressure-time variation (Fig. 2-16). This simplification is considered because it captures the parameters of most interest: the peak reflected pressure (Pr
)
andthe reflected impulse (Im).
Fig. 2-16 - Free-field pressure-time variation [7]
The relative displacement of the middle and the corner of the panel was calculated and the difference approximately 50 % larger than 4,1 mm, which means that the elastic displacement limit was exceeded. The results of BRDC deformations from the nonlinear transient finite element model and the theoretical model are presented in Table 2-3. The deformation from the nonlinear analysis and from the theoretical evaluation were similar, with an average difference of 9,1%.
16
Table 2-3 - Transient Finite Element Analysis Cases and Results [7]
Case # (kPa-ms) Impulse BRDC Yield Force (kN)
FEA Results Theoretical Model % Diff, BRDC Disp (Theoretical
vs. FEA) BRDC
Disp (cm) Def. (mm) Dif Panel Disp (cm) BRDC
1 46 46,7 0,44 1,26 0,75 -72,5
2 46 13,4 0,82 0,7 0,97 -17,8
3 140 46,7 1,34 3,86 1,31 2,2
4 140 13,4 2,88 1,51 2,91 -1,0
5 436,2 46,7 6,73 6,55 6,75 -0,2
6 436,2 13,4 21,24 1,98 21,94 -3,3
17 154,9 46,7 1,6 4,55 1,45 9,2
18 154,9 37,8 1,81 4,02 1,64 9,3
19 154,9 13,4 3,77 1,56 3,41 9,5
20 249,4 46,7 3,04 5,28 2,67 12,1
21 249,4 42,3 3,27 4,82 2,89 11,7
22 249,4 13,4 8,59 1,77 7,68 10,6
23 470,1 46,7 8,81 6,61 7,75 12,0
24 470,1 44,9 9,13 6,36 8,03 12,1
25 470,1 31,2 12,76 4,58 11,3 11,5
26 470,1 13,4 27,97 1,99 25,44 9,1
27 95,2 46,7 0,98 2,79 0,98 1,0
28 95,2 42,3 1,04 2,71 1,01 2,5
29 95,2 23,4 1,4 2,02 1,29 7,9
30 95,2 13,4 1,9 1,31 1,74 8,5
31 177,6 46,7 1,9 5,09 1,69 10,6
32 177,6 37,8 2,19 4,26 1,94 11,4
33 177,6 23,4 3,07 2,71 2,72 11,6
34 177,6 13,4 4,83 1,57 4,26 11,9
35 284,9 46,7 3,71 5,48 3,28 12,3
36 284,9 44,9 3,85 5,29 3,39 12,0
37 284,9 13,4 11,17 1,79 9,82 12,1
47 200,2 46,7 2,13 5,06 1,97 7,4
48 200,2 37,8 2,50 4,23 2,28 8,7
49 200,2 13,4 5,91 1,59 5,22 11,6
50 321,0 46,7 4,21 5,48 3,99 5,2
51 321,0 42,3 4,60 5,08 4,34 5,6
52 321,0 13,4 13,74 1,68 12,30 10,5
53 514,4 46,7 9,53 5,84 9,18 3,6
54 514,4 44,9 9,90 5,63 9,52 3,8
55 514,4 33,4 13,46 4,34 12,60 6,4
17
Lavrarnway and Pollino proposed several potential BRDC designs, however they only presented the round hollow structural sections (HSS). A round HSS is expected to dissipate blast energy by plastically deforming radially inward forming four yield lines.
Fig. 2-17 - Potential Loading and Support Conditions for Round HSS
(a) Point Load/Support and (b) Contact Surfaces [7]
The round HSS can be connected to the panel and exterior framing in a configuration that can apply a concentrated line of loads or provides a contact surface at two sides of the HSS as seen in Fig. 2-17.
18
Table 2-4 - BRDC Experimental Specimen Details [7]
The values of the stress-strain for the large displacements expected to develop in the test can be seen in Fig. 2-18. The analysis of the model required the use of the computer program ANSYS, the model was loaded until it reaches the 76 mm displacement required.
Fig. 2-18 - Stress-strain values used in the Multi-Linear Hardening Material Model [7] The critical values of the tests can be seen in Table 2-5. The force-deformation and the assessment of the experimental results and the FEA results can be seen in Fig. 2-19.
Table 2-5 - BRDC FEA Results [7]
Section Stress at Side Hinge (MPa) Strain as Side Hinge (%) Yield Force (kN)
HSS 16x0.375 484 5,9 34
HSS 10.75x0.25 476 27,5 25
HSS 7x0.25 853 26,3 45
As expected the stress and strain increases as the diameter decreases. This happens due to the larger rotations that the HSS’s with the smaller diameters
HSS 16x0.375 A53 Gr. B 380 516 9.78 203 37 36.3 HSS 10.75x0.25 A106 Gr. B 406 477 6.48 203 25 25.3 HSS 7x0.25 A513 Type 5 772 848 6.40 140 44 49.8
Section Steel Grade
19
must go through because each section is expected to the same 152 mm displacement.
The FEA results and the experimental results show that a HSS provides a very good force and deformation behaviour for the BRDC application considered. The experimental results also showed that if the round HSS experiment cracking at the outer fibres still sustains a good carrying load capacity after the cracking.
Fig. 2-19 - Force-Deformation Response of a Round HSS7x0.25 and Deformed Configuration at approximately 152 mm [7]
21
3.
ENERGY DISSIPATION DEVICES
Introduction
To analyse the large-scale models used in this study, the principle of conservation of energy was used. This principle will be explained in the next section. The explosion energy is dissipated mainly by steel hollow circular bars, or tubes, with no welding. The mass, needed for the kinetic energy is given by concrete panels placed on top of the tubes, whose thickness (mass) was designed according to the tube energy dissipation characteristics.
Two types of steel tubes, from ST37 type, were used, one with 2,6 mm of thickness and 48,3 mm external diameter and another with 3,2 mm thickness and with 76,1 mm of external diameter.
The energy dissipation capacity of the tubes was estimated using three models. An analytical model was used considering a plastic behaviour to estimate the tubes plastic deformation energy, which will be explained in section 3.6. A numerical model, using the computer program ADINA, was used to analyse the tubes behaviour and quantify the tubes deformation energy. At last, experimental tests of the tubes were performed, in a compression machine, to quantify the real deformation energy of the tubes.
Principle of conservation of energy
The energy absorbed by the tubes and the panels can be estimated by using the principle of energy conservation.
𝑇 = 𝑊 (3-1)
22
The kinetic energy of a system with one degree of freedom is given by:
𝑇 =12 ∗ 𝑚 ∗ 𝑣 (3-2)
Where meq is the equivalent mass and veq is the equivalent velocity of the system.
Therefore, considering the 2º Law of Newton:
𝐹 = 𝑚 ∗ 𝑎 = 𝑚 ∗ 𝑣⃗𝑡 (3-3)
Using the force in the time of interaction:
𝐹 ∗ 𝑡 = 𝑚 ∗ 𝑣⃗ (3-4)
And knowing that the impulse is:
𝐼 = 𝐹 ∗ 𝑡 (3-5)
Ergo,
𝐼 = 𝑚 ∗ 𝑣⃗ (3-6)
So, the kinetic energy can be calculated by:
𝑇 =12 ∗𝑚𝐼 (3-7)
The absorbed energy is the area of the graphic force/deformation, which means that the absorbed energy is different in all the methods used in the study. While using a rigid-plastic model, the dissipated energy is obtained as:
𝑊 = 𝑃 ∗ 𝑎 (3-8)
Where Pp is the collapse load of the tube and the amax is the maximum
23
To estimate the thickness of the concrete panel, it is needed to characterize the explosion. To do this the reflected impulse (ir), per unit area, can be estimated
by:
𝑖 = 𝑖 𝑃𝑃 (3-9)
Rankine-Hugoniot [18], according to T. João [9], calculated the reflected overpressure of the peak (Pr) in function of the atmosphere pressure (Pa) and the
incident overpressure (Pso).
𝑃 = 2𝑃 7𝑃 + 4𝑃7𝑃 + 𝑃 (3-10)
Kinney & Graham [9] proposed to estimate the incident overpressure in function of the scaled distance (Z) and the atmosphere pressure (Pa).
𝑃 = 808 1 + 𝑍 4,5 𝑃
1 + 𝑍 0,048 ∗ 1 + 𝑍 0,32 ∗ 1 + 𝑍 1,35
(3-11)
They also propose an empirical equation determining the specific shock wave impulse, per unit area, (is).
𝑖 =0,0067 1 + 𝑍 0,23 𝑍 ∗ 1 + 𝑍 1,55
(3-12)
24 𝑍 = 𝑅
𝑊 (3-13)
Steel characterization
To characterize the steel of the tubes, tensile tests on bone shaped specimens [12] were done in a Zwick machine with the load capacity of 50kN.
The test specimens were cut in the longitudinal direction, knowing that the longitudinal and the transversal directions of the tubes may have different mechanical characteristics, what may have influence on the analysis of the results. Fig. 3-1 shows the test specimens from both 48,3 mm tube and 76,1 mm tube, and Fig. 3-2 shows the dimensions of the specimens. Only three specimens were tested for each tube diameter.
25
Fig. 3-2 - Dimensions of the test specimens
Fig. 3-3 shows the behaviour of the steel specimens under tension and the average values of the yielding stress (fy), the elastic modulus (Es), the maximum
stress (ft) and the strain hardening modulus (Ep), calculated by using a point in
the beginning of the plastic phase and another in the end, in Table 3-1.
Table 3-1 - Steel characteristics
∅ (mm) fy (MPa) Es (GPa) ft (MPa) Ep (MPa)
48,3 453 180 585 1445
76,1 452 217 528 673
Fig. 3-3 - Results of the tensile test to the tubes of 48,3 mm and 76,1 mm
0 100 200 300 400 500 600 700
0 0,05 0,1 0,15 0,2 0,25 0,3
St re ss (M Pa ) ε (%)
26
Experimental tests of the tubes under compression
The tube specimens were tested in a Zwick machine with the load capacity of 50kN. The test results will be used to calibrate the numerical and analytical models. From these tests the energy dissipation of the tubes and other mechanical characteristics are obtained. To simulate the real situation where the tubes were compressed between two steel plates, Fig. 3-4. Three specimens, with 150 mm long, of each tube diameter were tested. The test results are shown in Fig. 3-5.
Fig. 3-4 – Sequence of the compression test a) tube before suffers any deformation; b) tube while being deformed; c) tube totally deformed
a) b)
27
Fig. 3-5 - Results of the compression test on the tubes of 48,3 mm and 78,3 mm diameter
Table 3-2 - Yielding forces from the tubes compression tests
∅ (mm) Py (kN) Py,av (kN)
48,3 19,46 20,58 20,56 21,72 76,1 13,81 16,66 19,21 16,97
Numerical model
The numerical model was developed using the finite element program ADINA. ADINA was used to perform a nonlinear analysis and considering material non-linearities and large deformations, to understand the tube behaviour under
0,00 10,00 20,00 30,00 40,00 50,00 60,00
0,00 10,00 20,00 30,00 40,00 50,00 60,00 70,00
P
(k
N)
d (mm)
28
increasing transversal force. This program allows to export the force-deformation data, so the dissipated energy can be calculated.
Fig. 3-6 shows only one-quarter of the tube to reduce the calculation effort. With only a quarter of the tube modelled, the deformations and the force are half the real ones. The ends of the model were only allowed to move in one direction with no rotation, as it can be seen in Fig. 3-6, so the end C could only move vertically and the edge B could only move horizontally. Fig. 3-7 shows the force/displacement plot obtained from this analysis.
29
Fig. 3-7 - Force/displacement graphic from ADINA
Comparing the Fig. 3-7 with Fig. 3-10 the differences can be seen, this happens because in ADINA it was not considered the drifting of the force when the deformation is occurring, this means that in the plastic zone of the graphic the force does not grow as it grows in the analytical model presented in the next chapter.
Analytical model
The analytical model was made using a plastic model. The tubes are compressed between plates and it is assumed that the tubes plasticize in four plastic hinges, Fig. 3-8, and assuming, as well, that there is no deformation between the plastic hinges, i.e., rigid bodies were considered between these plastic hinges. Eq. (3-14) may be obtained by equilibrium of the model shown in Fig. 3-8. The distance d, between the force application point and the mid-height plastic hinge, may be obtained from Fig. 3-8, reduced by the dimension of the mid-height plastic hinge, that was assumed equal to the thickness of the tube wall. 0,00 5,00 10,00 15,00 20,00 25,00
0,00 10,00 20,00 30,00 40,00 50,00 60,00 70,00 80,00
P
(k
N)
d (mm)
30
In these equations Pp stands for the applied plastic force, Mp is the plastic
moment of the tube wall, D is the tube diameter at the centre of the wall (exterior diameter minus the wall thickness), and a is the tube transversal deformation.
In the case of no deformation, the force is applied on the top of the tube. As the deformation grows the force position moves and the horizontal distance (d) decreases, between the force application point and the mid-height plastic hinge, as it can be seen in Fig. 3-8.
Considering a moment linear variation from My to Mp the values obtained by
Eq. (3-14) were multiplied by a coefficient k, resulting in Eq. (3-17), which varies between 1 and Mp/My accordingly to Eq. (3-16), where a is the deformation of
the tube and (D-t) the maximum deformation the tube can withstand. This moment variation from Myto Mp is due to the change of the stress distribution
in the wall cross section and due to the strain hardening of the steel.
𝑘 = 1 + 𝑀𝑀 − 1 ×𝐷 − 𝑡𝑎 (3-16)
𝑃 × 𝑑 = 2 × 𝑀 (3-14)
31
Fig. 3-8 - Mechanism used to calculate the analytical model
The yielding moment My and the ultimate moment Mp may be determined by
Eq. (3-18) and (3-19), where b is the length of the tube, i.e., the width of the tube wall cross section, t is the thickness of the tube wall (see ), fy is the yield steel
stress and ft is the ultimate steel stress. Note that, to simplify the analysis, the
axial force in the mid-height plastic hinge was not considered in the quantification of the yielding moment and the ultimate moment.
Fig. 3-9 - Dimension of the steel tube 𝑃 = 8 × 𝑀
√𝐷 − 𝑎 − 4 ∗ 𝑡× 𝑘 (3-17)
P/2
P/2
P/2
P/2
a/2
a/2
P/2
P/2
M
M
D/2
r
r
d
a/2
t b
32
𝑀 = 𝑓 ∗𝑏 ∗ 𝑡6 (3-18)
𝑀 = 𝑓 ∗𝑏 ∗ 𝑡4 (3-19)
As can be seen in Fig. 3-10, while using this model, the force P rises with the tube transversal deformation, because the distance a between the application point of the force and the mid-height plastic hinge decreases, and due to the k factor described above.
Fig. 3-10 – Force/displacement graphic for the plastic model
Taking into account the steel characteristics obtained in the tensile tests, Table 3-3, presents the values that, while using this analytical model, represents the behaviour of the tubes under compression.
Table 3-3 - Representative values of the analytical model
∅ (mm) My (kNm) Mp (kNm) kmax = Mp / My P(d=0) (kN)
48,3 76,56 149,57 1,95 17,35
76,1 115,71 207,36 1,79 15,40
0,00 10,00 20,00 30,00 40,00 50,00 60,00 70,00
0,00 10,00 20,00 30,00 40,00 50,00 60,00 70,00
P
(k
N)
d (mm)
33
Analysis of the results
Fig. 3-11 and Fig. 3-12 show the force/displacement plot of the tests of three 48,3 mm and 76,1 mm diameter tubes, respectively. The results obtained show that the analytical model is closer than the ADINA model to the test results. The figures also show that the ADINA model adjusts quite well in the elastic phase, in the plastic phase the model does not contemplate the drift of the force while the deformation occurs. Both models do not have the same yielding force point as in the real tests, this shows the difference in the transversal and the longitudinal directions of the steel.
Fig. 3-11 – Comparison from the laboratorial, analytical and ADINA for 48,3 mm tube
0,00 10,00 20,00 30,00 40,00 50,00 60,00
0,00 10,00 20,00 30,00 40,00 50,00 60,00
P
(k
N)
d (mm)
34
Fig. 3-12 - Comparison from the laboratorial, analytical and ADINA for 76,1 mm tube
0,00 10,00 20,00 30,00 40,00 50,00 60,00 70,00
0,00 10,00 20,00 30,00 40,00 50,00 60,00 70,00 80,00
P
(k
N)
d (mm)
35
4.
TEST OF LARGE SCALE MODELS
Introduction
The aim of these experimental research was to study a solution of steel tubes, distributed over a concrete slab and supporting concrete plates with a predefined thickness. The mass of the concrete plates, with a pre-established thickness, would define a kinetic energy that the plastic deformation of the steel tubes would dissipate. The base slab reinforcement was designed to resist the maximum plastic force of the dissipaters without yielding.
The objectives of the research were not achieved because there were two mistakes in the production of the testing models. The precast contractor did not supply top plates with the designed thickness (two different thickness were specified: 0,06 m and 0,10 m) and the plates supplied were only 0,07 m thick. On the other hand, the bottom reinforced concrete slabs had the bottom reinforcement on the top face and a much weaker reinforcement on the bottom. This last error was only detected after the tests.
The aim was to analyse two parameters in this study: different masses of the top concrete panels, corresponding to two different panel thicknesses; and different energy dissipaters, corresponding to two different steel tubes (76,1 mm diameter with 3,2 mm wall thickness and 48,3 mm diameter with 2,6 mm wall thickness).
The present chapter describes the tested models.
36
tests were performed: one slab alone, reference model; one model with 0,07 m thick plates and 76,1 mm diameter steel tubes; and one model with 0,07 m thick plates and 48,3 mm diameter steel tubes.
The blast tests campaign was performed at the Campo Militar de Santa Margarida. The handling and transportation of all the explosive material were done by the army personnel and in agreement with the security procedures approved by the Portuguese Army.
Experimental Models
In order to test the anti-blast system, four reinforced concrete pre-cast slabs were used, with 2,6 x 2,0 m and 0,12 m thick. One slab was the reference specimen and the other two had different dissipating systems:
8 panels with 0,07 m on top of 32 steel tubes of 76,1 mm external diameter;
8 panels with 0,07 m on top of 32 steel tubes of 48,3 mm external diameter
37
Fig. 4-1 - Worker drilling a slab
Fig. 4-2 shows the layout of the steel tubes and at the upper concrete panels. Each line had four tubes 0,350 m away from each other, in 8 lines 0,325 m apart. Each 0,07 m thick panels were placed on top of four steel tubes.
38
The three bottom slabs are reinforced with a ϕ5//0,10 on the bottom, as may be seen in Fig. 4-4, and ϕ10//0,10 on top. Fig. 4-3 shows the casting of the bottom slab, at Concremat, with the mentioned steel reinforcement.
Fig. 4-3 - Casting of the bottom slab
Fig. 4-4 - Bottom view of the concrete slab with reinforcement
39
The upper concrete panels are 1,00 m x 0,65 m, with 0,07 m thickness and these panels are reinforced with an electro-welded welsh #NAQ50, which is squared mesh with bars ϕ5 spaced 0,10 m.
The two types of steel tubes chosen, 76,1 mm and 48,3 mm (Fig. 4-5), have different energy dissipation capacity due to different yielding force and maximum displacement
Fig. 4-5 - 48,3 mm and 76,1 mm tubes
The steel tubes distribution is presented in Fig. 4-2 and the assembly of the slab with the tubes can be seen in Fig. 4-6.
40
Testing System
The system was composed by four inverted T beams, with 0,30 m in height and 1,65 m long, where the models were supported.
The explosive was mounted in a gallows structure, to ensure that the height of the explosives was the correct one and tighten by strands to anchor in the ground to be sure that the explosive didn’t move due to the wind force. Fig. 4-7 is shown the system described. This system ensures that there’s no obstacle between the explosives and the model, i.e., the shock wave doesn’t have amplifications due to reflection.
Fig. 4-7 - Scheme of the testing system
41
Fig. 4-8 - 6 kg of Eurodyn 2000
The explosives were mounted at 1,85 m (Fig. 4-9) from the top of the slab.
Fig. 4-9 - Gallows structure to position the explosive
42
Table 4-1 - Explosion characteristics
Pa (Pa) Z (m/Kg1/3) Pso (MPa) Pr (MPa) Is (MPa.s) ir (MPa.s) Ir, total
101325 1,12 0,79 4,05 0,11 0,57 2,95
After the test, the residual and the instantaneous deflection at mid span as well as the cracks formed by bending of the slab, were measured.
For the residual deflection at the mid-span, a two meter straight aluminium profile and a measuring tape were used (Fig. 4-10). The deformation of the slab was also measured before the explosion to know exactly which was the residual deformation of the slab due to the blast
Fig. 4-10 – Measurements of the residual deformation of the slab
To measure the instantaneous deflections, the system used consisted on two blocks of wood laying with five holes (Fig. 4-11), which were filled in with an expansive foam. A rod with 170 mm was inserted partially in each foam box, allowing for about 150 mm to drop out and mark the instantaneous deflections. The instantaneous deformations suffered by the slab are known measuring the difference between the depth marked before the explosion and the new depth of the rods.
Point 1
43
Fig. 4-11 - Measuring system for the instantaneous deflection of the model
Test results
Table 4-2 summarizes the characteristics of the four models tested. In this table h1 stands for the thickness of the top concrete plates, h2 is the thickness of the
bottom slab and ϕ is the steel tubes external diameter.
Table 4-2 – Tested large scale models
Test WTNT (Kg) Z (m/Kg1/3) h1 (m) h2 (m) ∅ (mm)
FS1 4,5 1,12 – 0,12 –
FS2 4,5 1,12 0,07 0,12 76,1
FS3 4,5 1,12 0,07 0,12 48,3
FS4 4,5 1,12 – 0,12 –
Test of model FS1:
44
Fig. 4-12 – Model FS1 - Cracking on the edge of the slab
The instantaneous deflection measured by the system described shown values between 10 mm and 25 mm. Some rods of the measuring device could not be read due to a failure in the foam because some of the foam was not in the best conditions.
Fig. 4-13 – Model FS1 - Cracks on the bottom surface of the slab
The residual deformation was measured in two points and the values were 6 mm and 10 mm, respectively.
Test of model FS2:
45
Fig. 4-14 – Model FS2 - prepared to be tested
Fig. 4-15 - Model FS2 - Deformation on the steel tubes
46
Fig. 4-16 - Model FS2 - Cracks in the bottom surface of the slab
The residual and the instantaneous deformations were smaller than on the first slab, as it can be seen in Table 4-3
Test of model FS3:
The third test (Fig. 4-17) the deformation of the steel tubes was smaller than in the previous one. The largest deformations were in the steel tubes placed in the centre of the slab, where deformations of around 4,5 mm were measured (Fig. 4-18).
47
Fig. 4-18 - Model FS3 - Deformed tubes
As in the previous tests, the bottom surface of the slab had cracks, along all the slab, due to bending (Fig. 4-19). These cracks are wider than in model FS2 and vary from 0,05 mm to 0,20 mm, what is also an improvement in relation to the reference model. However, the instantaneous and residual deformations were smaller than in model FS2, as can be seen in Table 4-3
48 Test of model FS4:
As in the first reference slab tested this also got numerous cracks in the bottom and on the edge of the slab. These cracks are in the order of 0,15 mm, and 0,1 mm in the edge of the slab (Fig. 4-20).
Fig. 4-20 - Cracks on the bottom and on the edge of the slab
The measured instantaneous deformation was around 14 and 25 mm. The residual deformation was 7 and 8 in the two points measured. These results are in the same region as in the first reference slab, this can be seen in Table 4-3.
Table 4-3 - Deformations of the slab models
Experimental model Measured deflections (mm) Instantaneous Residual
FS1 10 to 25 6 10
FS2 30 to 40 7 4
FS3 16 to 29 5 5
FS4 14 to 25 7 8
Concrete characterization
49
The compression resistance of the concrete determined with the test of 16 cubes, with 150 mm edge, cast on 21, 22 and 23 of June, (Fig. 4-21). The tests were performed at October the 2nd, one day after the large-scale tests in Sta. Margarida, that took place in October the 1st.
Fig. 4-21 - Cube testes in the laboratorial of the civil department of FCT-UNL
In Table 4-4 the results of these compression tests can be seen.
Table 4-4 - Results of the compression tests
21-06-2017 22-06-2017 23-06-2017 Weight (Kg) Force (kN) Stress (MPa) Weight (Kg) Force (kN) Stress (MPa) Weight (Kg) Force (kN) Stress (MPa)
1 7,880 1291 57,4 7,845 1213 53,9 7,935 1295 57,6
2 7,930 1260 56,0 7,865 1245 55,3 8,020 1198 53,2
3 7,800 1270 56,4 7,870 1282 57,0 7,935 1251 55,6
4 7,840 1275 56,7 7,935 1258 55,9 7,990 1167 51,9
5 - - - 7,865 1338 59,5 7,830 1227 54,5
6 - - - 8,050 1266 56,3 7,955 1283 57,0
The value that will be used for the calculations is the average stress fcm,cube which
50
stress for a cylindrical samples (fcm), to do this it was considered the following
expression and not the expression presented in the EC2 [13], because from the numerous tests done as been confirmed that the average stress is near 90 % of the compression stress from the cubes, instead of the 80 % from the EC2 [13].
𝑓 = 0,9 ∗ 𝑓 , = 50,3 𝑀𝑃𝑎 (4-1)
With fcm the characteristic stress (fck) of the concrete can be calculated also
presented in EC2.
𝑓 = 𝑓 − 8 = 42,3 𝑀𝑃𝑎 (4-2)
With these two characteristics it is possible to know the average tensile stress (fctm) and the young modulus of the concrete (Ecm
) with the expressions in the
EC2.
𝑓 = 0,3 ∗ 𝑓 ⁄ = 3, 6 𝑀𝑃𝑎 (4-3)
51
5.
ANALYSIS OF THE RESULTS
Blast action
The principles presented in section 3.2 were used to analyse the shock wave of the explosion effects on the large scale models.
The first step to characterize the shock wave is the scaled distance, this can be done through Eq. (3-13). Eurodyn 2000, the used explosive, has 75% of the power of TNT, which means that the 6 Kg of Eurodyn 2000 used corresponds to 4,5 Kg of TNT.
𝑍 = 𝑅
𝑊 =
1,85
4,5 = 1,12 𝑚 𝑘𝑔⁄
With this value of Z, when the shock wave hits the slabs it will not be plane once this value is below 1,5 m/kg1/3 according to Nabais [14]. For simplification
the shock wave will be described as a distributed impulse throughout the surface of each slab.
After knowing the scaled distance, it can be defined the peak pressure (Pso) and
the specific positive impulse (is), using Eq. (3-11) and Eq. (3-12) respectively.
These analytical equations, from Kinney and Graham [9], were chosen over the abacus of the American standard [15] once the results are very similar.
𝑃 = 808 ∗ 1 + 𝑍4,5 ∗ 𝑃
1 + 0,048 ∗ 1 +𝑍 0,32 ∗ 1 +𝑍 1,35𝑍
= 0,79 𝑀𝑃𝑎
𝑖 =0,0067 1 + 𝑍 0,23 𝑍 ∗ 1 + 𝑍 1,55
52
Having the value of the peak pressure the reflected pressure peak (Pr) can be
calculated through Eq. (3-10), using the value of atmospheric pressure (Pa) of
1,01 MPa.
𝑃 = 2𝑃 7𝑃 + 4𝑃7𝑃 + 𝑃 = 4,05 𝑀𝑃𝑎
Lastly, the specific reflected impulse (ir) can be calculated from Eq. (3-9).
𝑖 = 𝑖 𝑃 = 0,57 𝑀𝑃𝑎 ∗ 𝑠𝑃
Other aspects that should be taken in consideration for the characterisation of the shock wave are the duration of the positive shock wave (𝑡 ), according to Kinney and Graham [9].
𝑡 = 𝑊 ∗ 980 ∗ 1 + 𝑍0,54
1 + 𝑍0,02 ∗ 1 + 𝑍0,74 ∗ 1 + 𝑍6,9
= 1,03 𝑚 (5-1)
The velocity of the wave (U) is another important aspect to describe the shock wave, the next equation was suggested by Rankine-Hugoniot [18].
U = 𝐶 ∗ 1 +6 ∗ 𝑃7 ∗ 𝑃 = 0,99 𝑚/𝑠 (5-2)
Having (C0) as the velocity of the propagation of the sound through the air with
340,29 m/s, and the two temperatures (T and T0) in degrees Kelvin. In the tests
the temperature considered was (T) is 303,15 Kelvin and (T0) is 273,15 Kelvin.
The wave length (Lw) is the region that the pressure of the shock wave is higher
53
𝐿 = U ∗ 𝑡 = 1,00 𝑚 (5-3)
Expected behaviour of the models
In this section, the expected behaviour of the designed proposed system is analysed. The slab will be analysed taking into consideration that the bottom reinforcement is ϕ10//0,10. The tubes considered in this section will be one type of tube, steel S235, with two different diameters, 48,3 mm and 76,1 mm both with 2,6 mm of wall thickness.
5.2.1.
Dynamic materials behaviour
An explosion is a dynamic action, which means that the concrete resistance and the steel yielding stress need to be affected by a dynamic increment factor (DIF) and by a strength increment factor (SIF). According to UFC 3-340-02 [15] the DIF’s are 1,19 and 1,17 for the concrete and for the steel, respectively, and SIF is taken as 1,10 in the case of the steel (Table 5-1).
Table 5-1 - Dynamic increments
Material DIF SIF
Concrete 1,19 -
Steel 1,17 1,10
The characteristics of the concrete shown in section 4.5 need to be incremented by the dynamic factor as presented in Table 5-2.
Table 5-2 - Concrete characteristics
Material fcm (MPa) fcm,d (MPa) fctm (MPa) fctm,d (MPa)
54
For the reinforcement steel, tests were not done but the yielding stress (fym) was
considered to be 540 MPa. The value of fym and its dynamic value are shown in
Table 5-3.
Table 5-3 - Steel characteristics
Material fym (MPa) fym,d (MPa)
Steel A500NR 540 695
Regarding the tubes, the characteristics need to be incremented by the dynamic factors as well (Table 5-4).
Table 5-4 - Tubes dynamic characteristics
∅ (mm) fy (MPa) fy,d (MPa) ft (MPa) ft,d (MPa)
48,3 e 76,1 235 302,4 360 463,3
With the incremental factors applied the same type of analytical calculation made in section 3.6 need to be done (Fig. 5-1), but now with the dynamic factors applied to consider the dynamic effect of the blast (Table 5-5).
Table 5-5 - Tubes characteristics incremented
∅ (mm) My,d [kNm] Mp,d [kNm] kmax = Mp,d / My,d Pd (d=0) [kN]
48,3 51,1 117,5 2,30 11,58
55
Fig. 5-1 – Dynamic force-displacement for both tubes using expression (3-18)
With this it is possible to have the integration of the graphic in Fig. 5-1 and obtain the deformation energy/displacement for each tube, as presented in Fig. 5-2.
Fig. 5-2 – Energy deformation-displacement
0,00 50,00 100,00 150,00 200,00 250,00 300,00 350,00
0 10 20 30 40 50 60 70 80
P
(k
N)
d (mm)
48.3 mm 76.1 mm
0 500 1000 1500 2000 2500 3000 3500
0 10 20 30 40 50 60 70 80
W (k N. m m ) d (mm)
56
In this graphic the tube of 48,3 mm is more efficient than the 76,1 mm diameter for lower displacements.
5.2.2.
Plates and tubes on a rigid support
In this section it will be analysed how the tubes mitigate the energy of the explosion, without the deformation of the lower slab (Fig. 5-3), being the tubes the only energy dissipation system. The analysis will be done for plates on top of four tubes, with two different values of Z since the wave of the blast is not plane when it hits the model. Due to symmetry of the eight plates only two values of Z will be considered (Table 5-6).
Fig. 5-3 – Plates and tubes on a rigid support
Table 5-6 - Scaled distance on the two plates analysed
Plate nº Z (m/Kg1/3)
1 1,30
2 1,18
To know the displacement that the tubes would suffer with the blast it is essential to estimate the reflected impulse in the plate (5-4) and the kinetic energy from the Eq. (3-7) with the equivalent mass for the plate estimated from (5-5). Table 5-7 shows these parameters.
𝐼 = 𝑖 ∗ 𝐴 (5-4)
57
Table 5-7 – Calculated energy characteristics
Plate nº Ir(kNs) meq, (kNs2/m) T (kNmm)
1 0,321 0,114 451,7
2 0,353 0,114 548,2
Using the graphics from Fig. 5-2 it is possible to estimate the deformation the tubes need to dissipate the kinetic energy. The results are shown in Table 5-8 and it shows that the deformation of both tubes is reasonable, i.e., it is smaller than the interior diameter of each tube. For this displacement and from Fig. 5-1, it is possible to know the force needed to deform each tube, as shown in Table 5-8.
Table 5-8 – Deformation and force needed to dissipate the energy for each tube
∅ (mm) Plate nº W = T / 4 (kNmm) d (mm) Pd (kN)
48,3 1 112,9 8,55 14,91
2 137,1 10,14 15,55
76,1 1 113,9 15,16 8,49
2 137,1 17,94 8,88
It is also important to know the force that the four tubes apply per square meter on the lower slab, for this is necessary to multiply the force achieved in Table 5-8 by the number of tubes of each plate and divide it by the area of the plate, Eq. (5-6), the results can be seen in Table 5-9.
58
Table 5-9 – Force applied per square meter in the lower slab
∅ (mm) Plate nº pd (kN/m2) pdm (kN/m2)
48,3 1 91,8
93,7
2 95,7
76,1 1 52,3
53,5
2 54,7
5.2.3.
Reference slab with the designed reinforcement
The slab was designed with a reinforcement of ϕ10//0,10 (As = 7,85 cm2/m) and the system is designed to have a slab simply supported in two edges with 2,45 m of theoretical span.
The dynamic cracking moment may be estimated by ignoring the effect of the reinforcement in the slab by the following equation:
𝑚 , = 𝑓 , ∗ 𝑊 (5-7)
In this equation the fctm,d is given in Table 5.2 and Wc is the bending modulus of
the section, according to the following equations.
𝑊 =𝑏 ∗ ℎ6 (5-8)
From these expressions the dynamic cracking moment is 10,4 kNm/m. This moment corresponds to a distributed force equal to 13,9 kN/m2, calculated by:
𝑝 , =8 ∗ 𝑚𝑙 , (5-9)
The dynamic yielding moment of the slab may be estimated from the following expression.
𝑚 , = 𝐴 𝑓, 𝑏 𝑑 − 0,5 ∗𝑏 ∗ 𝑓𝐴 ∗ 𝑓, ,
59
This results on a dynamic yielding moment of 46,6 kNm/m. As the cracking moment is lower than the yield moment the slab would have a ductile behaviour and can mitigate more energy.
𝑝 , =8 ∗ 𝑚𝑙 , (5-11)
The force needed for the reinforced steel enters in plastic behaviour is 62,1 kN/m2.
To calculate the deformation of the reference slab it is needed to calculate the kinetic energy by the Eq. (3-7):
𝑇 =12 ∗𝑚𝐼
Where the equivalent mass (meq) is:
𝑚 = 𝐾 ∗ 𝑚 = 0,66 ∗ 2500 ∗ 10 ∗ 0,12 ∗ 2,45 ∗ 2 = 0,97 𝑘𝑁 ∗ 𝑠 /𝑚
Therefore, the kinetic energy of the slab is
𝑇 =12 ∗𝑚 =𝐼 12 ∗2,790,970 = 3,99 𝑘𝑁𝑚
It can be considered, for simplification purposes, that the slab has a perfect-plastic behaviour and the deformation energy can be:
W = 𝑚 , ∗ 𝜃 (5-12)
Where θ is the rotation of that the slab suffers in the plastic hinge at mid-span, obtained by:
60
Considering the principle of energy conservation, the maximum deformation can be calculated by:
𝑎 =4 ∗ 𝑚W ∗ 𝑙
, = 52 𝑚𝑚
(5-14)
5.2.4.
Slab behaviour with the mass of the plates
If we assume that the tubes are rigid, i.e., they do not dissipate any energy, the mass of the system is higher and the kinetic energy is smaller. In this case, the energy dissipated by the slab reinforcement is smaller, as well as the maximum displacement at mid span. The equivalent mass in this case is multiplied by a factor (KLm) to convert the properties of the real to the equivalent system, this
factor is the quotient between the mass factor and the charge factor, the used value for the plastic regime is 0,66. The values will then be the following:
𝑚 = 𝐾 ∗ 𝑚 = 0,66 ∗ 2500 ∗ 10 ∗ (0,12 + 0,07) ∗ 2,45 ∗ 2 = 1,54 [𝑘𝑁 ∗ 𝑠 ]
𝑇 =12 ∗𝑚 =𝐼 12 ∗2,791,54 = 2,51 𝑘𝑁𝑚
𝑎 =4 ∗ 𝑚𝑊 ∗ 𝑙
, = 33 𝑚𝑚
5.2.5.
Slab with the designed reinforcement protected by
dissipation system
61
The force in the tubes necessary to dissipate the blast energy was calculated in section 5.2.2, this value may be compared with the force needed to crack the slab and the force that will lead the reinforcement to yielding (Table 5-10) .
Table 5-10 – Comparison of the tube forces with the cracking and yielding slab forces
∅ (mm) pd (kN/m2) pcr,d (kN/m2) py,d (kN/m2)
48,3 93,7
13,88 81,76
76,1 53,5
The force that any of the tubes need to dissipate the energy of the blast is higher than the one needed to crack the slab. So, in any case, the slab will crack due to blast.
The yielding force of the slab is lower in the case of tubes with 48,3 mm diameter and is higher in the 76,1 mm. This means that in the case of the slab with the 76,1 mm diameter tubes the slab will crack but, after the blast these cracks close without plastification of the slab.
In the case of the tubes with 48,3 mm diameter the reinforcing steel will plastify, and the cracks will remain opened after blast. In this case, the problem is more complex because there are two systems dissipating energy (the tubes and the slab reinforcement) instead of only one. The quantification of the percentage of energy dissipated by each one of the systems is a more complex problem and is not in the scope of this work since the purpose is to reduce the damage in the slab, without plastification of the slab reinforcement, by energy dissipation of the tubes. This technique is named capacity design.
![Fig. 2-1 - Force in load cell and hammer decelerating force vs system: a) Five-layer aluminium; b) single mild-steel tube [2]](https://thumb-eu.123doks.com/thumbv2/123dok_br/16589492.738916/24.918.175.734.747.956/force-hammer-decelerating-force-layer-aluminium-single-steel.webp)
![Fig. 2-2 - High speed film of deformation of five-layer aluminium tube [2]](https://thumb-eu.123doks.com/thumbv2/123dok_br/16589492.738916/25.918.267.649.393.999/fig-high-speed-film-deformation-layer-aluminium-tube.webp)
![Fig. 2-3 - Sledge apparatus for high speed compression of ring systems [2]](https://thumb-eu.123doks.com/thumbv2/123dok_br/16589492.738916/26.918.164.757.180.461/fig-sledge-apparatus-high-speed-compression-ring-systems.webp)
![Fig. 2-4 - Non-dimensional quasi-static load-deflection curves for rings tested [2]](https://thumb-eu.123doks.com/thumbv2/123dok_br/16589492.738916/27.918.206.683.102.459/fig-dimensional-quasi-static-deflection-curves-rings-tested.webp)
![Fig. 2-9 - Material and geometry details of an empty metal beverage can [6]](https://thumb-eu.123doks.com/thumbv2/123dok_br/16589492.738916/31.918.213.706.406.598/fig-material-geometry-details-metal-beverage.webp)
![Fig. 2-10 - Global view of the large-scale experiment [6]](https://thumb-eu.123doks.com/thumbv2/123dok_br/16589492.738916/32.918.221.703.106.334/fig-global-view-large-scale-experiment.webp)
![Table 2-3 - Transient Finite Element Analysis Cases and Results [7]](https://thumb-eu.123doks.com/thumbv2/123dok_br/16589492.738916/36.918.193.728.138.1079/table-transient-finite-element-analysis-cases-results.webp)
![Fig. 2-18 - Stress-strain values used in the Multi-Linear Hardening Material Model [7]](https://thumb-eu.123doks.com/thumbv2/123dok_br/16589492.738916/38.918.241.647.433.683/stress-strain-values-multi-linear-hardening-material-model.webp)
![Fig. 2-19 - Force-Deformation Response of a Round HSS7x0.25 and Deformed Configuration at approximately 152 mm [7]](https://thumb-eu.123doks.com/thumbv2/123dok_br/16589492.738916/39.918.254.641.364.648/fig-force-deformation-response-round-deformed-configuration-approximately.webp)