Revista Brasileira de
Engenharia Agrícola e Ambiental
Campina Grande, PB, UAEA/UFCG – http://www.agriambi.com.br
v.21, n.8, p.524-529, 2017
Water productivity using SAFER - Simple Algorithm
for Evapotranspiration Retrieving in watershed
Daniel N. Coaguila
1, Fernando B. T. Hernandez
1, Antônio H. de C. Teixeira
2,
Renato A. M. Franco
1& Janice F. Leivas
2DOI: http://dx.doi.org/10.1590/1807-1929/agriambi.v21n8p524-529
A B S T R A C T
The Cabeceira Comprida stream’s watershed, located in Santa Fé do Sul, São Paulo state, has great environmental importance. It is essential for supplying water to the population and generating surpluses for sewage dilution. This study aimed to evaluate the annual performance of the components of water productivity from Landsat-8 images of 2015, using the Simple Algorithm for Evapotranspiration Retrieving (SAFER), calculating the actual evapotranspiration (ETa), biomass (BIO) and water productivity (WP). The annual averages of ETa, BIO and WP were 1.03 mm day-1, 36.04 kg ha-1 day-1 and 3.19 kg m-3, respectively. The average annual values of ETa for land use and occupation were 1.40, 1.23, 1.05, 0.97 and 1.08 mm day-1 for the remaining forest (RF), invasive species (IS), pasture (Pa), annual crop (AC) and perennial crop (PC), respectively, with BIO of 57.64, 46.10, 36.78, 32.69, 40.03 kg ha-1 day-1 for RF, IS, Pa, AC and PC, respectively, resulting in WP of 3.94, 3.59, 3.25, 3.09, 3.35 kg m-3 for RF, IS, Pa, AC and PC, respectively. The ETa, BIO and WP adjust to the seasonality of the region, and RF and IS stood out with the highest values.
Produtividade da água estimada pelo SAFER - Simple
Algorithm for Evapotranspiration Retrieving
em bacia hidrográfica
R E S U M O
A Bacia Hidrográfica do Córrego Cabeceira Comprida localizada no município de Santa Fé do Sul-SP, tem grande importância ambiental, sendo imprescindível para o abastecimento de água à população e para gerar excedentes para a diluição do esgoto gerado. Assim, este trabalho avaliou o comportamento anual dos componentes da produtividade da água a partir de imagens do Landsat-8 do ano 2015, utilizando-se o ‘Simple Algorithm for Evapotranspiration Retrieving’ (SAFER), sendo calculadas a evapotranspiração atual (ETa), a biomassa (BIO) e a produtividade da água (PA). As médias anuais da ETa, BIO e PA foram 1,03 mm dia-1, 36,04 kg ha-1 dia-1 e 3,19 kg m-3, respectivamente. As ETa médias anuais por uso e ocupação do solo foram 1,40, 1,23, 1,05, 0,97 e 1,08 mm dia-1 para mata remanescente (MR), espécies invasoras (EI), pastagem (Pa), cultura anual (CA) e cultura perene (CP), respectivamente, enquanto que as BIO apresentaram 57,64, 46,10, 36,78, 32,69, 40,03 kg ha-1 dia-1 para MR, EI, Pa, CA e CP, respectivamente, resultando em uma PA de 3,94, 3,59, 3,25, 3,09, 3,35 kg m-3 para MR, EI, Pa, CA e CP, respectivamente. As ETa, BIO e PA se ajustam à sazonalidade climática da região destacando-se a MR e as EI com os maiores valores.
Key words:
biomass
evapotranspiration remote sensing
Typha
Palavras-chave:
biomassa
evapotranspiração sensoriamento remoto
Typha
1 Universidade Estadual Paulista/Faculdade de Engenharia de Ilha Solteira/Departamento de Fitossanidade, Engenharia Rural e Solos. Ilha Solteira, SP.
E-mail: [email protected] (Corresponding author); [email protected]; [email protected]
2 Embrapa Monitoramento por Satélite. Campinas, SP. E-mail: [email protected]; [email protected]
Introduction
Water management must promote its multiple use, such as the supply of cities, dilution of effluents, animal watering, among others (Machado et al., 2011). Measuring water consumption in agriculture (evapotranspiration), in a spatial-temporal scale for watershed, improves the management of water resources. In a watershed, there is interaction between natural, social, biotic and abiotic factors, involved in a network of relationships (Machado et al., 2011), which are in dynamic equilibrium (Erol & Randhir, 2012), when not disturbed.
The Northwest region of São Paulo has predominance of livestock farming (IBGE, 2016), the highest evapotranspiration rates of the state, with water deficit for up to eight months in the year (Santos et al., 2010) and also frequent dry spells that pose risk to the performance of agriculture (Hernandez et al., 2003).
In watersheds, with the conflicting use of water, it is important to determine crop evapotranspiration (Bezerra et al., 2012), biomass and water productivity, which are difficult to be estimated in large scale (Su et al., 2009). Remote sensing techniques allow the generation of temporal series for agricultural planning (Bastiaanssen, 2000), management and evaluation of the water resources.
The Simple Algorithm for Evapotranspiration Retrieving (SAFER), which presents itself as a tool for the management of water resources, is based on the modeling of the ETa/ET0 ratio (Teixeira et al., 2015a) and has been adjusted to the Northwest region of São Paulo (Hernandez et al., 2014) and calibrated for other regions (Teixeira et al., 2015c).
The present study aimed to evaluate actual evapotrans-piration, biomass and water productivity through the SAFER model using Landsat-8 images, in the Cabeceira Comprida stream’s watershed, in Santa Fé do Sul, SP.
Material and Methods
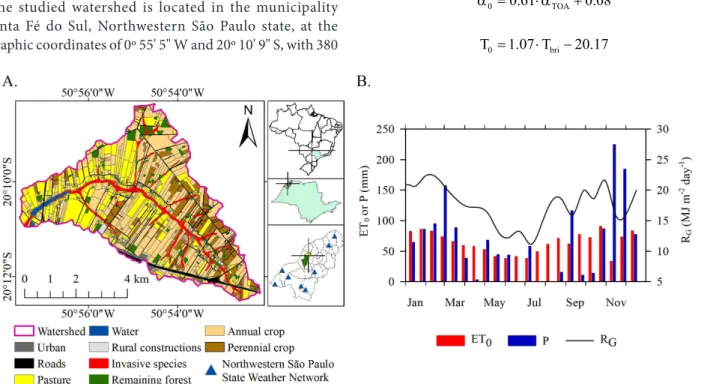
The studied watershed is located in the municipality of Santa Fé do Sul, Northwestern São Paulo state, at the geographic coordinates of 0º 55' 5" W and 20º 10' 9" S, with 380
m of altitude (Figure 1A), and its area is occupied by 143, 149, 1005, 1271 and 454 hectares of remaining forest (RF), invasive species (IS), pasture (Pa), annual crop (AC) and perennial crop (PC), respectively, under humid tropical climate with dry winter, Aw, according to Köppen’s classification.
The utilized data of the Northwestern São Paulo State Weather Network (http://clima.feis.unesp.br, Figure 1A) are composed of global radiation (RG, MJ m
-2 day-1),
reference evapotranspiration (ET0, mm day-1) and mean daily
temperature (Ta, °C), spatialized through the inverse distance weighting (IDW).
The images were obtained from the USGS website (http:// earthexplorer.usgs.gov), of the Landsat 8 platform (OLI and TIRS), orbit 22 and point 74, of the year 2015, with the first image in January 2015, following the sequential day of the year (SDY) with temporal scale of 16 days. Cloud-free images were used and processed in the software ArcMap™ 10.0 of the ESRI in the Model Builder mode. In case of clouds, the series was filled with the mean of the images available close to the lacking date in a set with grids of Ta, RG and ET0 of the specific lacking dates.
Radiometric correction (radiance and reflectance) of the images was performed according to the methodology of Teixeira et al. (2015b) and the broadband planetary albedo on top of the atmosphere (αTOA) was calculated using the
methodology of Teixeira et al. (2015a), while the brightness temperature of the sensor (Tbri) was obtained through the
methodology of Teixeira et al. (2015b). The normalized difference vegetation index (NDVI) was calculated through the ratio of the difference between the planetary reflectivities of the near infrared (ρnir) and red (ρred) and their sum.
The data of αTOA and Tbri were atmospherically corrected to obtain the values of albedo (α0) and surface temperature (T0,
K), according to Teixeira et al. (2015b):
Figure 1. Land use and occupation in the Cabeceira Comprida stream’s watershed (A), Means (every 16 days) of global radiation - RG and totals of pluviometric precipitation - P and reference evapotranspiration - ET0, during the year 2015 (B)
0 0.61 TOA 0.08
α = ⋅α +
0 bri
T =1.07 T⋅ −20.17
(1)
The ratio between actual evapotranspiration and reference evapotranspiration (ETa/ET0)SAFER was calculated according to
Eq. 3 (Hernandez et al., 2014; Teixeira, 2010; Teixeira et al., 2015c):
Biomass (BIO, kg ha-1 day-1) is the dry matter production
per area unit over time and was calculated using the radiation model of Monteith (Teixeira et al., 2015b):
a 0
0 SAFER 0
ET T
exp 1.0 0.008
ET NDVI
= +
α
Actual evapotranspiration (ETa, mm day-1) was obtained
according to Teixeira et al. (2015c):
a
a 0
0 SAFER
ET ET ET
ET
=
The concept of equilibrium evapotranspiration (Raupach, 2001) was used in Eq. 4, when NDVI < 0, transforming the energy units to mm day-1 (Teixeira et al., 2015c):
(
Rn G)
E ∆ −
λ =
∆ + γ
where:
Δ - slope of the water vapor saturation curve, kPa °C-1;
Rn - net radiation, MJ m -2 day-1;
G - heat flow in the soil, MJ m-2 day-1; and,
γ - psychrometric constant, kPa °C-1.
Net radiation (Rn) was obtained by the Slob’s equation
(Bruin & Stricker, 2000; Teixeira et al., 2015a):
(
)
n 24 G L sw
R = − α1 R − τa
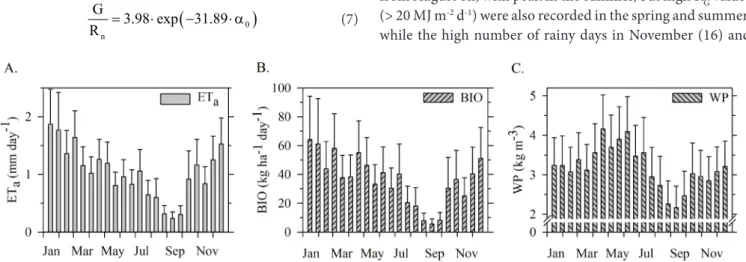
Figure 2. Mean values of actual evapotranspiration - ETa (A), biomass - BIO (B) and water productivity - WP (C) in the Cabeceira Comprida stream’s watershed, calculated using the SAFER model
where:
α24 - surface albedo of 24 h;
aL - regression coefficient of the net longwave radiation;
and,
τsw - atmospheric transmissivity (Bruin & Stricker, 2000).
Heat flow in the soil (G) was estimated through its relationship with the net radiation (Rn) (Teixeira et al., 2015c):
(
0)
n
G
3.98 exp 31.89
R = ⋅ − ⋅α
max f
BIO= ε E APAR 0.864⋅
where:
εmax - maximum efficiency in the use of radiation (Bastiaanssen & Ali, 2003);
Ef - Evaporative fraction (Teixeira et al., 2015b); and,
APAR - absorbed photosynthetically active radiation (W m-2).
APAR was directly approximated as a fraction of the photosynthetically active radiation (PAR) depending on the NDVI and PAR, as a fraction of the RG (Teixeira et al., 2015a):
(
) (
G)
APAR= 1.26 NDVI 0.16⋅ − ⋅ 0.44 R⋅
Water productivity (WP, kg m-3) refers to the amount of
biomass that can be produced per 1 m3 of water and provides
information on the water use efficiency by plants (Teixeira et al., 2015b), calculated as:
a
BIO PA
ET
=
Results and Discussion
The results of highest and lowest mean ETa in the
watershed were 1.87 and 0.23 mm day-1 on the SDY 15 and
255, respectively (Figure 2A), corresponding to the climatic behavior of the region, rainy summer and dry winter. The evapotranspiration amplitude of 1.64 mm day-1 (difference
between the highest and lowest ETa), despite the predominance of annual crops, confirms the high heterogeneity of the system regarding land use and dependence on the rainfall regime for the economic development of the watershed, and results close to the values in the dry season were reported in Northwestern São Paulo by Coaguila et al. (2015).
The typical expected behavior of RG is an increasing curve
from August on, with peak in the summer, but high RG values (> 20 MJ m-2 d-1) were also recorded in the spring and summer,
while the high number of rainy days in November (16) and (3)
(4)
(5)
(6)
(7)
(8)
(9)
December (18) resulted in means lower than expected for RG and, consequently, for ETa (Figures 1B and 2A).
On the other hand, the rainfalls resulted in storage and availability of water to plants and these rainfalls above 50 mm every 16 days were recorded in all seasons of the year (Figure 1B), related in general to the greater volumes of ETa in the summer and smaller in the winter, when RG availability
is sufficient to increase the ETa volumes. However, it does not occur due to the water deficit characteristic of the season (Santos et al., 2010; IBGE, 2016), except the area occupied by the IS - in the riparian zone - since rainfall and RG control the
ETa, as reported by Scott et al. (2000), requiring both climatic
variables to occur concomitantly (Figure 2A).
The IS (Typha sp. as dominant) in the humid period evapotranspired 82-89% (in relation to the RF) and 91-97% in the dry season, consuming the same water that could support the RF, agricultural activities or the population of Santa Fé do Sul, because the priority in water use culminates in human consumption and animal watering (Machado et al., 2011).
The ISs, predominantly represented by Typha sp., are aggregated as a species that indicates degraded environments and do not offer any benefit to the local ecosystems (Linz & Homan, 2011), being a consequence of erosion processes and thalweg silting. However, they fulfill their hydrological function and, for being large water consumers, compete with the storage necessary in the dams that must supply the population of Santa Fé do Sul. In addition, they produce surpluses to dilute the effluent of the Sewage Treatment Station disposed in the Mula stream, into which the Cabeceira Comprida stream flows.
Evapotranspiration values of 1.2 mm day-1 were described
by Anda et al. (2015) and Coaguila et al. (2015), corroborating the values of mean annual ETa of the IS of 1.23 mm day
-1 in the
studied watershed (Table 1).
The ETa of Pa, AC and PC was equal to 61-80, 55-76 and 71-82%, respectively, in relation to RF, in the dry season, atypically
increasing the values due to the unexpected rainfall and that, along the dry period, maintained its typical behavior, with increasing water deficit and decrease of ETa, thus entering the spring with water deficit in the soil and values of 59-78, 51-74 and 70-76% for Pa, AC and PC, respectively, in relation to the mean of the RF. In the rainy period, values of 72-80, 68-72 and 76-79% were reached by Pa, AC and PC, respectively, favored by the rainfall and high RG values characteristic of the period (Figure 1B).
It should be pointed out the water availability in the soil directly influenced the amount of energy used, when available in the evapotranspiration processes; therefore, the mean volume of evapotranspired water in the Cabeceira Comprida stream’s watershed in 2015 was 33,020 m3 day-1, formed by
5.5% from IS, 6.1% from RF, 32.0% from Pa, 38.0% from AC and 14.8% from PC, leaving 3.6% for the other uses. Thus, the water used by IS corresponds to the consumption of 30% of the population of Santa Fé do Sul and, considering a mean water consumption of 189 L day-1 per person and the 31,348
inhabitants estimated for 2015 (IBGE, 2016; SNIS, 2016), the municipality consumes 5,925 m3 d-1.
The highest and lowest mean BIO are distributed in the summer (64.21 kg ha-1 day-1, SDY 15) and winter (5.50 kg ha-1
day-1, SDY 255), respectively (Figure 2B) and correspond to
the climatic seasonality and high heterogeneity of the region (Santos et al., 2010; IBGE, 2016), a prove of that is the BIO annual amplitude of 58.71 kg ha-1 day-1. Mean values of 9.17
and 10.98 kg ha-1 day-1 were recorded during the dry period
in the years 2013 and 2014 in the Mula stream’s watershed, by Coaguila et al. (2015), also in Santa Fé do Sul.
BIO is dependent on RG (Teixeira et al., 2015b), local
vegetation and water available in the soil (Scott et al., 2000), and its value decreased from June to August, due to the dry conditions and low levels of RG (Figure 1B), which is related
to the water stress in the soil and weather conditions of the
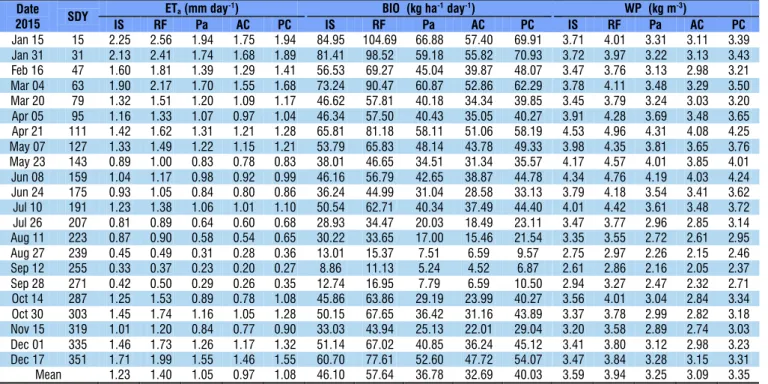
IS - Invasive species; RF - Remaining forest; Pa - Pasture; AC - Annual crop; PC - Perennial crop; SDY - Sequential day of the year
Date
2015 SDY
ETa(mm day-1) BIO (kg ha-1day-1) WP (kg m-3)
IS RF Pa AC PC IS RF Pa AC PC IS RF Pa AC PC
Jan 15 15 2.25 2.56 1.94 1.75 1.94 84.95 104.69 66.88 57.40 69.91 3.71 4.01 3.31 3.11 3.39
Jan 31 31 2.13 2.41 1.74 1.68 1.89 81.41 98.52 59.18 55.82 70.93 3.72 3.97 3.22 3.13 3.43
Feb 16 47 1.60 1.81 1.39 1.29 1.41 56.53 69.27 45.04 39.87 48.07 3.47 3.76 3.13 2.98 3.21
Mar 04 63 1.90 2.17 1.70 1.55 1.68 73.24 90.47 60.87 52.86 62.29 3.78 4.11 3.48 3.29 3.50
Mar 20 79 1.32 1.51 1.20 1.09 1.17 46.62 57.81 40.18 34.34 39.85 3.45 3.79 3.24 3.03 3.20
Apr 05 95 1.16 1.33 1.07 0.97 1.04 46.34 57.50 40.43 35.05 40.27 3.91 4.28 3.69 3.48 3.65
Apr 21 111 1.42 1.62 1.31 1.21 1.28 65.81 81.18 58.11 51.06 58.19 4.53 4.96 4.31 4.08 4.25
May 07 127 1.33 1.49 1.22 1.15 1.21 53.79 65.83 48.14 43.78 49.33 3.98 4.35 3.81 3.65 3.76
May 23 143 0.89 1.00 0.83 0.78 0.83 38.01 46.65 34.51 31.34 35.57 4.17 4.57 4.01 3.85 4.01
Jun 08 159 1.04 1.17 0.98 0.92 0.99 46.16 56.79 42.65 38.87 44.78 4.34 4.76 4.19 4.03 4.24
Jun 24 175 0.93 1.05 0.84 0.80 0.86 36.24 44.99 31.04 28.58 33.13 3.79 4.18 3.54 3.41 3.62
Jul 10 191 1.23 1.38 1.06 1.01 1.10 50.54 62.71 40.34 37.49 44.40 4.01 4.42 3.61 3.48 3.72
Jul 26 207 0.81 0.89 0.64 0.60 0.68 28.93 34.47 20.03 18.49 23.11 3.47 3.77 2.96 2.85 3.14
Aug 11 223 0.87 0.90 0.58 0.54 0.65 30.22 33.65 17.00 15.46 21.54 3.35 3.55 2.72 2.61 2.95
Aug 27 239 0.45 0.49 0.31 0.28 0.36 13.01 15.37 7.51 6.59 9.57 2.75 2.97 2.26 2.15 2.46
Sep 12 255 0.33 0.37 0.23 0.20 0.27 8.86 11.13 5.24 4.52 6.87 2.61 2.86 2.16 2.05 2.37
Sep 28 271 0.42 0.50 0.29 0.26 0.35 12.74 16.95 7.79 6.59 10.50 2.94 3.27 2.47 2.32 2.71
Oct 14 287 1.25 1.53 0.89 0.78 1.08 45.86 63.86 29.19 23.99 40.27 3.56 4.01 3.04 2.84 3.34
Oct 30 303 1.45 1.74 1.16 1.05 1.28 50.15 67.65 36.42 31.16 43.89 3.37 3.78 2.99 2.82 3.18
Nov 15 319 1.01 1.20 0.84 0.77 0.90 33.03 43.94 25.13 22.01 29.04 3.20 3.58 2.89 2.74 3.03
Dec 01 335 1.46 1.73 1.26 1.17 1.32 51.14 67.02 40.85 36.24 45.12 3.41 3.80 3.12 2.98 3.23
Dec 17 351 1.71 1.99 1.55 1.46 1.55 60.70 77.61 52.60 47.72 54.07 3.47 3.84 3.28 3.15 3.31
Mean 1.23 1.40 1.05 0.97 1.08 46.10 57.64 36.78 32.69 40.03 3.59 3.94 3.25 3.09 3.35
region (Santos et al., 2010), resulting in lower production of vegetal biomass (Li et al., 2011).
The highest means of BIO occurred on the SDY 15, with 84.95, 104.69, 66.88 and 57.24 kg ha-1 day-1 for IS, RF, Pa and
AC, respectively, and 70.93 kg ha-1 day-1 on SDY 31 for PC;
however, the lowest BIO means were 8.86, 11.13, 5.24, 4.52 and 6.87 kg ha-1 day-1 for IS, RF, Pa, AC and PC, respectively,
on SDY 255 (Table 1), both with highest and lowest BIO, in the humid and dry seasons, respectively.
In the summer, with high values of RG and rainfall, the IS
produced 81-83% of BIO in relation to RF, while in the dry period it remained in 80-84%, for occupying the riparian zone (Bove, 2016), suffering minimum water stress, representing 5.9% of the approximately 115,533 kg day-1 produced by the
watershed.
Land uses and occupations of the Pa, AC and PC, in relation to RF, showed BIO of 64-75, 55-68 and 69-72%, respectively, during the period of rainfalls and highest RG of the year, which favored BIO production, while in the dry period, with lower values of RG, there were lower values of BIO, 47-69, 41-64 and 62-74% for Pa, AC and PC (Figure 1B, Table 1), resulting in the mean of approximately 32% for Pa, 36% for AC and 16% for PC of the 115,533 kg day-1, on average, produced by the watershed.
The highest and lowest mean of WP occurred in the autumn (4.16 kg m-3, SDY 111) and winter (2.17 kg m-3, SDY
255) (Figure 2C), similar to ETa and BIO, distributed in the rainy and dry periods with annual amplitude of 1.99 kg m-3,
and again confirm the high heterogeneity of the watershed, corroborating Coaguila et al. (2015), who observed mean WP values of 1.73-3.75 kg m-3 in the Mula stream’s watershed.
The high WP of the IS (Table 1) is explained by the fact that these species benefit from the continuous flow of water, since they are installed in the silted riparian zone (Bove, 2016), with adequate conditions for proliferation, and varied from 89 to 94% along the year, in relation to RF, showing the lowest variations of the year, along with the PC but, different from the IS, benefit from the deep root system, which allows the access to the water in the soil profile.
Table 1 highlights, per land use and occupation, the highest mean WP on SDY 111 (autumn) with 4.53, 4.96, 4.31, 4.08 and 4.25 kg m-3 for IS, RF, Pa, AC and PC, respectively, and
the lowest WP on SDY 255 (winter) with 2.61, 2.86, 2.16, 2.05 and 2.37 kg m-3 for IS, RF, Pa, AC and PC, respectively. Values
close to those of the dry and humid periods were reported by Coaguila et al. (2015) and Teixeira et al. (2015a).
Pa, AC and PC showed values of 81-88, 78-85 and 85-89% in relation to the RF, respectively, in the rainy period, whose conditions were favorable to vegetation development and WP. In the dry period, Pa, AC and PC showed values of 76-85, 71-82 and 83-87%, respectively.
Conclusions
1. The temporal variability of ETa, BIO and WP adjusts to
the climatic seasonality of the region, especially to the rainfall and radiation available in the studied area.
2. The highest ETa, BIO and WP, in a decreasing order, are
relative the use and occupation by remaining forest, invasive species, perennial crops, pasture and annual crops.
3. The invasive species present in the riparian zone suffer minimum water stress during the dry period and have direct impact on the water supply in the watershed.
4. The model SAFER - Simple Algorithm for Evapotrans-piration Retrieving - proved to be adequate to quantify water productivity components by different land uses in a watershed.
Acknowledgments
To the PAEDEx of UNESP and AUIP/Capes (Process 2012), FAPESP (Process 2.009/52.467-4) and CNPq (Process 404.229/2013-1).
Literature Cited
Anda, A.; Soos, G.; Silva, J. A. T. da; Kozma-Bognar, V. Regional evapotranspiration from a wetland in central Europe, in a 16-year period without human intervention. Agricultural and Forest Meteorology, v.205, p.60-72, 2015. https://doi.org/10.1016/j. agrformet.2015.02.010
Bastiaanssen, W. G. M. SEBAL-based sensible and latent heat fluxes in the irrigated Gediz basin, Turkey. Journal of Hydrology, v.229, p.87-100, 2000. https://doi.org/10.1016/S0022-1694(99)00202-4 Bastiaanssen, W. G. M.; Ali, S. A new crop yield forecasting model
based on satellite measurements applied across the Indus basin, Pakistan. Agriculture, Ecosystems & Environment, v.94, p.321-340, 2003. https://doi.org/10.1016/S0167-8809(02)00034-8 Bezerra, M. V. C.; Silva, B. B. da; Bezerra, B. G.; Borges, V. P.; Oliveira,
A. S. de. Evapotranspiração e coeficiente de cultura do algodoeiro irrigado a partir de imagens de sensores orbitais. Revista Ciência Agronômica, v.43, p.64-71, 2012. https://doi.org/10.1590/S1806-66902012000100008
Bove, C. P. Typhaceae in lista de espécies da Flora do Brasil - Jardim Botânico do Rio de Janeiro. Disponível em: <http:// reflora.jbrj.gov.br/jabot/floradobrasil/FB15033> Acessado em: 16 Mai. 2016.
Bruin, H. A. R. de; Stricker, J. N. M. Evaporation of grass under non-restricted soil moisture conditions. Hydrological Sciences Journal, v.45, p.391-406, 2000. https://doi.org/10.1080/02626660009492337 Coaguila, D.; Hernandez, F. B. T.; Teixeira, A. H. de C. Estacionalidade da evapotranspiração e produtividade da água na microbacia do córrego da mula em Santa Fé do Sul-SP. Revista Brasileira de Agricultura Irrigada, v.9, p.232-238, 2015. https://doi.org/10.7127/ rbai.v9n400307
Erol, A.; Randhir, T. O. Climatic change impacts on the ecohydrology of Mediterranean watersheds. Climatic Change, v.114, p.319-341, 2012. https://doi.org/10.1007/s10584-012-0406-8
Hernandez, F. B. T.; Neale, C. M. U.; Teixeira, A. H. de C.; Taghvaeian, S. Determining large scale actual evapotranspiration using agro-meteorological and remote sensing data in the northwest of São Paulo state, Brazil. Acta Horticulturae, v.1038, p.263-270, 2014. https://doi.org/10.17660/ActaHortic.2014.1038.31
IBGE - Instituto Brasileiro de Geografia e Estatística. Cidades@. 2016. Disponível em: <http://cod.ibge.gov.br/493> Acessado em: 30 Mai. 2016.
Li, H. L.; Luo, Y.; Ma, J. H. Radiation-use efficiency and the harvest index of winter wheat at different nitrogen levels and their relationships to canopy spectral reflectance. Crop and Pasture Science, v.62, p.208-217, 2011. https://doi.org/10.1071/CP10315 Linz, G. M.; Homan, H. J. Use of glyphosate for managing invasive
cattail (Typha spp.) to disperse blackbird (Icteridae) roosts. Crop Protection, v.30, p.98-104, 2011. https://doi.org/10.1016/j. cropro.2010.10.003
Machado, A. T. da M.; Vieira, D. C.; Procópio, J. de C.; Polignano, M. V. Bacia hidrográfica como instrumento pedagógico para a transversalidade. Belo Horizonte: Instituto Guaicuy, 2011. 96p. Raupach, M. R. Combination theory and equilibrium evaporation.
Quarterly Journal of the Royal Meteorological Society, v.127, p.1149-1181, 2001. https://doi.org/10.1002/qj.49712757402 Santos, G. O.; Hernandez, F. B. T.; Rossetti, J. C. Balanço hídrico
como ferramenta ao planejamento agropecuário para a região de Marinópolis, noroeste do estado de São Paulo. Revista Brasileira de Agricultura Irrigada, v.4, p.142-149, 2010. https:// doi.org/10.7127/rbai.v4n300010
Scott, D. F.; Prinsloo, F. W.; Moses, G.; Mehlomakulu, M.; Simmers, A. D. A. A re-analysis of the South African catchment afforestation experimental data. WRC report 810/1/00. Pretoria: Water Research Commission, 2000. 138p.
SNIS - Sistema Nacional de Informações sobre Saneamento. Ministério das Cidades. 2016. Disponível em: <http://app.cidades. gov.br/serieHistorica> Acessado em: 15 Mar. 2016.
Su, H.; McCabe, M. F.; Wood, E. F.; Su, Z.; Prueger, J. H. Modeling evapotranspiration during SMACEX: C omparing two approaches for local and regional scale prediction. Journal of Hydrometeorology, v.6, p.1-13, 2009.
Teixeira, A. H. de C. Determining regional actual evapotranspiration of irrigated crops and natural vegetation in the São Francisco river basin (Brazil) using remote sensing and Penman-Monteith equation. Remote Sensing, v.2, p.1287-1319, 2010. https://doi. org/10.3390/rs0251287
Teixeira, A. H. de C.; Leivas, J. F.; Andrade, R. G.; Hernandez, F. B. T. Water productivity assessments with Landsat 8 images in the Nilo Coelho irrigation scheme. Irriga, edição especial, p.1-10, 2015a. Teixeira, A. H. de C.; Leivas, J. F.; Andrade, R. G.; Hernandez, F.
B. T.; Franco, R. F. Modelling radiation and energy balances with Landsat 8 images under different thermohydrological conditions in the Brazilian semi-arid region. In: Remote Sensing for Agriculture, Ecosystems, and Hydrology, 17, 2015, Toulouse. Anais...SPIE, 2015b.