www.ccarevista.ufc.br ISSN 1806-6690
Satellite-based ET estimation using Landsat 8 images and SEBAL
model
1Estimativa da evapotranspiração real por satélite utilizando imagens Landsat 8 e
modelo SEBAL
Bruno Bonemberger da Silva2*, Erivelto Mercante3, Marcio Antonio Vilas Boas3, Suzana Costa Wrublack4 and
Lucas Volochen Oldoni5
ABSTRACT - Estimation of evapotranspiration is a key factor to achieve sustainable water management in irrigated agriculture because it represents water use of crops. Satellite-based estimations provide advantages compared to direct methods as lysimeters especially when the objective is to calculate evapotranspiration at a regional scale. The present study aimed to estimate the actual evapotranspiration (ET) at a regional scale, using Landsat 8 - OLI/TIRS images and complementary data collected from a weather station. SEBAL model was used in South-West Paraná, region composed of irrigated and dry agricultural areas, native vegetation and urban areas. Five Landsat 8 images, row 223 and path 78, DOY 336/2013, 19/2014, 35/2014, 131/2014 and 195/2014 were used, from which ET at daily scale was estimated as a residual of the surface energy balance to produce ET maps. The steps for obtain ET using SEBAL include radiometric calibration, calculation of the reflectance, surface albedo, vegetation indexes (NDVI, SAVI and LAI) and emissivity. These parameters were obtained based on the reflective bands of the orbital sensor with temperature surface estimated from thermal band. The estimated ET values in agricultural areas, native vegetation and urban areas using SEBAL algorithm were compatible with those shown in the literature and ET errors between the ET estimates from SEBAL model and Penman Monteith FAO 56 equation were less than or equal to 1.00 mm day-1.
Key words: Water management. Land cover. Energy balance.
RESUMO - A Estimativa da evapotranspiração é um fator chave para alcançar uma gestão sustentável da água na agricultura irrigada, pois representa o uso consuntivo da água dos cultivos agrícolas. Estimativas baseadas em imagens de satélite oferecem vantagens em comparação aos métodos diretos como lisímetros, especialmente quando o objetivo é calcular a evapotranspiração em escala regional. O presente estudo teve como objetivo estimar a evapotranspiração real (ETr) em escala regional, utilizando imagens Landsat 8 - OLI/TIRS e dados complementares coletados de estação meteorológica. O modelo SEBAL foi aplicado no Sudoeste do Paraná, região composta por áreas agrícolas irrigadas e sequeiro, vegetação nativa e áreas urbanas. Cinco imagens Landsat 8, órbita/ponto 223/78, dia do ano 336/2013, 19/2014, 35/2014, 131/2014 e 195/2014, foram utilizadas a partir da qual a ETr em escala diária foi estimada como parte residual do balanço de energia de superfície para produzir mapas de ETr. Os procedimentos para obter ETr usando SEBAL incluem calibração radiométrica, cálculo da refletância, albedo da superfície, índices de vegetação (NDVI, SAVI e IAF) e emissividade. Estes parâmetros foram obtidos com base nas bandas reflectivas do sensor orbital com a superfície temperatura estimada utilizando a banda térmica. Os valores de ETr estimados em áreas agrícolas, vegetação nativa e áreas urbanas utilizando o algoritmo SEBAL foram compatíveis com os apresentados na literatura e o erro entre evapotranspiração estimada com o SEBAL e a equação de Penman Monteith FAO 56 foram inferiores ou iguais a 1,00 mm dia- 1.
Palavras-chave: Gestão dos recursos hídricos. Cobertura do solo. Balanço de energia. DOI: 10.5935/1806-6690.20180025
*Author for correspondence
Received for publication on 06/05/2016; approved 23/05/2017
1Parte da Dissertação do primeiro autor, apresentado ao Curso de Pós-Graduação em Engenharia Agrícola da Universidade Estadual do Oeste do
Paraná/UNIOESTE
2Programa de Pós-Graduação em Engenharia Agrícola, Universidade Estadual do Oeste do Paraná/Unioeste, Cascavel-PR, Brasil, [email protected] 3Departamento de Engenharia Agrícola, Universidade Estadual do Oeste do Paraná, Cascavel-PR, Brasil, [email protected], vilasboas@
unioeste.br
4Engenheira agrônomo, Universidade Estadual do Oeste do Paraná, Cascavel-PR, Brasil, [email protected]
INTRODUCTION
Effective water resources management has social and environmental importance and natural resources sustainability in a watershed may be compromised in its absence. Monitoring the most important components of the hydrological cycle, especially evapotranspiration since it represents water loss from surface to atmosphere, is vital to effect measures for water management (OLIVEIRAet al., 2014).
The determination of the consumptive use of water by crops is elementary in irrigations systems, water loss calculations in reservoirs and water balance, water productivity, hydrological and climate modeling at regional
and local scale (ELHAG et al., 2011; IMMERZEEL;
GAUR; ZWART, 2008; LIMAet al., 2014;
MARTÍNEZ-GRANADOSet al., 2011; YANGet al., 2015).
The water use of crops can be measured from installation of hydrometers each irrigated field. However, high cost and low operability make this measure a cumbersome operational application. In this context, remote sensing becomes a low cost alternative and with a large a real coverage to obtain the actual evapotranspiration (ET) (SILVAet al., 2012).
Several techniques have been developed in order to more precisely estimate ET using satellite images (ALLENet al., 2007; TEIXEIRAet al., 2008), however
Surface Energy Balance Algorithm for Land (SEBAL) - (BASTIAANSSEN et al., 1998) is the most promising
because the model estimates ET at regional scale using a small amount of ground-based weather data and also does not require a crop classification map (BASHIRet al.,
2008).
Evapotranspiration estimation based on the SEBAL model is obtained as a residual of the surface energy balance and researches have confirmed the robustness of the SEBAL comparing experimental results with the measured fluxes (SUN et al., 2011) or using
weather station data applying FAO-Penman-Monteith
equation (MACHADO et al., 2014). Mutiga, Su and
Woldai (2010) compared ET estimated from SEBAL with ET calculated from water balance and found good correlation of about 70% was observed.
Most papers that use SEBAL, applied the model to assess the spatio-temporal distribution of ET using different satellite sensors such as Landsat 5 – TM (MENEZES
et al., 2011), Landsat7 ETM+ and MODIS (HONG;
HENDRICKX; BORCHERS, 2009).However, only a few
papers deal with ET estimation using Landsat 8 which
was launched in Feb of 2013 (SEMMENS et al., 2015;
SENAYet al., 2015), and specific water consumption of
vegetation areas such as agricultural and forests, often is not determined.
The purpose of this study was: (1) estimate and evaluate actual evapotranspiration (ET) obtained from SEBAL using Landsat 8 images in agricultural areas, native vegetation and urban areas (2) validate the SEBAL algorithm results comparing with crop evapotranspiration (ETc) estimated by FAO-Penman-Monteith equation from a pasture and soybeans areas. The findings from this research will provide useful information for agricultural water management and these maps are input data for water balance methods.
MATERIAL AND METHODS
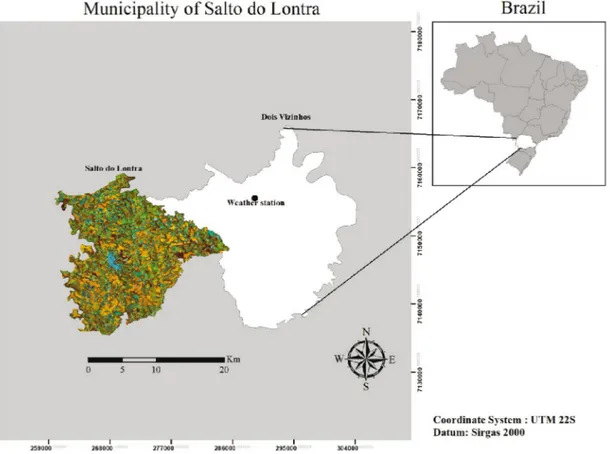
This study was carried out in the municipality of Salto do Lontra, located in the Southwest region of the State of Parana, Brazil (Figure 1). Its UTM coordinates are 7,143,050 meters N and 268,163 meters E, Zone 22S, total area of about 312.20 Km² and altitude of 620 m. Areas in the municipality are mainly composed with small farms intended for livestock and agriculture, which corresponds to approximately 63% of the total municipal area (WRUBLACK; MERCANTE; VILAS BOAS, 2013).
Five different Landsat 8 images, row 223 and path 78, acquired on day of the year (DOY)/YEAR 336/2013 and 19/2014, 35/2014, 131/2014 and 195/2014 have been obtained from United States Geological Survey (USGS,2014). Data from an automatic weather station at an elevation of approximately 546 m (lat: 25º47‘02’’ S long:53º18‘31” W. ) belongs to National Institute of Meteorology (INMET, 2014) equipped with a pyranometer, anemometer, a thermometer and humidity sensor was available to assist the calculation of the surface energy balance terms, with 10 meters of grass cover around the station. One precipitation record was observed in the days of passage of the satellite, in 19/2014, with precipitation of 0.2mm. Software ENVI 5.0 was used for image processing.
Using the surface radiation balance equation, the first in step in SEBAL procedure was to compute the net surface radiation flux (Rn), which represents the actual radiant energy available at the surface. The surface radiation balance equation is represented by the Equation (1) (ALLENet al., 2002):
R
n = Rs↓- αRs↓+ RL↓- RL↑- (1-є0)RL↓ (1)
where: Rs↓is the incoming shortwave solar radiation (W m-2), α is the surface albedo, R
L↓ and RL↑ are incoming and outgoing longwave radiation (W m-2), ԑ
o
is the land surface emissivity.
Figure 1 - Localization map of the municipality of Salto do Lontra (RGB composition 564), in the State of Parana, Brazil. Datum SIRGAS 2000, UTM Coordinates, Zone 22S
warming the soil. The most frequently used approach to evaluated G using remote sensing is a construction of an empirical relation function by Bastiaanssen (2000):
(2)
where: Ts is surface temperature (K) and NDVI is
normalized difference vegetation index. The values assigned for the relation G/Rn were 0.5 when the surface is water (ALLENet al., 2002).
Sensible heat flux H is the rate of heat loss to the air by convection and conduction, due to a temperature difference. The classical expression for sensible heat flux is a function of the temperature gradient, surface roughness and wind speed and this step has high propensity to failures in the process due to considerations and assumptions. The sensible heat flux is represented by the Equation (3):
(3)
where: ρ is the air density (kg m-3) which is a function of
atmospheric pressure, Cp is the specific heat capacity of air (≈1004 J kg-1 K-1), dT is the near surface temperature
difference (K), rah is the aerodynamic resistance to heat transport (s m-1).
The sensible heat flux equation is difficult to solve due to rahand dT are unknowns. A linear relationship between the surface temperature Ts and dT is used to calculate near surface temperature difference. This relation is given by the coefficientsaandb, obtained from pixels
called “anchors”, or hot and cold pixels, where reliable values for H can be predicted and a dT estimated. The cold pixel is a well-irrigated crop surface with cover and Ts close to the air temperature (Ta). The hot pixel is a dry bare agriculture field where latent heat flux (λET) is assumed to be 0. The anchors pixels tie the calculations for all other pixels between these two points (LIMAet al., 2014; SUN et al., 2011).
Latent heat flux is the rate of latent heat loss from the surface due to evapotranspiration and is the calculated residual term of the energy budget, and it is used to compute the instantaneous evaporative fraction Λ, as shown in Equation (4):
Meteorological studies have indicated instantaneous evaporative fraction is almost constant in time (AYENEW, 2003). Thus, at daily time scales, ET24(mm d-1)
can be computed as Equation (5):
(5)
where: Rn24 (W m-2) is the 24 h averaged net radiation, λ (J kg-1) is the latent heat of vaporization.
To validate the model results obtained, ET from SEBAL were compared to ETc obtained from Penman Monteith FAO 56 equation in soybean fields for dates 2 December 2013, 19 January 2014 and 4 February 2014 and ETc in pasture areas for 11 May 2014 and 14 July 2014.
RESULTS AND DISCUSSION
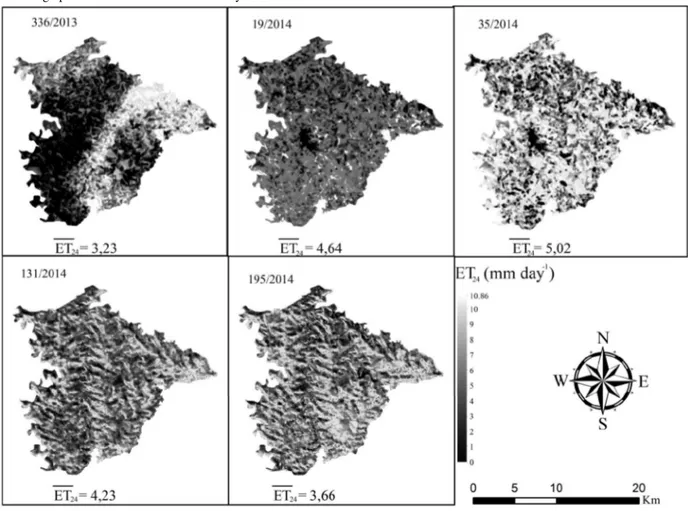
The estimated daily values of ET (ET24) on the fives images analyzed ranged from 0 to 10.86 mm/day with the
Figure 2 - Evapotranspiration at daily time scale (ET24) for the periods of the year from 2013(figure a) to 2014 (figure e). The bars mean average pixel values and DOY means Day of the Year
average ET24 values ranged from 3,23 to 5,02 mm day-1
(Figure 2) . Sunet al. (2011), using SEBAL and Landsat 7
images, obtained values ranged from 0 to 8 mm day-1with
the average ET24value of about 4.87 mm day-1 .
According to Allenet al. (1998), ET is determined
by weather parameters, crop characteristics, management and environmental aspects, and these parameters might explain mean values on the fives images. From DOY 336/2013 to 35/2014 ET increased largely due to temporary crops development, while 131/2014 and 195/2014 images contained mainly bare soil and sparse temporary crops.
In order to determine the average ET24 values for all types of land use in Salto do Lontra, it was used the visual classification resulting from the study of Wrublack, Mercante and Vilas Boas (2013). Using the shapes of all areas of the municipality containing each soil use, we use GIS software to calculate the average values. Average ET24values in the areas of water bodies, forest, pasture, agriculture and urban areas for the five images analyzed
with average values ranging from 4.14 to 6.3 mm day-1
(Figure 3).Arraeset al. (2012) using SEBAL algorithm
in similar conditions to this study obtained ET24averages ranging from 4,06 to 5,48 mm day-1. In water surfaces, the
predominant process is the evaporation, which explains the results obtained. For vegetated covers, native forest had higher averages, with values close to those obtained for water bodies, while urban area showed the lower ET24 averages. Similar patterns were found by Monteiroet al.
(2014), using Landsat 5 images and SEBAL to estimate radiative fluxes and ET24.
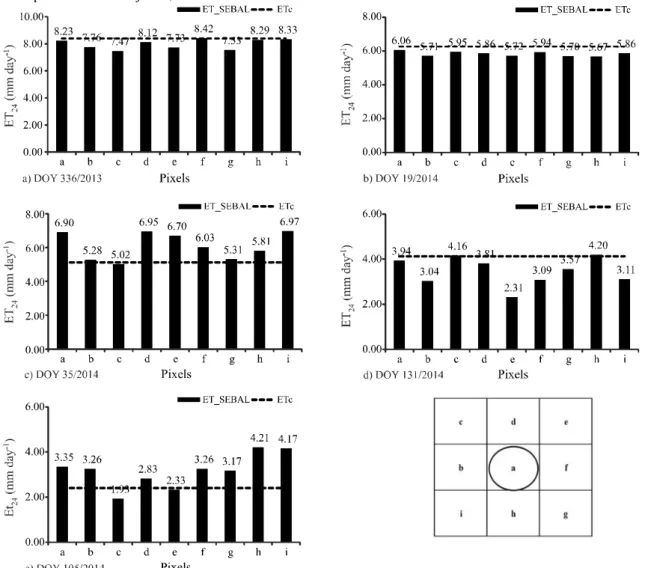
It was used the methodology by Oliveira (2012), in order to compare the SEBAL algorithm results (ET24_
SEBAL) with crop evapotranspiration (ETc) estimated by
FAO-Penman-Monteith equation (Figure 4) from a pasture (DOY 131/2014 and 195/2014) and soybeans areas (DOY 336/2014, 19/2014 and 35/2014).
Figure 3 - Daily average evapotranspiration (ET24) for areas of water bodies, forest, pasture, agriculture and urban areas for the periods of the year from 2013 to 2014. DOY means Day of the Year
DOY 19/2014, respectively). Higher value for MAE was found in DOY 35/2014 (1.00 mm day-1), similar result
was observed by Lima et al. (2014) with MAE ranged
from 0.27 mm day-1 to 0.98 mm day-1. The results of
MRE were higher than those found by Bezerra, Silva and Ferreira (2008), who obtained errors lower than 10%; However, these authors used hourly values (actual hourly evapotranspiration - mm h-1) and the results obtained in
this study are of integrated values of instantaneous latent heat flux for the time of satellite passage.
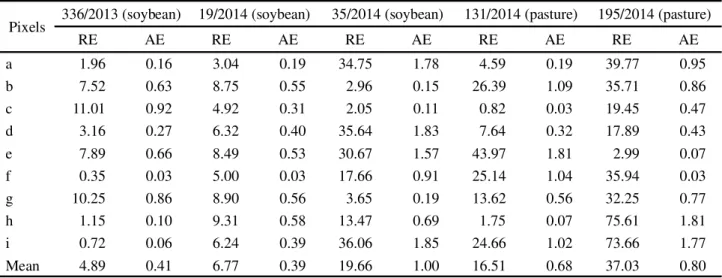
Table 1- Relative error - RE (%), absolute error - AE (mm day-1), mean relative error - MRE (%) and mean absolute error
- MAE (mm day-1), between ET
24 obtained for the five images by SEBAL model - ET24_SEBALand crop evapotranspiration - Etc
estimated by FAO-Penman-Monteith equation
Pixels 336/2013 (soybean) 19/2014 (soybean) 35/2014 (soybean) 131/2014 (pasture) 195/2014 (pasture)
RE AE RE AE RE AE RE AE RE AE
a 1.96 0.16 3.04 0.19 34.75 1.78 4.59 0.19 39.77 0.95
b 7.52 0.63 8.75 0.55 2.96 0.15 26.39 1.09 35.71 0.86
c 11.01 0.92 4.92 0.31 2.05 0.11 0.82 0.03 19.45 0.47
d 3.16 0.27 6.32 0.40 35.64 1.83 7.64 0.32 17.89 0.43
e 7.89 0.66 8.49 0.53 30.67 1.57 43.97 1.81 2.99 0.07
f 0.35 0.03 5.00 0.03 17.66 0.91 25.14 1.04 35.94 0.03
g 10.25 0.86 8.90 0.56 3.65 0.19 13.62 0.56 32.25 0.77
h 1.15 0.10 9.31 0.58 13.47 0.69 1.75 0.07 75.61 1.81
i 0.72 0.06 6.24 0.39 36.06 1.85 24.66 1.02 73.66 1.77
Mean 4.89 0.41 6.77 0.39 19.66 1.00 16.51 0.68 37.03 0.80
CONCLUSIONS
1. The estimated ET in agricultural areas, native vegetation and urban areas using SEBAL algorithm were compatible with those shown in the literature. Urban areas had the lower values while water bodies showed highest rates of evapotranspiration;
2. It was shown that there was good agreement between estimates obtained by SEBAL and by the Penman Monteith FAO 56 model, validating the algorithm. The errors between the models were less than or equal to 1.00 mm day-1.
ACKNOWLEDGEMENTS
The authors would like to thank the National Counsel of Technological and Scientific Development (CNPq) for financial support and Salto do Lontra research Figure 4 shows the results of the comparison between two methodologies obtained for the fives images analyzed and schematic representation of the localization for reference pixel – “a” and its adjacent pixels from “b” to “i”. ET24_SEBAL values for DOY 336/2013, 19/2014 were lower than ETc values (8.39 mm day-1 and 6.26 mm
day-1, respectively) for all pixels, and according to Table
1 these images had lower mean relative errors (MRE) and mean absolute errors (MAE), (4.89% and 0.41 mm day-1 for DOY 336/2013, 6.77% and 0.39 mm day-1 for
group for the permission to use Salto do Lontra land cover shapefiles.
REFERENCES
ALLEN, R. G. et al. Crop evapotranspiration: guidelines for computing crop water requirements. Rome:FAO, 1998. 300 p. (FAO. Irrigation and Drainage Paper, 56).
ALLEN, R. G.et al. Satellite-based energy balance for Mapping Evapotranspiration with Internalized Calibration (METRIC): applications.Journal of Irrigation and Drainage Engineering, v. 133, n. 4, p. 395-406, 2007.
ALLEN, R. G.et al.Surface Energy Balance Algorithm for Land (SEBAL): advanced training and users manual. Kimberly: Idaho Implementation, 2002.
PESQUISA E INOVAÇÃO, 7., 2012, Palmas. Anais... Palmas, 2012.
AYENEW, T. Evapotranspiration estimation using thematic mapper spectral satellite data in the Ethiopian rift and adjacent highlands.Journal of Hydrology, v. 279, n. 1, p. 83-93, 2003. BASHIR, M. A. et al. Satellite-based energy balance model to estimate seasonal evapotranspiration for irrigated sorghum: a case study from the Gezira scheme, Sudan.Hydrology and Earth System Sciences, v. 12, n. 4, p. 1129–1139, 2008. BASTIAANSSEN, W. G. M. et al. A remote sensing surface energy balance algorithm for land (SEBAL). Journal of Hydrology, v. 212, p. 198–212, 1998.
BASTIAANSSEN, W. G. M. SEBAL-based sensible and latent heat fluxes in the irrigated Gediz Basin , Turkey. Journal of Hydrology, v. 229, n. 1, p. 87–100, 2000.
BEZERRA, B. G.; SILVA, B. B.; FERREIRA, N. J. Estimativa da evapotranspiração real diária utilizando-se imagens digitais TM - LANDSAT 5.Revista Brasileira de Meteorologia, v. 23, n. 3, p. 305-317, 2008.
ELHAG, M.et al. Application of the Sebs water balance model in estimating daily evapotranspiration and evaporative fraction from remote sensing data over the Nile Delta.Water Resources Management, v. 25, n. 11, p. 2731–2742, 2011.
HONG, S. HO; HENDRICKX, J. M. H.; BORCHERS, B. Up-scaling of SEBAL derived evapotranspiration maps from Landsat (30 m) to MODIS (250 m) scale.Journal of Hydrology, v. 370, n. 1, p. 122–138, 2009.
IMMERZEEL, W. W.; GAUR, A.; ZWART, S. J. Integrating remote sensing and a process-based hydrological model to evaluate water use and productivity in a south Indian catchment.
Agricultural Water Management, v. 95, n. 1, p. 11-24, 2008. INSTITUTO NACIONAL DE METEOROLOGIA. Estação meteorológica de observação de superfície automática. Disponível em: <http://www.inmet.gov.br.>. Acesso em: 12 fev. 2014.
LIMA, E. P.et al. Evapotranspiração real diária em sub-bacias do Paracatu, utilizando produtos do sensor Modis.Revista Ceres, v. 61, n. 1, p. 17-27, 2014.
MACHADO, C. C. et al. Estimativa do balanço de energia utilizando imagens TM - Landsat 5 e o algoritmo sebal no litoral sul de Pernambuco.Revista Brasileira de Meteorologia, v. 29, n. 1, p. 55-67, 2014.
MARTÍNEZ-GRANADOS, D.et al. The economic impact of water evaporation losses from water reservoirs in the Segura Basin, SE Spain.Water Resources Management, v. 25, n. 13, p. 3153-3175, 2011.
MENEZES, S. J. M. deet al. Estimation of energy balance components and evapotranspiration in eucalyptus crops using
the SEBAL algorithm and Landsat 5 TM image. Revista Árvore, v. 35, n. 3, p. 649-657, 2011.
MONTEIRO, P. F. C.et al. Estimativa dos componentes do balanço de energia e da evapotranspiração para áreas de cultivo de soja no sul do Brasil utilizando imagens do sensor TM Landsat 5. Bragantia, v. 73, n. 1, p. 72–80, 2014.
MUTIGA, J. K.; SU, Z.; WOLDAI, T. Using satellite remote sensing to assess evapotranspiration: case study of the upper Ewaso Ng’iro North Basin, Kenya. International Journal of Applied Earth Observation and Geoinformation, v. 12, p. S100-S108, 2010.
OLIVEIRA, L. M. M. Estimativa da evapotranspiração real por sensoriamento remoto na bacia do rio Tapacurá-PE. 2012. 136 f. Tese ( Doutorado em Tecnologia Ambiental e Recursos Hídricos). Universidade Federal de Pernambuco, Recife, 2012.
OLIVEIRA, L. M. M.et al. Evapotranspiração real em bacia hidrográfica do Nordeste brasileiro por meio do SEBAL e produtos MODIS. Revista Brasileira de Engenharia Agrícola e Ambiental, v. 18, n. 10, p. 1039-1046, 2014. SEMMENS, K. A. et al. Monitoring daily evapotranspiration over two California vineyards using Landsat 8 in a multi-sensor data fusion approach.Remote Sensing of Environment, 2015. SENAY, G. B. et al. Evaluating Landsat 8 evapotranspiration for water use mapping in the Colorado River Basin. Remote Sensing of Environment, 2015.
SILVA, B. B. et al. Evapotranspiração e estimativa da água consumida em perímetro irrigado do Semiárido brasileiro por sensoriamento remoto.Pesquisa Agropecuária Brasileira, v. 47, n. 9, p. 1218-1226, 2012.
SUN, Z. et al. Evapotranspiration estimation based on the SEBAL model in the Nansi Lake Wetland of China.
Mathematical and Computer Modelling, v. 54, n. 3/4, p. 1086-1092, 2011.
TEIXEIRA, A. H. de C. et al. Energy and water balance measurements for water productivity analysis in irrigated mango trees, Northeast Brazil.Agricultural and Forest Meteorology, v. 148, n. 10, p. 1524–1537, 2008.
UNITED STATES GEOLOGICAL SURVEY. Landsat 8. Disponível em: <http://landsat.usgs.gov>. Acesso em: 19 fev. 2014.
WRUBLACK, S. C.; MERCANTE, E.; VILAS BOAS, M. A. Mapping of use and occupation of the soil and irrigation water quality in the city of Salto do Lontra-Paraná, Brazil.Engenharia Agrícola, v. 34, n. 5, p. 1024–1037, 2013.
YANG, J. et al. Water consumption in summer maize and winter wheat cropping system based on SEBAL model in Huang-Huai-Hai Plain, China. Journal of Integrative Agriculture, v. 14, n. 10, p. 2065-2076, 2015.