http://www.uem.br/acta ISSN printed: 1806-2636 ISSN on-line: 1807-8672
Doi: 10.4025/actascianimsci.v38i4.32207
Sward structure, light interception and herbage accumulation in
forage peanut cv. Belmonte subjected to strategies of intermittent
grazing management
Henrique Bauab Brunetti, Lucas da Rocha Carvalho, Marília Barbosa Chiavegato and Sila Carneiro da Silva*
Laboratório de Plantas Forrageiras, Departamento de Zootecnia, Escola Superior de Agricultura “Luiz de Queiroz”, Av. Pádua Dias, 11, Cx. Postal 9, 13418-900, Piracicaba, São Paulo, Brazil. *Autor for correspondence. E-mail: siladasilva@usp.br
ABSTRACT. Nitrogen fertilization ensures productivity and persistency of pastures, but may be expensive. Perennial forage peanut, becomes an interesting alternative for N supply. Little is known about its use under grazing. The objective of this study was to evaluate regrowth process of forage peanut using an experimental protocol analogous to tropical forage grasses under rotational grazing. Treatments corresponded to two pre- (95% and maximum canopy light interception – LI95% and LIMax) and two
post-grazing (post-post-grazing heights of 40 and 60% of pre-post-grazing height) conditions, in a 2x2 factorial arrangement in a randomized complete block design (n = 4). Targets of LI grazing affected pre-grazing height and LI post-pre-grazing. The residual sward LAI did not vary, resulting in similar pre-grazing interval. Greater rates and total herbage accumulation were recorded for LIMax target, consequence of the
greater accumulation of stolons at the lower strata of the swards. Greater percentage of leaflets was recorded for the LI95% target. Given the stoloniferous growth habit of forage peanut, stolon accumulation in
the lower strata of the sward do not represent a limitation to leaf accumulation and morphological composition. The greater pre-grazing sward height associated with the LIMax target facilitate herbage
prehension and intake, further investigation is needed.
Keywords: intermittent stocking, sward structure, pre-grazing height, botanical/morphological composition, grazing management.
Estrutura do dossel, interceptação de luz e acúmulo de forragem em amendoim-forrageiro
cv. Belmonte submetido a estratégias de pastejo rotativo
RESUMO. A adubação nitrogenada assegura produtividade e persistência de pastagens, mas pode ser onerosa. O amendoim forrageiro é alternativa, porém são escassas informações sobre seu manejo sob pastejo. Objetivou-se avaliar o processo de rebrotação do amendoim forrageiro, utilizando procedimento análogo ao utilizado para gramíneas tropicais sob pastejo rotativo. Os tratamentos corresponderam a combinações entre duas condições pré-pastejo (95% e máxima interceptação luminosa pelo dossel – IL95% e
ILMáx) e duas condições pós-pastejo (alturas de 40 e 60% da altura pré-pastejo), segundo arranjo fatorial 2x2
e delineamento de blocos completos casualizados (n = 4). A IL pré-pastejo afetou a altura pré-pastejo e IL pós-pastejo. O IAF residual não variou entre tratamentos, resultando em intervalo entre pastejos semelhantes. Maior taxa e acúmulo de forragem foram verificados para a meta ILMáx, devido ao maior
acúmulo de estolões nos estratos inferiores. Maior porcentagem de folíolos foi verificada para a meta IL95%.
Devido ao seu hábito de crescimento estolonífero, o acúmulo de estolões do amendoim forrageiro em estratos inferiores do dossel não comprometeu o acúmulo de folhas nos estratos superiores. Maior altura de entrada nos pastos manejados com a meta ILMáx pode representar maior facilidade de preensão e
consumo de forragem, fato que necessita de estudos adicionais.
Palavras-chave: lotação intermitente, estrutura do pasto, altura pré-pastejo, composição botânica/morfológica, manejo do pastejo.
Introduction
Nitrogen is the most important nutrient for plant development. This nutrient integrates essential nucleic acids, amino acids, and the chlorophyll molecule (Stitt & Krapp, 1999). For that reason,
Acta Scientiarum. Animal Sciences Maringá, v. 38, 4, p. 395-404, Oct-Dec., 2016
greenhouse gas emissions, loss of biodiversity (Schulze et al., 2009; Stoate et al., 2009), contamination and eutrophication of lakes and groundwater (Di & Cameron, 2002). In this context, the use of legumes arises as an alternative to increase
N supply, via biological N2 fixation, which
represents a sustainable N addition to production systems. Legumes are high in N content and digestibility, and therefore can increase nutritional value of the consumed forage (Barcellos, Ramos, Vilela, Junior, & Bueno, 2008), potentially resulting in increased animal performance and system productivity (Euclides, Macedo, & Oliveira, 1998).
Forage peanut is a tropical legume (Arachis pintoi
Krapovickas & Gregory cv. Belmonte) with great persistence in low fertility soils (Bowman & Wilson, 1996), increased productivity, and nutritional value (Villarreal et al., 2005). It has also been recognized for shading tolerance (Andrade, Valentim, Costa Carneiro, & Vaz, 2004), which allows for great performance under mixed grass/legume pastures (Jones, 1993), and high biological nitrogen fixation potential (Miranda, Vieira, & Cadisch, 2003).
Although forage legumes add great value to grasslands ecosystems, little is known about its biology and ecology under grazing. Knowledge on the grazing effects on legumes biology and ecology are essential for determination of grazing strategies that maximize legumes natural growth pathway and perennation, which ensure legumes persistence and productivity, as well as, animal nutritional needs (Silva & Nascimento Júnior, 2007).
Under rotational grazing, recent studies focused on tropical grasses have shown that light interception (LI) is the best criteria to determine ideal grazing events, during regrowth (Barbosa et al., 2007; Carnevalli et al., 2006; Zanini, Santos, & Sbrissia, 2012). Optimal net forage accumulation (i.e. forage production) is obtained when balance between plant death and growth is maximum. This scenario is met when the sward intercepts 95% of photosynthetic active radiation (PAR), during the linear phase of the regrowth curve (Parsons, Leafe, Collett, Penning, & Lewis, 1983). Above the 95% LI target, the sward growth shifts, resulting in increased stem proportion and dead material accumulation (Silva et al., 2009). It has been shown that the LI criteria can be applied based on forage height, which facilitates its use in the field. In addition to the use of 95% LI as a criteria to initiate rotational grazing, the residual height is also of crucial matter.
Residual height is directly related to forage consumption, nutrient intake (Carvalho et al., 2009), and plant regrowth (Silva et al., 2009). Recently,
Fonseca, Mezzalira, Bremm, Gonda, and Carvalho (2012) suggested that intake could be maintained at high levels, as far as residual height is kept at 40 to 50% of forage height. Below that threshold, there could be considerable decrease on intake rate, due mainly to difficulty to access lower strata of the sward, resulting in decreased bite mass. If grazing is allowed to post-grazing heights lower than 60%, there could be considerable decrease in intake, negatively affecting animal performance and sward persistence because of the consequent reduction in LAI (Silveira et al., 2013).
In this context, the hypothesis of this study was that, forage peanut cv. Belmont under rotational grazing has growth pattern and leaf area renovation similar to those observed for grass species. Therefore, the use of the LI criteria during regrowth to determine grazing strategies is adequate, and the 95% LI by the sward is the target to determine grazing events. The objective of this study was to assess sward structure, forage accumulation, and forage botanical and morphological composition of forage peanut under rotational grazing.
Material and methods
The study was conducted at the University of São Paulo, College of Agriculture “Luiz de Queiroz”, in Piracicaba, São Paulo State. The geographical coordinates of the experimental site are 22º42’ South latitude, 47º38’ West longitude and 546 m altitude.
Forage peanut cv. Belmonte is from the Fabaceae
Lindl. Family (i.e. Leguminosae or Papilionaceae),
subfamily Faboideae (i.e. Papilionoideae), tribe
Aeschynomeneae and subtribe Stylosanthinae (Valls &
Simpson, 2005). Forage peanut (Arachis pintoi cv.
Belmonte) is a perennial tropical legume, herbaceous, stoloniferous from Brazil. It has been commercially used since 1999, after agronomical evaluation performed by CEPLAC (Executive Committee of Cocoa Farming Plan, in Portuguese).
The soil type of the experimental area is Kandiudalfic Euthrudox (EMBRAPA, 2006). Soil analysis at 20 cm depth prior to the experiment showed the following soil characteristics: pH CaCl2:
5.85; organic matter = 41.0 g dm–3; P (ion exchange
resin extraction method) = 77.0 mg dm–3; Ca =
87.5 mmolc dm–3; Mg = 50.0 mmolc dm–3; K =
16.3 mmolc dm–3; H + Al = 26.5 mmolc dm–3; sum
of bases = 146.3 mmolc.dm–3; cation exchange
capacity = 172.8 mmolc.dm–3; base saturation= 84%.
dry winters, and 1328 mm average annual rainfall (Kottek, Grieser, Beck, Rudolf, & Rubel, 2006). The average daily temperature during the experimental period was considered typical for the study site, based on historical data from 1917 to 2012. Average daily temperatures during the experiment varied from 23°C in April to 27°C in January 2015. Rainfall during the experiment varied from 73 mm in April to 207 mm in February 2015. Rainfall during the last three months of the experiment was similar to expected, based on historical data. However, there was a drought in January, and accumulative rainfall was 90 mm.
In order to avoid stress due to drought, irrigation was applied. The amount of water used was determined based on rainfall, average daily temperature and evapotranspiration. Rainfall was monitored weekly, and in case of rain, the amount of water applied was recalculated to avoid stress related to excess irrigation. Despite irrigation, experimental areas were under drought stress in January, due to technical problems in the irrigation equipment.
Experimental paddocks were established in November 2011, when forage peanut was planted. From September 2012 to March 2014, a series of experiments were conducted in the area, mainly with continuous stocking. From March to October 2014, rotational grazing was introduced, and in November experimental treatments were designed to paddocks. Treatments consisted of different combinations between LI targets (95% and
maximum LI during regrowth; LI95% and LIMax,
respectively) and post-grazing heights (40 and 60%). Therefore, the experimental design was a 2 x 2 factorial, with randomized block design established in 4 replicates. The experimental period was from January to April, 2015, which corresponds to an entire summer season, in the study site. There were 2 adaptation periods, prior to the experimental period. From March to October 2014, rotational grazing was introduced for grazing strategy adaptation, and from November to December 2014, paddocks were adapted to experimental treatments. Therefore, there was a total of 9 months of adaptation, which ensured that differences observed during the experimental period were a result of treatments.
Canopy LI was monitored with LAI 2000 canopy analyzer (LI-COR, Lincoln, NE). Initially, LI measurements were taken once weekly until 90% LI was achieved. Once canopy had reached 90% LI, measurements were taken in a daily basis to allow precise determination of LI pre-grazing targets (LI95%
and LIMax). Canopy LI measurements were taken
from 10 randomly selected points per paddock. In each point, 5 readings were made at ground level and 1 reading was taken above the canopy (total of 50 readings at ground level). The same equipment was used to determine foliage angle. Sward height was monitored, pre and post-grazing, with a stick graduated in centimeters (sward stick – Murphy) (50 readings per paddock), to ensure precision on post-grazing heights targets (40 and 60%). Grazing was conducted with 200 kg dairy heifers by mob grazing method according Gildersleeve, Ocumpaugh, Quesenberry, and Moore (1987).
The forage mass, forage accumulation, and forage botanical and morphological composition were evaluated during two consecutive grazing events in order to characterize the changes in which experimental areas were submitted (i.e. treatments). Forage mass and forage accumulation were determined based on pre and post-grazing samples. Forage botanical and morphological composition were evaluated with 0.33 m2 (0.90 x 0.37 m) metallic
frames, per paddock. Metallic frames were allocated to spots that represented the average sward condition at the time of sampling (based on visual assessment of herbage height). The forage mass within the frames was cut aboveground, stored in plastic bags and sub-sampled to manual subdivision of the following components: weed, dead material, stolon, leaflets, and petiole. Each component was stored separately in paper bags, identified accordingly and oven dried at 65°C until constant weight. Based on the dry weight determined of each component, botanical and morphological composition of forage mass was calculated (kg ha-1).
Acta Scientiarum. Animal Sciences Maringá, v. 38, 4, p. 395-404, Oct-Dec., 2016
calculate forage accumulation, total forage accumulation was obtained by adding the pre-grazing forage mass from the previous pre-grazing to the forage accumulated during the controlled grazing
cycle, and the value was presented in kg MS ha-1.
The same procedure was done to leaf mass (leaflet + petiole) and to Arachis pintoi (leaflet + petiole +
stolon) to determine leaf mass and Arachis
accumulation.
The spatial distribution of each botanical and morphological component along the vertical profile of the sward was evaluated using the inclined point quadrat (Wilson, 1960), pre and post-grazing during the second grazing cycle. The equipment was allocated to spots that represented the average sward condition at the time of sampling (based on visual assessment of herbage height) allowing the description of the vertical positioning of the botanical and morphological components of the forage mass as the metallic rod was being introduced into the sward and its pin touched different structures and vegetal tissues. The components identified were: leaflets, petioles, stolons, dead material (material completely necrosed or separated from the plant), and weed (every plant different from forage peanut). Each component was identified and its height recorded using the rod of the quadrat (graduated in centimeters). The data was written down in a spreadsheet specially prepared for this type of evaluation. After each touch, the touched component was carefully taken out of the pin to continue the procedure of evaluation introducing the graduated rod into the sward until new touch occurred. This procedure was repeated until the pin touched the soil generating the last height reading, utilized as reference for the calculations of the effective heights of touches realized in relationship to the soil. A total of 100 readings was done and results were presented as the percentage of total reading in each sward height stratum.
Statistical analysis was performed using the MIXED procedure of SAS® (Statistical Analysis System
8.2 for Windows®). Light interception, post-grazing
height, grazing cycle and their interactions were considered fixed effects, and blocks were considered the random term (Piepho, Büchse, & Emrich, 2003). Data were tested for normality of residuals and variance homogeneity. Different structures of the variance-covariance matrix were tested and Bayesian Information Criterion (BIC) was used to select the best one (Yang, 2010). The ANOVA considered the following effects: light interception, post-grazing height, grazing cycle and their interactions.
Treatment means were determined using the LSMEANS procedure, and means separation was based on the Student test. All tests were performed
with 95% confidence (α = 0.05). Only significant
effects are shown in the Results section.
Results
Light interception (LI) pre-grazing was used as a covariate, and therefore was not submitted to ANOVA. During both grazing cycles monitored, LI
values observed were 94.9 and 99.2%, for LI95% and
LIMax, respectively (Table 1). Post-grazing LI was
considered response variable, and therefore was submitted to ANOVA. Post-grazing LI varied with post-grazing height, with greater values observed for 60% grazing heights, as compared to 40%
post-grazing height (65.0 and 70.7 ± 0.07% for 40 and
60% post-grazing heights, respectively).
Pre-grazing, sward height did not differ between post-grazing heights, when paddocks were managed
with LI95%. However, when paddocks were managed
with LIMax, greater values were observed for 60%
grazing height, as compared to 40% post-grazing height (Table 2), which resulted in significant LI x post-grazing height interaction.
Similarly to pre-grazing LI, post-grazing height was used as a covariate and therefore was not submitted to ANOVA. In general, for all treatments the observed sward height was close to expected,
mainly for paddocks managed with LI95% as
compared to LIMax (62.0, 41.0, 58.4 and 42.0% of
pre-grazing height for LI95%/60, LI95%/40, LIMax/60 and
LIMax/40, respectively; Table 1).
Paddocks managed with LI95% allowed a
maximum of six grazing cycles, and paddocks
managed with LIMax allowed a maximum of four
grazing cycles. Grazing interval in days did not differ
between treatments and was on average 27.7 ± 1.10
days (Table1).
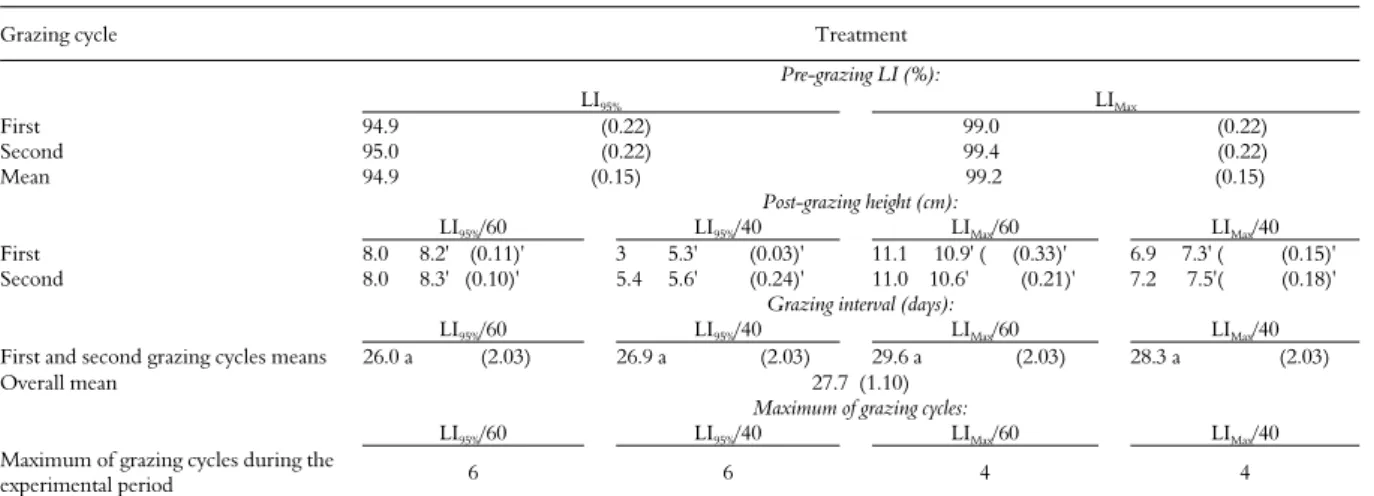
Table 1. Pasture and experimental characteristics.
Grazing cycle Treatment
Pre-grazing LI (%):
LI95% LIMax
First 94.9 (0.22) 99.0 (0.22) Second 95.0 (0.22) 99.4 (0.22) Mean 94.9 (0.15) 99.2 (0.15)
Post-grazing height (cm):
LI95%/60 LI95%/40 LIMax/60 LIMax/40
First 8.0 8.2' (0.11)' 3 5.3' (0.03)' 11.1 10.9' ( (0.33)' 6.9 7.3' ( (0.15)' Second 8.0 8.3' (0.10)' 5.4 5.6' (0.24)' 11.0 10.6' (0.21)' 7.2 7.5'( (0.18)'
Grazing interval (days):
LI95%/60 LI95%/40 LIMax/60 LIMax/40
First and second grazing cycles means 26.0 a (2.03) 26.9 a (2.03) 29.6 a (2.03) 28.3 a (2.03)
Overall mean 27.7 (1.10)
Maximum of grazing cycles:
LI95%/60 LI95%/40 LIMax/60 LIMax/40
Maximum of grazing cycles during the
experimental period 6 6 4 4
Values in parenthesis are standard error means. Values followed by ' are actual post-grazing heights, values without the symbol are planned post-grazing heights. Values followed by similar letters do not differ (p > 0.05).
Table 2.Arachis pintoi cv. Belmonte sward pre-grazing height, subjected to rotational grazing from January to April 2015.
Post-grazing heights
target LI95% LIMax Mean
40% (cm)
13.3Ab (0.18) 17.6 Ba (0.18) 15.5 (0.13) 60% 13.3 Ab (0.18) 18.4 Aa (0.18) 15.9 (0.13) Mean 13.3 (0.13) 18.0 (0.13)
Values in parenthesis are standard error means. Values followed by similar capital letters in columns, and lower case letters in rows do not differ (p > 0.05).
The pre-grazing LAI values remained stable across LI targets, regardless of post-grazing height. However, the post-grazing height was greater for paddocks managed with 40% post-grazing height
combined with LIMax. The same pattern was not
observed for paddocks managed with 60% post-grazing height, and therefore the LI x post-post-grazing height interaction was significant (Table 3). The post-grazing LAI values did not vary across treatments and post-grazing heights, and was on average 1.59 ± 0.338. Greater values of foliage angle
were observed pre-grazing for LI95% paddocks as
compared to LIMax (49.2 and 42.5 ± 0.77o for LI95%
and LIMax, respectively). The post-grazing foliage
angle did not vary across treatments and was on average 57.4 ± 0.13o.
Pre and post-grazing forage mass varied with LI (p < 0.05), with greater values observed for LIMax as
compared to LI95% (13440 and 9490 ± 380 kg MS ha -1 pre-grazing, and 8140 and 6500 ± 360 kg MS ha-1
post-grazing for LIMax and LI95%, respectively). The
dead material proportion varied with LI, both pre- and post-grazing (p < 0.05), with greater values
observed on paddocks managed with LI95%, as
compared to LI Max paddocks. Pre-grazing observed
values were 9.3 and 4.9 ± 0.86%, and post-grazing
values were 13.3 and 7.6 ± 0.93%, for LI95% and LIMax,
respectively. Weed proportion pre-grazing varied with LI x post-grazing height interaction (p < 0.05).
For LI Max paddocks, there were no differences
observed for post-grazing heights. However, for LI95% paddocks greater values were observed for 40%
grazing height as compared to 60% post-grazing height (Table 4).
The post-grazing proportion of weeds varied with post-grazing height and with the LI x grazing cycle interaction (p < 0.05). Greater values were observed in paddocks managed with 60% post-grazing height as compared to paddocks managed
with 40% post-grazing height (18.3 and 30.3 ±
3.01%, for 40 and 60% post-grazing heights, respectively). During the first grazing cycle, there was no difference between paddocks managed with LI95% or LIMax. However, during the second grazing
cycle, greater values were observed on paddocks
managed with LI95%, as compared to those managed
with LIMax (Table5).
The pre-grazing proportion of leaflets varied with LI and grazing cycle (p < 0.05). Greater values
were observed on paddocks managed with LI95%, as
compared to paddocks managed with LIMax (26.4 e
23.4 ± 0.97% for LI95% and LIMax, respectively).
Acta Scientiarum. Animal Sciences Maringá, v. 38, 4, p. 395-404, Oct-Dec., 2016
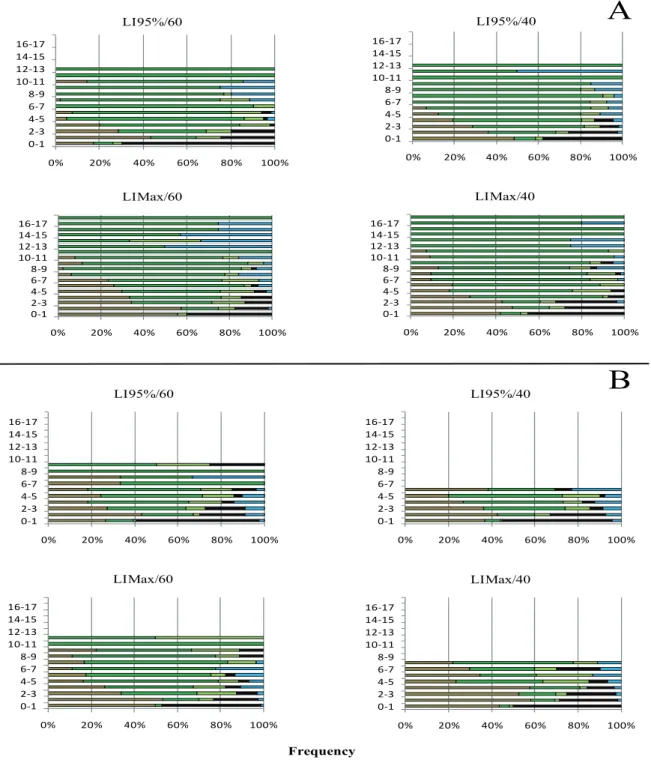
Figure 1. Vertical distribution of morphological components in the pre-grazing (A) and post-grazing (B) forage mass of forage peanut subjected to rotational grazing from January to April, 2015.
Table 3. Leaf area index pre-grazing of Arachis pintoi cv. Belmonte paddocks subjected to rotational grazing from January to April 2015.
LI – Targets Post-grazing heights
targets LI95% LIMax Mean
40% 5.94 Ab (0.465) 8.64 Aa (0.465) 7.29 (0.373) 60% 6.81 Aa (0.465) 7.77 Aa (0.465) 7.29 (0.373) Mean 6.38 (0.373) 8.21 (0.373) Values in parenthesis are standard error means. Values followed by similar capital letters in columns, and lower case letters in rows do not differ (p > 0.05).
Table 4. Weed proportion in pre-grazing forage mass of Arachis pintoi cv. Belmonte paddocks subjected to rotational grazing from January to April 2015.
Post-grazing heights
target LI95% LIMax Mean
40% 17.7 Aa (2.79) 9.4 Ab (2.79) 13.6 (2.27) 60% 10.8 Ba (2.79) 12.0 Aa (2.79) 11.4 (2.27) Mean 14.2 (2.27) 10.7 (2.27)
Values in parenthesis are standard error means. Values followed by similar capital letters in columns, and lower case letters in rows do not differ (p > 0.05).
Legend: ▬leaflet▬petiole▬stolon▬dead material▬weed
0% 20% 40% 60% 80% 100% 0-1
2-3 4-5 6-7 8-9 10-11 12-13 14-15 16-17
LI95%/60
0% 20% 40% 60% 80% 100% 0-1
2-3 4-5 6-7 8-9 10-11 12-13 14-15 16-17
LIMax/60
0% 20% 40% 60% 80% 100% 0-1
2-3 4-5 6-7 8-9 10-11 12-13 14-15 16-17
LI95%/40
0% 20% 40% 60% 80% 100% 0-1
2-3 4-5 6-7 8-9 10-11 12-13 14-15 16-17
LIMax/40
Frequency
0% 20% 40% 60% 80% 100% 0-1
2-3 4-5 6-7 8-9 10-11 12-13 14-15 16-17
LI95%/60
0% 20% 40% 60% 80% 100% 0-1
2-3 4-5 6-7 8-9 10-11 12-13 14-15 16-17
LI95%/40
0% 20% 40% 60% 80% 100% 0-1
2-3 4-5 6-7 8-9 10-11 12-13 14-15 16-17
LIMax/60
0% 20% 40% 60% 80% 100% 0-1
2-3 4-5 6-7 8-9 10-11 12-13 14-15 16-17
LIMax/40
A
Table 5. Post-grazing weed proportion in Arachis pintoi cv. Belmonte forage mass subjected to rotational grazing strategies determined based on 95% and maximum light interception during regrowth from January to April, 2015.
Grazing cycle LI95% LIMax Mean
First(Jan-Feb) 22.7 Aa(3.74) 26.2 Aa(3.74) 24.5 (3.01) Second (Mar-Apr) 29.2 Aa (3.74) 19.1 Ab (3.74) 24.2 (3.01) Mean 25.9 (3.01) 22.6 (3.01)
Values in parenthesis are standard error means. Values followed by similar capital letters in columns, and lower case letters in rows do not differ (p > 0.05).
The proportion of stolon pre-grazing varied with LI (p < 0.05), and greater values were observed on
paddocks managed with LIMax, as compared to
paddocks managed with LI95% (43.4 and 55.0 ± 1.78%
for LI95% and LIMax, respectively). Post-grazing, there
were effects of LI and post-grazing height (p < 0.05), with greater values observed on paddocks managed with LIMax (47.5 and 56.7 ± 2.87% for LI95% and LIMax,
respectively), and on paddocks managed with 40% post-grazing height as compared to paddocks managed with 60% post-grazing height (59.6 and 44.5 ± 2.87 for 40 and 60% post-grazing height, respectively).
The relationship between leaflet and stolon pre-grazing, varied with LI and grazing cycle (p < 0.05), with greater values observed on paddocks managed with LI95% (0.63 and 0.43 ± 0.032 for LI95% and LIMax,
respectively), and during the second grazing cycle as compared to the first grazing cycle (0.46 and 0.60 ± 0.032 for the first and second grazing cycles, respectively). Post-grazing, the only effect observed was for post-grazing height, and greater values were observed on paddocks managed with 60% post-grazing height (0.17 and 0.25 ± 0.024 for 40 and 60% post-grazing height, respectively).
The accumulation rate of Arachis pintoi (leaflets + petioles + stolons) varied only with LI (p < 0.05), and greater values were observed on paddocks managed with LIMax (110 e 230 ± 20 kg MS ha-1 day-1
for LI95% and LIMax, respectively). Similarly, total
accumulation of Arachis pintoi mass (accumulation
rate of Arachis pintoi + pre-grazing mass of Arachis pintoi) varied only with LI (p < 0.05). Greater values
were observed on paddocks managed with LIMax
(10140 and 17708 ± 730 kg MS ha-1 for LI 95% and
LIMax, respectively).
Leaf accumulation rate (leaflets + petioles) varied only with LI (p < 0.05), with greater values
observed on paddocks managed with LIMax (90 and
120 ± 10 kg MS ha-1 day-1 for LI
95% and LIMax,
respectively). Similarly, total leaf accumulation rate
of Arachis (leaf accumulation + pre-grazing leaf
mass) varied only with LI (p < 0.05), with greater
values observed on paddocks managed with LIMax
(5170 and 6800 + 330 kg MS ha-1 for LI
95% and LI
Max, respectively).
Discussion
The pre- and post-grazing targets planned were obtained and maintained successfully, which demonstrated that the experimental control was adequate (i.e. nine months of adaptation to experimental conditions and control of grazing and plant regrowth).
Despite the fact that grazing interval was not different among treatments, paddocks managed with LI95% had 6 grazing cycles, whilst paddocks managed
with LIMax had 4 grazing cycles (Table 1). Likely, the
difference in grazing severity resulting from the grazing treatments was not strong enough to result in significant difference in the number of grazing cycles. Grazing interval is also determined by regrowth rate. The rate of plant regrowth is dependent on two plant characteristics: size and efficiency of reminiscent leaf area. In this study, no differences on post-grazing LAI was observed, however, the distribution of plant components along the sward vertical profile was different (Figure 1).
Paddocks managed with LI95% and 40% post-grazing
height had lower leaflets proportion on upper stratum of the sward, as compared to paddocks managed with 60% post-grazing height. This difference was not observed on paddocks managed with LIMax, which indicated that post-grazing height
resulted in different grazing severities depending on the LI target used, offsetting the larger grazing
interval implemented on LIMax paddocks. In this
study, regrowth was controlled based on paddock LI. Light interception represents not only pasture leaf area, but also several other plant components that intercept light within the sward profile. Therefore, the greater proportion of stolons on LIMax paddocks
could have contributed to decrease grazing interval on these paddocks, resulting in lack of difference of grazing interval between LI targets. Greater LI values during regrowth were obtained with greater
forage height values (13.0 and 18.0 cm for IL95% e
ILMax, respectively; Table 2). The difference between
heights associated to LI targets was of 5 cm, which is much lower than previously observed for tropical grasses, such as mombaça grass (25 cm; Carnevalli et al. (2006), tanzânia grass (15 cm; Barbosa et al. (2007), xaraés grass (10 cm; Pedreira, Pedreira, and Silva (2007)), marandu grass (10 cm; Trindade et al. (2007), mulato grass (10 cm; Silveira et al. (2013) and napier grass (40 cm; Pereira, Paiva, Geremia, and Silva (2014). This difference was likely due to the more horizontal leaf structure of legumes as compared to grasses.
Acta Scientiarum. Animal Sciences Maringá, v. 38, 4, p. 395-404, Oct-Dec., 2016
greater than post-grazing, regardless of LI target implemented. However, weeds were also present (Figure 1). The greater proportion of leaflets in the upper half stratum of the sward reiterates the importance of an adequate post-grazing height definition. The reason is that, removing more than 50% of the starter forage implicates small amount of reminiscent leaf area (lower quality leaves), which results in restrictions to grazing (Fonseca et al., 2012), lower nutritional value of the forage (Trindade et al., 2007) due to increased proportion of stolon and dead material in the lower stratum of the sward (Figure 1).
Paddocks managed with LIMax had greater
pre-grazing forage mass than paddocks managed with LI95%. Once the difference between grazing intervals
was not significant, the greater forage mass observed
on LIMax paddocks was likely due to greater
proportion of stolons, which is the heaviest plant component. On the other hand, paddocks managed with LI95% target had greater proportion of leaflets
(Table 1) pre-grazing, which favors biting and nutritional value of the forage (Trindade et al., 2007). Result suggested that paddocks allowed to growth more than 95% of LI had greater accumulation of stolon as compared to leaves. This pattern is in agreement with the lower leaflet/stolon relationship, greater stolon proportion and forage mass
accumulation observed on LIMax paddocks. Usually,
on tropical grasses pastures, the increase in stem proportion (which is equivalent to stolon proportion) is accompanied with greater dead material accumulation, however this pattern was not observed in this study. The greater proportion of dead material both pre- and post-grazing was
observed on LI95% paddocks, as compared to LIMax
paddocks. The reason is likely that paddocks
managed with LI95% had greater proportion of weed
(on average 25%) than paddocks managed with LIMax.
Increased grazing frequency and severity of
paddocks managed with LI95% and 40% post-grazing
height, resulted in increased proportion of weeds. The longer rest period (LIMax versus LI95% for
post-grazing height 40%) or less severe post-grazing (post-grazing height of 60% as compared to 40%, for LI95%
paddocks) resulted in lower weeds proportion (Table 4). These results are likely associated to less severe or less frequent grazing that gave the forage peanut better growth conditions, relative to the observed weeds, which had similar growth habit to forage peanut and was highly aggressive. Thus, this fact, associated with weed management trough manual pull-off in post grazing during the experimental period, likely contributed to increased dead material on LI95% paddocks (Tables 4 and 5).
Greater accumulation and production rated of
Arachis during the two grazing cycles monitored
were observed in paddocks managed with LIMax, as
compared to paddocks managed with LI95%.
However, only part of the total forage mass is available for animal consumption, and different morphological components have different nutritional values. Consequently, each component influences animal feeding behavior and total nutrient consumption. The elevated production of
Arachis on LIMax paddocks was a result of greater
presence and accumulation of stolons in the total
forage mass. However, on LIMax paddocks, stolons
were in the lower half stratum of the sward, closer to the ground, which is outside the grazing stratum (forage sward upper half). Additionally, there was
greater leaves accumulation on Arachis paddocks
managed with LIMax, suggesting that for forage
peanut pastures, greater stem (or stolon) elongation related to longer regrowth allowance, may not result in such reduction of forage and nutrient intake as observed for grasses. This hypothesis needs further evaluation, but the small difference observed between pre-grazing heights (5 cm; 13 versus 18 cm
for LI95% and LIMax, respectively) supports the
hypothesis. The reason is that, greater heights non-associated to increased proportion of dead material and stems favors bite mass and forage intake (Griffiths, Hodgson, & Arnold, 2003). In the context which forage production is no longer the sole criteria to determine grazing strategies, patterns such as stolon growth implications, greater amount of nodules and nitrogen biological fixation become necessary for stipulation of the most adequate grazing strategy, for a specific condition and production objective.
Conclusion
Forage peanut has regrowth pattern similar to tropical grasses. However, due to stoloniferous growth habit, the greater accumulation of stolons on
paddocks managed with LI95%, did not compromise
leaves accumulation nor forage composition in the grazing stratum of the sward. In this scenario,
increased forage height on LIMax paddocks could
favor animal intake and performance. However, this hypothesis needs further and more detailed investigation.
References
Barbosa, R. A., Nascimento Júnior, D., Euclides, V. P. B., Silva, S. C., Zimmer, A. H., & Torres Júnior, R. A. (2007). Capim-tanzânia submetido a combinações entre intensidade e frequência de pastejo. Pesquisa Agropecuária Brasileira, 42(3), 329-340.
Barcellos, A. O., Ramos, A. K. B., Vilela, L., Junior, M., & Bueno, G. (2008). Sustentabilidade da produção animal baseada em pastagens consorciadas e no emprego de leguminosas exclusivas, na forma de banco de proteína, nos trópicos brasileiros. Revista Brasileira de Zootecnia, 37(supl.), 51-67.
Bowman, A. M., & Wilson, G. P. M. (1996). Persistence and yield of forage peanuts (Arachis spp.) on the New South Wales north coast. Tropical Grasslands, 30(4), 402-406.
Carnevalli, R. A., Silva, S. C., Bueno, A. A., Uebele, M. C., Bueno, F. O., Hodgson, J., ... Morais, J. P. G. (2006). Herbage production and grazing losses in
Panicum maximum cv. Mombaça under four grazing
managements. Tropical Grasslands, 40(3), 165.
Carvalho, P. C. F., Trindade, J. K., Mezzalira, J. C., Poli, C. H. E. C., Nabinger, C., Genro, T. C. M., & Gonda, H. L. (2009). From the bite to precision grazing: understanding the plant-animal interface to exploit the multi-functionality of grasslands. Revista Brasileira de Zootecnia, 38(spec.), 109-122.
Comissão Executiva do Plano da Lavoura Cacaueira [CEPLAC]. (2013). Cacaueira (Vol. 10). Ilhéus, BA: CEPLAC.
Di, H. J., & Cameron, K. C. (2002). Nitrate leaching in temperate agroecosystems: sources, factors and mitigating strategies. Nutrient Cycling in Agroecosystems, 64(3), 237-256.
Empresa Brasileira de Pesquisa Agropecuária [EMBRAPA]. (2006). Sistema brasileiro de classificação de solos (Vol. 412). Rio de Janeiro, RJ: Embrapa.
Euclides, V. P. B., Macedo, M. C. M., & Oliveira, M. P. (1998). Produção de bovinos em pastagens de
Brachiaria spp. consorciadas com Calopogonium
mucunoides nos cerrados. Revista Brasileira de Zootecnia, 27(2), 238-245.
Fonseca, L., Mezzalira, J. C., Bremm, C., Gonda, H. L., & Carvalho, P. C. F. (2012). Management targets for maximising the short-term herbage intake rate of cattle grazing in Sorghum bicolor. Livestock Science, 145(1), 205-211.
Gildersleeve, R. R., Ocumpaugh, W. R., Quesenberry, K. H., & Moore, J. E. (1987). Mob-grazing of morphologically different Aeschynomene species [legumes; feed preferences; beef cattle; feed evaluation]. Tropical Grasslands, 21(3), 123-132.
Griffiths, W. M., Hodgson, J., & Arnold, G. C. (2003). The influence of sward canopy structure on foraging decisions by grazing cattle. I. Patch selection. Grass and Forage Science, 58(2), 112-124.
Jones, R. M. (1993). Persistence of Arachis pintoi cv. Amarillo on three soil types at Samford, south-eastern Queensland. Tropical Grasslands, 27(1), 11-15.
Kottek, M., Grieser, J., Beck, C., Rudolf, B., & Rubel, F. (2006). World map of the Köppen-Geiger climate classification updated. Meteorologische Zeitschrift, 15(3), 259-263.
Miranda, C. H. B., Vieira, A., & Cadisch, G. (2003). Determinação da fixação biológica de nitrogênio no amendoim forrageiro (Arachis spp.) por intermédio da abundância natural de 15N. Revista Brasileira de Zootecnia, 32(6), 1859-1865.
Parsons, A. J., Leafe, E. L., Collett, B., Penning, P. D., & Lewis, J. (1983). The physiology of grass production under grazing. II. Photosynthesis, crop growth and animal intake of continuously-grazed swards. Journal of Applied Ecology, 20(3), 127-139.
Pedreira, B. C., Pedreira, C. G. S., & Silva, C. S. (2007). Estrutura do dossel e acúmulo de forragem de Brachiaria brizantha cultivar Xaraés em resposta a estratégias de pastejo. Pesquisa Agropecuária Brasileira, 42(2), 281-287.
Pereira, L. E. T., Paiva, A. J., Geremia, E. V., & Silva, S. C. (2014). Components of herbage accumulation in elephant grass cvar Napier subjected to strategies of intermittent stocking management. The Journal of Agricultural Science, 152(6), 954-966.
Piepho, H. P., Büchse, A., & Emrich, K. (2003). A hitchhiker's guide to mixed models for randomized experiments. Journal of Agronomy and Crop Science, 189(5), 310-322.
Schulze, E. D., Luyssaert, S., Ciais, P., Freibauer, A., Janssens, I. A., Soussana, J. F., ... Thiruchittampalam, B. (2009). Importance of methane and nitrous oxide for Europe's terrestrial greenhouse-gas balance. Nature Geoscience, 2(12), 842-850.
Silva, C. C. F., Bonomo, P., Pires, A. J. V., Maranhão, C. M. A., Patês, N. M. S., & Santos, L. C. (2009). Características morfogênicas e estruturais de duas espécies de braquiária adubadas com diferentes doses de nitrogênio. Revista Brasileira de Zootecnia, 38(4), 657-661.
Silva, S. C., & Nascimento Júnior, D. (2007). Avanços na pesquisa com plantas forrageiras tropicais em pastagens: características morfofisiológicas e manejo do pastejo. Revista Brasileira de Zootecnia, 36(Sup.), 122-138.
Silveira, M. C. T., Silva, S. C., Souza Júnior, S. J., Barbero, L. M., Rodrigues, C. S., Limão, V. A., ... Nascimento Júnior, D. (2013). Herbage accumulation and grazing losses on Mulato grass subjected to strategies of rotational stocking management. Scientia Agricola, 70(4), 242-249.
Stitt, M., & Krapp, A. (1999). The interaction between elevated carbon dioxide and nitrogen nutrition: the physiological and molecular background. Plant, Cell & Environment, 22(6), 583-621.
Acta Scientiarum. Animal Sciences Maringá, v. 38, 4, p. 395-404, Oct-Dec., 2016
Trindade, J. K., Silva, S. C., Souza Júnior, S. J., Giacomini, A. A., Zeferino, C. V., Guarda, V. A., & Carvalho, P. C. F. (2007). Composição morfológica da forragem consumida por bovinos de corte durante o rebaixamento do capim-marandu submetido a estratégias de pastejo rotativo. Pesquisa Agropecuária Brasileira, 42(6), 883-890.
Valls, J. F. M., & Simpson, C. E. (2005). New species of Arachis (leguminosae) from Brazil, Paraguay and Bolivia. Bonplandia, 14(1), 35-63.
Villarreal, M., Cochran, R. C., Villalobos, L., Roja-Bourrillón,
A., Rodríguez, R., & Wickersham, T. A. (2005).
Dry-matter yields and crude protein and
rumen-degradable protein concentrations of three Arachis
pintoi ecotypes at different stages of regrowth in the humid tropics. Grass and Forage Science, 60(3), 237-243. Wilson, J. W. (1960). Inclined point quadrats. New
Phytologist, 59(1), 1-7.
Yang, R. C. (2010). Towards understanding and use of mixed-model analysis of agricultural experiments. Canadian Journal of Plant Science, 90(5), 605-627. Zanini, G. D., Santos, G. T., & Sbrissia, A. F. (2012).
Frequencies and intensities of defoliation in Aruana guineagrass swards: Morphogenetic and structural characteristics. Revista Brasileira de Zootecnia, 41(8), 1848-1857.
Received on June, 8, 2016. Accepted on July, 14, 2016.
License information: This is an open-access article distributed under the terms of the Creative Commons Attribution License, which permits unrestricted use, distribution, and reproduction in any medium, provided the original work is properly cited.