Starches from non - conventional sources to improve the technological
characteristics of pound cake
Amido de fontes não - convencionais para melhorar as características tecnológicas de bolo inglês
Eveline Lopes AlmeidaI André Luis MarangoniI Caroline Joy SteelI* ISSN 0103-8478
ABSTRACT
This study evaluated and compared the effect of the utilization of fi ve different non-conventional starches (chickpea, common bean, Peruvian carrot, sweet potato and white bean) and four different commercial starches (cassava, corn, potato and rice) in pound cake. Common bean starch, followed by Peruvian carrot starch were the non-conventional starch sources that showed tendency to improve the technological quality of pound cake, mainly in relation to corn starch, the most common commercial source. With these sources, the batters presented lower specifi c gravity and the cakes presented higher specifi c volume, lighter color, lower crumb moisture reduction during the storage period, and better texture attributes during all the cake shelf-life. Moreover, common bean starch provided higher scores in the cake sensory evaluation; especially for grain and texture attributes (moisture, tenderness and softness). Chickpea and white bean starches were more similar to corn starch in pound cake application.
Key words: bean, chickpea, Peruvian carrot, potato, cassava, starch, pound cake.
RESUMO
Este estudo avaliou e comparou o efeito da utilização de cinco amidos de fontes não convencionais (grão de bico, feijão carioca, mandioquinha, batata doce e feijão branco) e de quatro diferentes amidos de fontes comerciais (mandioca, milho, batata e arroz) em bolo inglês. Amido de feijão carioca, seguido pelo amido de mandioquinha, foram os amidos de fontes não convencionais que mostraram tendência a melhorar a qualidade tecnológica do bolo inglês, principalmente em comparação com o amido de milho, o qual é a fonte comercial mais utilizada. Com o amido dessas fontes, os batidos apresentaram menores valores de gravidade específi ca e os bolos maiores valores de volume específi co, cor mais clara, menor redução da umidade durante o período de estocagem e melhores valores nos atributos de textura durante a vida de prateleira. Além disso, amido de feijão carioca promoveu maiores escores na avalição sensorial; especialmente para os atributos do
miolo e textura (umidade, suavidade e maciez). Amidos de grão de bico e feijão branco foram muito similares ao amido de milho em aplicação em bolo inglês.
Palavras-chave: feijão, grão de bico, mandioquinha, batata, mandioca, amido, bolo inglês.
INTRODUCTION
Cakes and breads are the products that have the highest consumption rate among baked goods (SOZER et al., 2011a). Cake quality is affected by the ingredients used in an appropriate and properly balanced formulation, and mixing and baking procedures (TIREKI, 2008). Many types of
fl ours are available for the production of cakes and it is important that suffi cient attention is given to choose the correct type for the process. For sponge goods, a soft fl our should be used and, in some types of goods, a proportion of corn starch is sometimes added to make the fl our softer and produce articles of a better texture (BENNION & BAMFORD, 1997).
The development of cake structure starts in the mixing stage, through the incorporation of air cells in the system and continues in the baking stage, through the conversion of the aerated emulsion of the cake batter to a product with a semisolid porous structure and a soft crumb. Final product texture is set by starch gelatinization and protein coagulation during baking (SAHIN, 2008). During the initial phase of baking, there is a drop in batter viscosity as
IDepartamento de Tecnologia dos Alimentos, Faculdade de Engenharia dos Alimentos, Universidade Estadual de Campinas (UNICAMP),
shortening melts and sugars become dissolved. This is followed by a rapid rise in viscosity when starch becomes gelatinized, absorbing free water and setting the cake (HOWARD et al., 1968; SHELKE et al., 1990).
Therefore, starch is one of the components responsible for the structure and fi nal result of cakes. HOWARD et al. (1968) evaluated the utilization of various types of unmodifi ed granular starches (wheat, corn, potato, rice, arrowroot, waxy rice) in high-sugar batters. They concluded that the variation in performance was due to the gelatinization properties of the various starch samples. In addition to infl uencing structure, starch can infl uence other cake characteristics, as its susceptibly to staling can be related to starch retrogradation, especially amylopectin retrogradation, and to gluten-starch interactions (LAI & LIN, 2006).
In view of above, the objective of this study was to evaluate and compare the effect of the utilization of different non-conventional (chickpea, common bean, Peruvian carrot, sweet potato and white bean) and commercial (cassava, corn, potato and rice) starches on the technological characteristics of pound cake.
MATERIAL AND METHODS
The starches from non-conventional sources (chickpea, common bean, Peruvian carrot, sweet potato, and white bean) used for cake preparation were extracted in the laboratory, as described below. The commercial starches used were Melojel native corn starch (National Starch & Chemical, Trombudo Central, Brazil), Amilogill 1500 cassava starch (Cargill, São Paulo, Brazil), Avebe potato starch (Avebe do Brasil Ltda, São Paulo, Brazil), Amitec 100 rice fl our (Amitec Indústria e Comércio de Amidos Ltda, Goioerê, Brazil). The other ingredients used for cake production (wheat fl our, refi ned sugar, margarine, skimmed milk powder, baking powder, salt and eggs) were obtained in the local market.
Peruvian carrot and sweet potato, previously selected, were passed through a conveyor belt and received an aspersion of chlorinated water. They were then peeled by abrasion, cut in cubes and immersed in a 0.01% solution of sodium metabisulphite. Chickpea, common bean and white bean, also previously selected, were macerated in a 0.01% solution of sodium metabisulphite for 24h. All these raw-materials were crushed through chopper knives and ground in a depulper, where part of the
fi bers were eliminated. The fi bers that remained were
removed by passing the starch milk through a 70μm sieve. The starch milk was left to rest for 24h at 8ºC and the separation of protein from starch was then carried out using a hydrocyclone. The underfl ow obtained was left to rest for 3h. The supernatant was removed and the sedimented starch was dried in an oven at 45ºC for 48h. To reduce particle size, the starch was ground in a hammer mill.
The formulation used for cake preparation was wheat fl our (29.77%), refi ned sugar (25.60%), water (17.83%), eggs (11.38%), margarine (9.96%), starch (2.98%), skimmed milk powder (1.42%), baking powder (0.64%) and salt (0.42%). The batters were prepared in a Hobart 34 mixer (Siam-Util S/A, São Paulo, Brazil). For each formulation, a 5kg batch was prepared. Margarine and sugar were mixed during 1min at slow speed; then eggs were added and mixed for 5min at high speed. Half of the water was added and mixed with the cream for 5min at slow speed. Wheat fl our, starch, skimmed milk powder and salt (previously homogenized) and the remaining half of water were added to the cream and mixed for 1min at slow speed. At the end, the baking powder was added and mixed for 2min at slow speed. The batter (400g) was put in pound cake pans and was baked in a Hyppo HF4B oven (Hyppolito, Ferraz de Vasconcelos, Brazil) for 35min at 160ºC. The cakes were left for 1h at room temperature for cooling. Then, they were packed in polypropylene bags and stored at room temperature in a dry place until analyses.
Method 44-10.01 (AACC, 2010). Texture profi le analysis (TPA) was determined in a texture analyzer, TA-XT2i (Stable Micro Systems, Surrey, UK), using a P/100 aluminum probe (compression platens of 100mm diameter) and the following parameters: measurement of force in compression; pre-test speed = 5.0m s-1; test speed = 2.0m s-1; post-test speed = 5.0m s-1; force = 20g; cycle count = 5s and trigger force = 10g. The texture attributes evaluated were: hardness, springiness, cohesiveness, gumminess, chewiness and resilience. For instrumental texture determination, cakes were previously sliced with an electric slicer into 1.25cm thick slices. The evaluation was carried out through compression of the probe on two central slices, disposed horizontally on the platform.
All analyses were carried out in three replicates, except texture profi le analysis, which was carried out in six replicates. The data collected was subjected to analysis of variance (ANOVA) and the Tukey test using the SAS program for Windows V8 (SAS Institute Inc., Cary, USA). Least signifi cant differences at P<0.05 were used to compare sample means.
RESULTS AND DISCUSSION
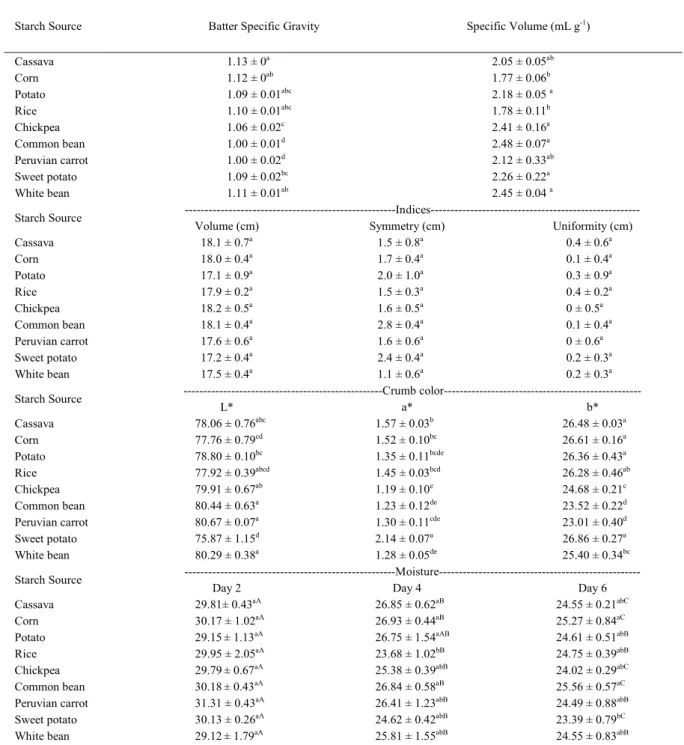
Batter specifi c gravity and cake specifi c volume Amongst conventional starch sources (cassava, corn, potato and rice), no signifi cant differences were found for their effect on specifi c gravity (Table 1). Batters prepared with common bean and Peruvian carrot starches presented the lowest values for specifi c gravity, diverging from other batters. A low value for specifi c gravity is usually desirable, indicating greater air incorporation by the batter (AIB, 2001). Specifi c gravity of batters made with non-conventional starch sources such as sweet potato, white bean, and cassava did not differ from corn starch, a more commonly used conventional starch source. Chickpea starch provided lower specifi c gravity than corn starch. The values of specifi c volume ranged from 1.77mL g-1 for the cakes formulated with corn starch to 2.48mL g-1 for the cakes formulated with common bean starch. In this case, the lowest batter density refl ected in the highest specifi c volume. A good-quality cake should have high volume (SOZER et al., 2011b). Cassava and Peruvian carrot starches provided cakes with specifi c volume that did not differ from cakes elaborated with corn starch. Starches from other non-conventional sources such as sweet potato, white bean, common bean and chickpea provided higher specifi c volumes than cakes made with the conventional sources corn
and rice starches. The legume, root and tuber starches provided higher specifi c volumes than the cereal starches. In general, an inverse relationship between batter density and cake specifi c volume was not observed.
Volume, symmetry and uniformity indices
The values for volume, symmetry and uniformity indices were very close to one another (Table 1). Therefore, no signifi cant differences (P<0.05) were observed among the cakes prepared with the different starch sources, considering all indices. This shows that, independent of the starch source used, it did not interfere in these indices, which are evaluations of external measurements of the cakes. In general, cakes presented good values for these indices. For volume index, the values ranged between 17.1 and 18.2cm. According to GÓMEZ et al. (2008), the volume index is an indicator of cake volume and follows a similar tendency as volume. However, this similar tendency was not obtained. Differences in the volume index were not found among the cakes, whereas differences in the specifi c volume were observed.The symmetry index values ranged between 1.1 and 2.8cm. This shows that the cake center was slightly higher than its extremities. In other words, the cakes showed a slight elevation on the superior part, which is characteristic of pound cakes due to the opening that occurs in the top center of the cake. The uniformity index ranged between 0 and 0.4cm. Due to the low value presented by this index, it was observed that the two extremities of the cake showed similar or the same height.
Instrumental color
non-conventional sources more similar to corn starch in cake application in relation to instrumental color.
Sensory evaluation
The mean scores given by the panelists in the sensory evaluation of the cakes are presented
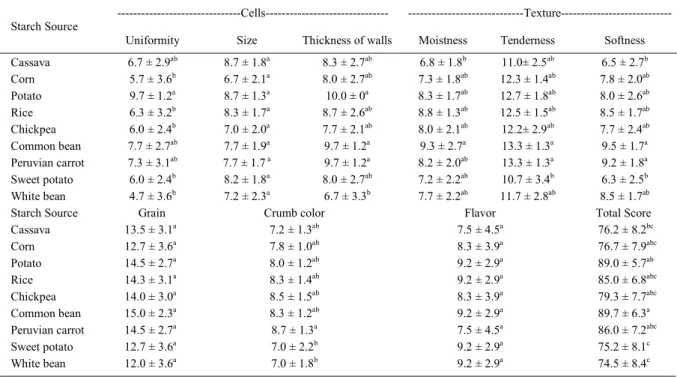
in table 2. All the cakes were well evaluated. The cakes prepared with chickpea, common bean, corn, Peruvian carrot, potato and rice starches were the best evaluated cakes according to the sensory panel. The cake elaborated with common bean obtained a higher total score mainly because of the higher scores for
Table 1 - Physical properties of the batter and cakes prepared with starches from different sources.
Starch Source Batter Specific Gravity Specific Volume (mL g-1)
Cassava 1.13 ± 0a 2.05 ± 0.05ab
Corn 1.12 ± 0ab 1.77 ± 0.06b
Potato 1.09 ± 0.01abc 2.18 ± 0.05 a
Rice 1.10 ± 0.01abc 1.78 ± 0.11b
Chickpea 1.06 ± 0.02c 2.41 ± 0.16a
Common bean 1.00 ± 0.01d 2.48 ± 0.07a
Peruvian carrot 1.00 ± 0.02d 2.12 ± 0.33ab
Sweet potato 1.09 ± 0.02bc 2.26 ± 0.22a
White bean 1.11 ± 0.01ab 2.45 ± 0.04 a
---Indices---Starch Source
Volume (cm) Symmetry (cm) Uniformity (cm)
Cassava 18.1 ± 0.7a 1.5 ± 0.8a 0.4 ± 0.6a
Corn 18.0 ± 0.4a 1.7 ± 0.4a 0.1 ± 0.4a
Potato 17.1 ± 0.9a 2.0 ± 1.0a 0.3 ± 0.9a
Rice 17.9 ± 0.2a 1.5 ± 0.3a 0.4 ± 0.2a
Chickpea 18.2 ± 0.5a 1.6 ± 0.5a 0 ± 0.5a
Common bean 18.1 ± 0.4a 2.8 ± 0.4a 0.1 ± 0.4a
Peruvian carrot 17.6 ± 0.6a 1.6 ± 0.6a 0 ± 0.6a
Sweet potato 17.2 ± 0.4a 2.4 ± 0.4a 0.2 ± 0.3a
White bean 17.5 ± 0.4a 1.1 ± 0.6a 0.2 ± 0.3a
---Crumb color---Starch Source
L* a* b*
Cassava 78.06 ± 0.76abc 1.57 ± 0.03b 26.48 ± 0.03a
Corn 77.76 ± 0.79cd 1.52 ± 0.10bc 26.61 ± 0.16a
Potato 78.80 ± 0.10bc 1.35 ± 0.11bcde 26.36 ± 0.43a
Rice 77.92 ± 0.39abcd 1.45 ± 0.03bcd 26.28 ± 0.46ab
Chickpea 79.91 ± 0.67ab 1.19 ± 0.10e 24.68 ± 0.21c
Common bean 80.44 ± 0.63a 1.23 ± 0.12de 23.52 ± 0.22d
Peruvian carrot 80.67 ± 0.07a 1.30 ± 0.11cde 23.01 ± 0.40d
Sweet potato 75.87 ± 1.15d 2.14 ± 0.07a 26.86 ± 0.27a
White bean 80.29 ± 0.38a 1.28 ± 0.05de 25.40 ± 0.34bc
---Moisture---Starch Source
Day 2 Day 4 Day 6
Cassava 29.81± 0.43aA 26.85 ± 0.62aB 24.55 ± 0.21abC
Corn 30.17 ± 1.02aA 26.93 ± 0.44aB 25.27 ± 0.84aC
Potato 29.15± 1.13aA 26.75 ± 1.54aAB 24.61 ± 0.51abB
Rice 29.95 ± 2.05aA 23.68 ± 1.02bB 24.75 ± 0.39abB
Chickpea 29.79± 0.67aA 25.38 ± 0.39abB 24.02 ± 0.29abC
Common bean 30.18± 0.43aA 26.84 ± 0.58aB 25.56 ± 0.57aC
Peruvian carrot 31.31 ± 0.43aA 26.41 ± 1.23abB 24.49 ± 0.88abB
Sweet potato 30.13 ± 0.26aA 24.62 ± 0.42abB 23.39 ± 0.79bC
White bean 29.12± 1.79aA 25.81 ± 1.55abB 24.55 ± 0.83abB
grain and texture attributes (moisture, tenderness and softness). The cake elaborated with white bean obtained lower scores for cells (uniformity and thickness of walls) and crumb color attributes. The cake elaborated with sweet potato also had lower scores for these attributes and also for texture attributes (tenderness and softness). The sensory panel did not verify signifi cant differences between the cakes elaborated with all the starch sources studied in the attributes size of cell, grain and
fl avor. The cakes prepared with the commercial sources (corn, cassava, potato and rice) did not present signifi cant differences among themselves in all the attributes evaluated, except in the attribute uniformity of cells. In this attribute, the cake elaborated with potato starch was better than the cakes elaborated with corn and rice starches. Crumb moisture
The crumb of cakes presented a tendency to lose moisture during storage (Table 1). The cakes were packed in polypropylene bags. Thus, a migration of moisture from crumb to crust possibly occurred. There was a gradual reduction of moisture from day 2 to day 6 in the crumb of
cakes elaborated with all starches sources. This reduction tends to be lower in the cakes elaborated with Peruvian carrot, potato, rice and white bean starches. In these cakes, crumb moisture found on day 6 did not differ from crumb moisture found on day 4. This shows that these starch sources tended to retain crumb moisture until the sixth day of storage. On the second day of shelf-life, the cakes elaborated with the different starch sources did not present statistical differences for crumb moisture. On the fourth and sixth days of shelf-life, the differences for crumb moisture were small. Comparing with the cake elaborated with corn starch (most used commercial source), the only cakes that presented a statistical difference were the cake elaborated with potato starch on the fourth day and the cake elaborated with sweet potato starch on the sixth day. The moisture of these cakes was lower in relation to the cake elaborated with corn starch.
Texture profi le analysis (TPA)
With the increase of storage time, a tendency of an increase of hardness and chewiness,
Table 2 -Sensory evaluation scores of cakes prepared with starches from different sources.
---Cells---
---Texture---Starch Source
Uniformity Size Thickness of walls Moistness Tenderness Softness
Cassava 6.7 ± 2.9ab 8.7 ± 1.8a 8.3 ± 2.7ab 6.8 ± 1.8b 11.0± 2.5ab 6.5 ± 2.7b
Corn 5.7 ± 3.6b 6.7 ± 2.1a 8.0 ± 2.7ab 7.3 ± 1.8ab 12.3 ± 1.4ab 7.8 ± 2.0ab
Potato 9.7 ± 1.2a 8.7 ± 1.3a 10.0 ± 0a 8.3 ± 1.7ab 12.7 ± 1.8ab 8.0 ± 2.6ab
Rice 6.3 ± 3.2b 8.3 ± 1.7a 8.7 ± 2.6ab 8.8 ± 1.3ab 12.5 ± 1.5ab 8.5 ± 1.7ab
Chickpea 6.0 ± 2.4b 7.0 ± 2.0a 7.7 ± 2.1ab 8.0 ± 2.1ab 12.2± 2.9ab 7.7 ± 2.4ab
Common bean 7.7 ± 2.7ab 7.7 ± 1.9a 9.7 ± 1.2a 9.3 ± 2.7a 13.3 ± 1.3a 9.5 ± 1.7a
Peruvian carrot 7.3 ± 3.1ab 7.7 ± 1.7 a 9.7 ± 1.2a 8.2 ± 2.0ab 13.3 ± 1.3a 9.2 ± 1.8a
Sweet potato 6.0 ± 2.4b 8.2 ± 1.8a 8.0 ± 2.7ab 7.2 ± 2.2ab 10.7 ± 3.4b 6.3 ± 2.5b
White bean 4.7 ± 3.6b 7.2 ± 2.3a 6.7 ± 3.3b 7.7 ± 2.2ab 11.7 ± 2.8ab 8.5 ± 1.7ab
Starch Source Grain Crumb color Flavor Total Score
Cassava 13.5 ± 3.1a 7.2 ± 1.3ab 7.5 ± 4.5a 76.2 ± 8.2bc
Corn 12.7 ± 3.6a 7.8 ± 1.0ab 8.3 ± 3.9a 76.7 ± 7.9abc
Potato 14.5 ± 2.7a 8.0 ± 1.2ab 9.2 ± 2.9a 89.0 ± 5.7ab
Rice 14.3 ± 3.1a 8.3 ± 1.4ab 9.2 ± 2.9a 85.0 ± 6.8abc
Chickpea 14.0 ± 3.0a 8.5 ± 1.5ab 8.3 ± 3.9a 79.3 ± 7.7abc
Common bean 15.0 ± 2.3a 8.3 ± 1.2ab 9.2 ± 2.9a 89.7 ± 6.3a
Peruvian carrot 14.5 ± 2.7a 8.7 ± 1.3a 7.5 ± 4.5a 86.0 ± 7.2abc
Sweet potato 12.7 ± 3.6a 7.0 ± 2.2b 9.2 ± 2.9a 75.2 ± 8.1c
White bean 12.0 ± 3.6a 7.0 ± 1.8b 9.2 ± 2.9a 74.5 ± 8.4c
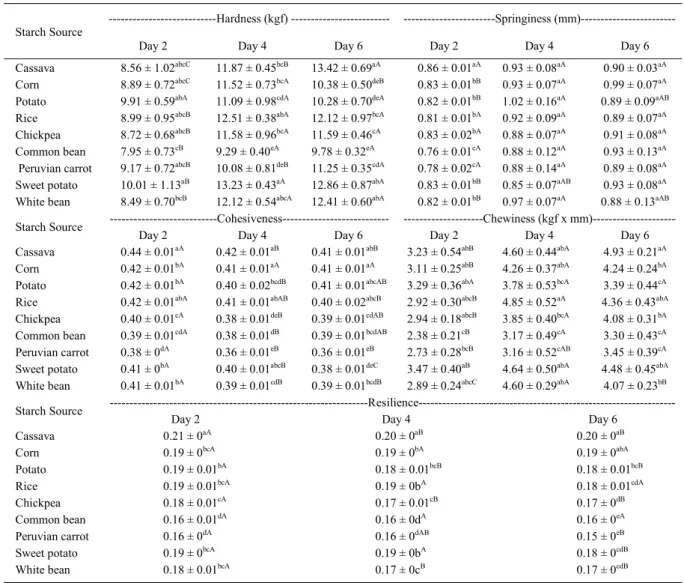
and a decrease of cohesiveness and resilience can be observed (Table 3). The cake elaborated with potato starch can be highlighted, as it did not present an increase of hardness during all the storage period and also the cake elaborated with Peruvian carrot, which maintained hardness values until day 4. In relation to springiness, some cakes showed an increase of this attribute from day 2 to day 4 and then maintained this attribute constant until day 6 (corn, potato, sweet potato and white bean) and others maintained the same springiness during all the storage period (cassava, chickpea, common bean, Peruvian carrot and rice). Another peculiarity about springiness is that it was the same for the cakes elaborated with all the starch sources studied on days 4 and 6 of storage. The cakes did not present statistical differences for springiness on these days.
The results obtained in the instrumental texture analysis had a direct relationship with the results obtained in the sensory evaluation. When hardness, chewiness and resilience results are observed, it can be seen that the cake elaborated with common bean tended to present the lowest values in relation to the cakes elaborated with the other starch sources on all the days of storage evaluated. The cake elaborated with this starch source was the cake that obtained the highest scores for the texture attributes evaluated (moisture, tenderness and softness).
As the cake elaborated with common bean, the cake elaborated with Peruvian carrot also tended to present lower values for chewiness and resilence during the storage period. It would be ideal that no increase or reduction of chewiness and resilience, respectively, occurred during storage. The cake elaborated with Peruvian carrot tended to present lower cohesiveness in relation to the others during all the storage period, which is not good. According to GÉLINAS et al. (1999), best textures were obtained when cakes showed the tendency to higher cohesiveness. The starch sources that provided the higher cake cohesiveness during all the days evaluated were cassava and rice.
For the cakes elaborated with the commercial starch sources, it can be observed that potato and rice starches presented all cake texture attribute values close to those provided by corn starch during all the storage period. Comparing the cakes elaborated with non-conventional sources and the cake elaborated with corn starch
(standard commercial starch), it can be observed that chickpea and white bean were the starch sources that yielded cakes with hardness that did not differ, on days 2 and 4, from the cakes elaborated with corn starch. Chewiness and springiness attributes among the cakes elaborated with these starch sources (chickpea, white bean and corn) did not present statistical differences during all the storage period. The cohesiveness and resilience attributes also did not differ on day 2 of storage. Therefore, chickpea and white bean were the non-conventional starches that provided cake texture properties more similar to the cake elaborated with corn starch, although there are some differences. Common bean was the non-conventional starch source, followed by Peruvian carrot, which showed a propensity to be better than corn starch in some texture attributes during all the cake shelf-life. Values for hardness and chewiness attributes for cakes elaborated with common bean and Peruvian carrot did not present differences or presented better values (lower) than the cake elaborated with corn starch.
CONCLUSION
Throughout this research, it was possible to verify differences in the technological characteristics of pound cake caused by the different starch sources used in the formulation. In general, it was possible to verify that the commercial starch sources (cassava, corn, potato and rice) did not yield differences in the technological quality of the cakes in which they were applied. It demonstrated the similarity of these commercial starch sources in the application.
REFERENCES
AACC. Approved methods of the American Association of Cereal Chemists. St Paul: Approved Methods Committee, 2010. Avalaible from: <http://methods.aaccnet.org/>. Accessed: jan 8, 2013. AIB. Science of baking: cake and sweet goods. Manhattan: American Institute of Baking International, 2001.
BENNION, E.B.; BAMFORD, G.S.T. The technology of cake making. London: Chapman & Hall, 1997. 421p.
GÉLINAS, P. et al. Relative effects of ingredients on cake staling based on an accelerated shelf-life test. Journal of Food Science, v.64, p.937-940, 1999. Available from: <http:// onlinelibrary.wiley.com/doi/10.1111/j.1365-2621.1999.tb15944.x/ abstract>. Accessed: jan. 8, 2013. doi: 10.1111/j.1365-2621.1999. tb15944.x.
GÓMEZ, M. et al. Studies on cake quality made of wheat-chickpea fl our blends. LWT - Food Science and Technology, v.41, p.1701-1709, 2008. Available from: <http://www.sciencedirect.com/ science/article/pii/S0023643807003805>. Accessed: jan. 8, 2013. doi: 10.1016/j.lwt.2007.11.024.
HOWARD, N.B. et al. Function of the starch granule in the formation of layer cake structure. Cereal Chemistry, v.45, p.329-338, 1968. Available from: <http://www.aaccnet.org/publications/cc/ backissues/1968/Documents/chem45_329.pdf>. Accessed: jan. 8, 2013. LAI, H.-M.; LIN, T.-C. Bakery products. In: HUI, Y.H. Handbook of food science, technology and engineering. Boca Raton: CRC, 2006. Cap.148, p.148.1-148.51.
SAHIN, S. Cake batter rheology. In: SUMNU, S.G.; SAHIN, S. Food engineering aspects of baking sweet goods. Boca Raton: CRC, 2008. p.99-119.
Table 3 - Texture profile analysis of cakes after two, four and six days from baking.
---Hardness (kgf) --- ---Springiness
(mm)---Starch Source
Day 2 Day 4 Day 6 Day 2 Day 4 Day 6
Cassava 8.56 ± 1.02abcC 11.87 ± 0.45bcB 13.42 ± 0.69aA 0.86 ± 0.01aA 0.93 ± 0.08aA 0.90 ± 0.03aA
Corn 8.89 ± 0.72abcC 11.52 ± 0.73bcA 10.38 ± 0.50deB 0.83 ± 0.01bB 0.93 ± 0.07aA 0.99 ± 0.07aA
Potato 9.91 ± 0.59abA 11.09 ± 0.98cdA 10.28 ± 0.70deA 0.82 ± 0.01bB 1.02 ± 0.16aA 0.89 ± 0.09aAB
Rice 8.99 ± 0.95abcB 12.51 ± 0.38abA 12.12 ± 0.97bcA 0.81 ± 0.01bA 0.92 ± 0.09aA 0.89 ± 0.07aA
Chickpea 8.72 ± 0.68abcB 11.58 ± 0.96bcA 11.59 ± 0.46cA 0.83 ± 0.02bA 0.88 ± 0.07aA 0.91 ± 0.08aA
Common bean 7.95 ± 0.73cB 9.29 ± 0.40eA 9.78 ± 0.32eA 0.76 ± 0.01cA 0.88 ± 0.12aA 0.93 ± 0.13aA
Peruvian carrot 9.17 ± 0.72abcB 10.08 ± 0.81deB 11.25 ± 0.35cdA 0.78 ± 0.02cA 0.88 ± 0.14aA 0.89 ± 0.08aA
Sweet potato 10.01 ± 1.13aB 13.23 ± 0.43aA 12.86 ± 0.87abA 0.83 ± 0.01bB 0.85 ± 0.07aAB 0.93 ± 0.08aA
White bean 8.49 ± 0.70bcB 12.12 ± 0.54abcA 12.41 ± 0.60abA 0.82 ± 0.01bB 0.97 ± 0.07aA 0.88 ± 0.13aAB
---Cohesiveness--- ---Chewiness (kgf x
mm)---Starch Source
Day 2 Day 4 Day 6 Day 2 Day 4 Day 6
Cassava 0.44 ± 0.01aA 0.42 ± 0.01aB 0.41 ± 0.01abB 3.23 ± 0.54abB 4.60 ± 0.44abA 4.93 ± 0.21aA
Corn 0.42 ± 0.01bA 0.41 ± 0.01aA 0.41 ± 0.01aA 3.11 ± 0.25abB 4.26 ± 0.37abA 4.24 ± 0.24bA
Potato 0.42 ± 0.01bA 0.40 ± 0.02bcdB 0.41 ± 0.01abcAB 3.29 ± 0.36abA 3.78 ± 0.53bcA 3.39 ± 0.44cA
Rice 0.42 ± 0.01abA 0.41 ± 0.01abAB 0.40 ± 0.02abcB 2.92 ± 0.30abcB 4.85 ± 0.52aA 4.36 ± 0.43abA
Chickpea 0.40 ± 0.01cA 0.38 ± 0.01deB 0.39 ± 0.01cdAB 2.94 ± 0.18abcB 3.85 ± 0.40bcA 4.08 ± 0.31bA
Common bean 0.39 ± 0.01cdA 0.38 ± 0.01dB 0.39 ± 0.01bcdAB 2.38 ± 0.21cB 3.17 ± 0.49cA 3.30 ± 0.43cA
Peruvian carrot 0.38 ± 0dA 0.36 ± 0.01eB 0.36 ± 0.01eB 2.73 ± 0.28bcB 3.16 ± 0.52cAB 3.45 ± 0.39cA
Sweet potato 0.41 ± 0bA 0.40 ± 0.01abcB 0.38 ± 0.01deC 3.47 ± 0.40aB 4.64 ± 0.50abA 4.48 ± 0.45abA
White bean 0.41 ± 0.01bA 0.39 ± 0.01cdB 0.39 ± 0.01bcdB 2.89 ± 0.24abcC 4.60 ± 0.29abA 4.07 ± 0.23bB
---Resilience---Starch Source
Day 2 Day 4 Day 6
Cassava 0.21 ± 0aA 0.20 ± 0aB 0.20 ± 0aB
Corn 0.19 ± 0bcA 0.19 ± 0bA 0.19 ± 0abA
Potato 0.19 ± 0.01bA 0.18 ± 0.01bcB 0.18 ± 0.01bcB
Rice 0.19 ± 0.01bcA 0.19 ± 0bA 0.18 ± 0.01cdA
Chickpea 0.18 ± 0.01cA 0.17 ± 0.01cB 0.17 ± 0dB
Common bean 0.16 ± 0.01dA 0.16 ± 0dA 0.16 ± 0eA
Peruvian carrot 0.16 ± 0dA 0.16 ± 0dAB 0.15 ± 0eB
Sweet potato 0.19 ± 0bcA 0.19 ± 0bA 0.18 ± 0cdB
White bean 0.18 ± 0.01bcA 0.17 ± 0cB 0.17 ± 0cdB
* Mean ± standard deviation, n=6. Means followed by the same lower case letter on the same column for the same parameter do not differ
SHELKE, K. et al. The dynamics of cake baking as studied by a combination of viscometry and electrical resistance oven heating. Cereal Chemistry, v.67, p.575-580, 1990. Available from: <http://www.aaccnet.org/publications/cc/backissues/1990/ Documents/67_575.pdf>. Accessed: jan. 8, 2013.
SOZER, N. et al. Improvement of shelf life stability of cakes. Journal of Food Quality, v.34, p.151-162, 2011a. Available: <http://onlinelibrary. wiley.com/doi/10.1111/j.1745-4557.2011.00379.x/abstract>. Accessed: jan. 8, 2013. doi: 10.1111/j.1745-4557.2011.00379.x.
SOZER, N. et al. Textural properties and their correlation to cell structure in porous food materials. Journal of Agricultural and Food Chemistry, v.59, p.1498-1507, 2011b. Available: <http://pubs.acs.org/doi/abs/10.1021/ jf103766x>. Accessed em: jan. 8, 2013. doi: 10.1021/ jf103766x.