Sample size for estimation of the Pearson correlation
coefficient in cherry tomato tests
Tamanho de amostra para estimar o coeficiente de correlação de Pearson em ensaios com tomate cereja
Bruno Giacomini Sari1* Alessandro Dal’Col Lúcio2 Cinthya Souza Santana1
Dionatan Ketzer Krysczun1 André Luís Tischler3 Lucas Drebes3
ISSNe 1678-4596
INTRODUCTION
When several variables are measured in an essay, there is a possibility to study the linear relation between them. This type of information is mainly used in plant breeding and involves
identifying variables that can be used in indirect selection of superior genotypes (CRUZ & REGAZZI, 1997). In addition, knowledge of the relation between productivity parameters and total fruit yield may assist in the improvement or choice of management practices.
1Programa de Pós-graduação em Agronomia, Universidade Federal de Santa Maria (UFSM), Avenida Roraima, 1000, Camobi, 97105-900,
Santa Maria, RS, Brasil. E-mail: brunosari@hotmail.com. *Corresponding author.
2Departamento de Fitotecnia, Centro de Ciências Rurais (CCR), Universidade Federal de Santa Maria (UFSM), Santa Maria, RS, Brasil. 3Departamento de Agronomia, Centro de Ciências Rurais (CCR), Universidade Federal de Santa Maria (UFSM), Santa Maria, RS, Brasil.
ABSTRACT: The aim of this study was to determine the required sample size for estimation of the Pearson coefficient of correlation between
cherry tomato variables. Two uniformity tests were set up in a protected environment in the spring/summer of 2014. The observed variables in each plant were mean fruit length, mean fruit width, mean fruit weight, number of bunches, number of fruits per bunch, number of fruits, and total weight of fruits, with calculation of the Pearson correlation matrix between them. Sixty eight sample sizes were planned for one greenhouse and 48 for another, with the initial sample size of 10 plants, and the others were obtained by adding five plants. For each planned sample size, 3000 estimates of the Pearson correlation coefficient were obtained through bootstrap re-samplings with replacement. The sample size for each correlation coefficient was determined when the 95% confidence interval amplitude value was less than or equal to 0.4. Obtaining estimates of the Pearson correlation coefficient with high precision is difficult for parameters with a weak linear relation. Accordingly, a larger sample size is necessary to estimate them. Linear relations involving variables dealing with size and number of fruits per plant have less precision. To estimate the coefficient of correlation between productivity variables of cherry tomato, with a confidence interval of 95% equal to 0.4, it is necessary to sample 275 plants in a 250m² greenhouse, and 200 plants in a 200m² greenhouse.
Key words: Solanum lycopersicum var. cerasiforme, sampling, resampling, bootstrap.
RESUMO: O objetivo deste trabalho foi determinar o tamanho de amostra necessário para estimar o coeficiente de correlação de Pearson entre
variáveis do tomate cereja. Foram instalados dois ensaios de uniformidade em ambiente protegido na primavera/verão de 2014. As variáveis observadas em cada planta foram comprimento médio de fruto, largura média de fruto, peso médio de fruto, número de cachos, número de frutos por cacho, número de frutos e peso total de frutos, sendo calculada a matriz de correlação de Pearson entre elas. Foram planejados 68 tamanhos de amostra em uma estufa e 48 em outra, com tamanho inicial composto de 10 plantas e os demais obtidos acrescentando cinco plantas. Para cada tamanho de amostra planejado foram obtidas 3000 estimativas do coeficiente de correlação de Pearson através de reamostragens “bootstrap” com reposição. O tamanho de amostra de cada coeficiente de correlação foi determinado quando o valor da amplitude do intervalo de confiança de 95% foi menor ou igual a 0,4. A obtenção das estimativas do coeficiente de correlação de Pearson com elevada precisão é difícil para caracteres com relação linear fraca e, consequentemente, maior é o tamanho amostra necessário para estima-los. As relações lineares envolvendo as variáveis relacionadas com o tamanho e o número de frutos por planta tem menor precisão. Para estimar o coeficiente de correlação entre variáveis produtivas do tomate cereja, com intervalo de confiança de 95% igual a 0,4, é necessário amostrar 275 plantas na estufa de 250m², e 200 plantas na estufa de 200m².
Palavras-chave: Solanum lycopersicum var. cerasiforme, amostragem, reamostragem, ”bootstrap”.
Pearson correlation coefficient is a
dimensionless measure that determines a linear relation between two variables. Its value varies from -1, when there is a perfect negative linear relation, to +1, when there is a perfect positive linear relation. The closer this value to zero, the smaller is the degree of linear relation. From the Pearson correlation
coefficient, many other statistics are calculated,
such as partial correlation, direct and indirect effects between variables in track analysis, and canonical correlation (HAIR et al., 2005). Thus, the precision of these statistics depends on accuracy of the estimate
of Pearson’s correlation coefficient.
Sample size has a large impact on statistical
significance and interpretation of a statistical result. In large samples, the coefficients of low magnitude tend to show statistical significance, even when the
relation between the parameters is not important from the practical point of view. Nevertheless, when the sample size is small, the reliability of the estimates is low and may not represent the true relation between two variables (HAIR et al., 2005; CARGNELUTTI FILHO et al., 2010; CARGNELUTTI FILHO et al., 2011; CARGNELUTTI FILHO et al., 2012). Hence, we realized that an adequate sample size with acceptable accuracy is important.
The confidence interval of the Pearson correlation coefficient can be estimated from the
sampling distribution transformed by Fischer (FERREIRA, 2009; CARGNELUTTI FILHO et al., 2011). Another way to obtain it is by means of
bootstrap confidence intervals with replacement.
In this methodology, there is no need to know the variable’s probability distribution, and this approach is effective in the case of variables with an unknown or non normal distribution (CARGNELUTTI FILHO et al., 2010; CARGNELUTTI FILHO et al., 2012). This methodology is of great value because it can be
used to determine the confidence interval amplitude of
any variable and for any cultivated plant. The sample size required for estimation of the mean of parameters is common in the literature, but there are few studies that determine the sample size needed to estimate the
Pearson correlation coefficient (CARGNELUTTI
FILHO et al., 2010; CARGNELUTTI FILHO et al., 2011; CARGNELUTTI FILHO et al., 2012). In the
specific case of olive groves, studies determining a
sample size for estimation of the Pearson correlation
coefficient are practically nonexistent. Studies are
limited to only determine a sample size for the mean of parameters (SILVA et al., 2009; SANTOS et al., 2010; HAESBAERT et al., 2011; SILVA et al., 2011; LÚCIO et al., 2012).
The appropriate sample size will be related to the accuracy of the estimate of Pearson’s
correlation coefficient. In the case of cherry tomatoes,
there are no studies in the literature that make this determination. Consequently, the aim of the present study was to determine the sample size for estimation
of the Pearson correlation coefficient between
productivity variables of cherry tomato.
MATERIALS AND METHODS
Two uniformity tests were carried out in plastic greenhouses in the Plant Science Department of the Universidade Federal de Santa Maria (latitude 29°43’ S, longitude 53°43’ W and 95m altitude). Greenhouses were covered with a low density
polyethylene (LDPE) film, with 150 micron thickness
and an anti UV additive, placed in the north-south direction, and the greenhouses had the following dimensions: 1) 20 × 10m (200m²), 3m right foot and 4m in the central part; 2) 25 × 10m (250m²), 4m right foot and 5.5m in the central part. Climate at the site
of the experiments is classified as Cfa, and the soil is classified from Paleudalf (EMBRAPA, 2006).
A soil correction in the two greenhouses was performed 30 days before planting and served to raise pH to 6.5 and the phosphorus level to 300mg dm-3. Next, eight ridges were constructed in each
greenhouse, with 0.20m height and 0.30m width, and spaced at 1m. These ridges were covered with
a mulching black opaque LDPE film. Planting
fertilization was conducted by means of 150kg ha-1 N,
250kg ha-1 P, and 125kg ha-1 K for each greenhouse.
The cover fertilization was performed every 23 days, with 30kg ha-1 N, 15kg ha-1 P, and 30kg ha-1 K. All the
procedures were carried out based on soil chemical analysis and according to recommendations of the
Official Network of Soil and Plant Tissue Analysis
Laboratories of the states of Rio Grande do Sul and Santa Catarina (ROLAS, 2004).
The seedlings were Lily Hybrid Cherry tomatoes, and the transplant took place in the spring/
summer season, on October 26, 2014, during the first flowering. Spacing between seedlings was 0.5m.
Plants were vertically staked with a ribbon and driven on a double stem with elimination of lateral shoots. Every 14 days, sprays of calcium, boron, fungicides, and insecticides were administered to control pests, diseases, and physiological disturbances such as the “blossom end rot” of fruits.
the fruits were harvested, and the following variables were determined: total weight fruit (TWF), mean fruit length (MFL), mean fruit width (MFWi), mean fruit weight (MFW), number of bunches per plant (NBP), number of fruits per plant (NFP), and the number of fruits per bunch (NFB). Variables MFWi and MFL were measured in centimeters with a caliper. MFW and TWF were measured in grams using a scale with 0.01g precision.
From the observed data, two Pearson correlation matrices were constructed, one for each
for greenhouse. The correlation coefficients were tested for their significance by Student’s t test at an error probability of 5%. The third matrix (matrix of means) was compiled from the mean values of the
Pearson correlation coefficients of the two matrices
previously mentioned. A total of 68 sample sizes were planned for the 250m² greenhouse and 48 for the 200m² greenhouse. The initial size was 10 plants, and the others were calculated by adding
five plants. For each of them, 3000 estimates of the Pearson correlation coefficient were obtained
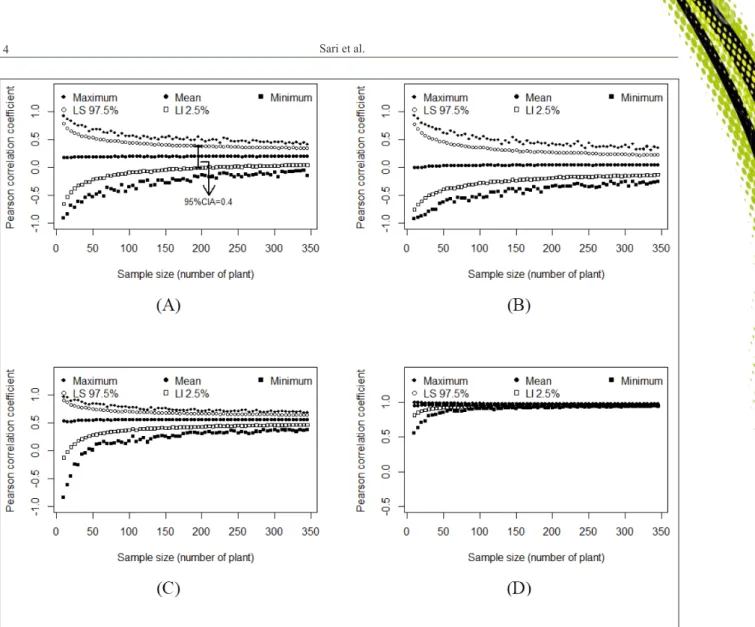
through bootstrap resampling with replacement. Later, from the 3000 estimates, we calculated the minimum value, 2.5% percentile, mean, 97.5% percentile, maximum value, and the 95%
confidence interval (the difference between the 97.5% and 2.5% percentiles). The confidence
interval, which represents the variation caused by the variable’s random behaviour can be represented by 1000 re-samplings; the larger the number of re-samplings, the more accurate is the interval (FERREIRA, 2009). Then, the use of the 3000 re-samplings had the objective to obtain intervals with high precision.
The amplitude of the confidence interval determines variability of the correlation coefficients
estimated by means of different sample sizes. The optimal sample size to estimate the Pearson
correlation coefficient was determined when the amplitude value of the 95% bootstrap confidence
interval was less than or equal to 0.4 (Figure 1a). We also calculated the mean of each of the 21 sample size estimates obtained for each of the two matrices. Data processing and statistical analysis were conducted using the R software (R DEVELOPMENT CORE
TEAM, 2012) and Microsoft Office Excel®.
RESULTS AND DISCUSSION
The Pearson correlation coefficients of the
21 pairs of parameters varied between -0.019 and 0.97 in the 200m² greenhouse and between -0.083
and 0.963 in the 250m² greenhouse. Of these, 20 had
statistical significance in the 200m² greenhouse and
12 in the 250m² greenhouse (Table 1). We reported
that the Pearson correlation coefficients, even at low magnitude, were statistically significant, as a
consequence of the large number of observations (347 in the 250m² greenhouse and 247 in the 200m²
greenhouse). This finding should be interpreted with
caution because a statistical test often indicates the presence of a linear relation between variables, when in fact this relation is of no practical importance (HAIR et al., 2005; CARGNELUTTI FILHO et al., 2010; CARGNELUTTI FILHO et al., 2011; CARGNELUTTI FILHO et al., 2012).
The association between fruit size variables (MFL, MFWi, and MFW) and the number of fruits per plant (NBP, NFP, and NFB) differed between the greenhouses, resulting in different Pearson correlation
coefficients, both in magnitude and sign. Hence, the
use of a matrix mean may not provide an adequate
Pearson correlation coefficient; and consequently, the
sample size calculated from it may not be reliable. Thus, we chose to determine the sample size for each of the trials separately (Table 1).
The amplitudes of the 95% confidence
interval-obtained from 3000 bootstrap re-samplings with replacement-revealed that the Pearson
correlation coefficient estimate is more accurate for
variables with a strong linear relation than for those with a weak linear relation. With the increasing
sample size, the confidence interval amplitude
is still high in large samples when the correlation
coefficient is close to zero (Figure 1). The estimated sample sizes for the 21 correlation coefficients
were inversely proportional to the magnitude of the
Pearson correlation coefficient in both greenhouses
(r = -0.95 in the 250m² greenhouse and r = -0.91 in the 200m2 greenhouse), confirming that the weaker
the linear relation between variables (Pearson
correlation coefficients close to zero), the larger is
the sample size needed for its estimation.
A suitable sample size is necessary,
especially when the correlation coefficient is
close to zero, because there is great variability of magnitude and sign inversion (Table 2); this situation
definitely compromises the statistical analysis.
CARGNELUTTI FILHO et al. (2010), after studying the linear relation between corn parameters, reported that an inadequate sample size may be linked to the
discrepancies in results of scientific publications. Because of significance of the mathematical sign for interpretation of the Pearson correlation coefficient,
is highly relevant, even more than the required sample size for mean estimation.
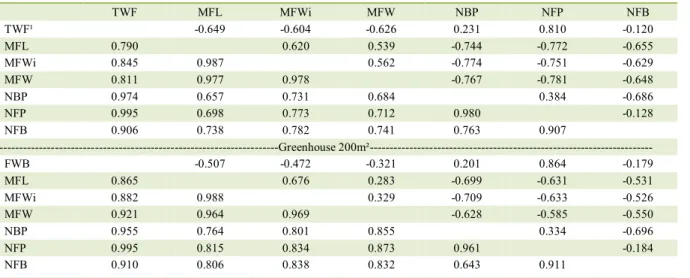
In the case of cherry tomatoes, we reported that the use of small samples is even more detrimental for the study of linear relations involving fruit size variables (MFL, MFWi, and MFW) and the number of fruits per plant (NBP, NFP, and NFB). For example, the estimate of the correlation between variables MFL and NBP obtained in the 250m² and 200m² greenhouses was -0.083 and 0.133, respectively. When the sample consists of only 10 plants, the
amplitude of the 95% confidence interval of the 3000
bootstrap estimates with replacement ranged from -0.744 to 0.657 in the 250m² greenhouse and from -0.699 to 0.764 in the 200m² greenhouse. These results
showed that at reduced sample sizes, the inferences about relations of variables can be contradictory, compromising interpretation of the results. This problem did not occur between variables TWF and
NFP. In this case, the correlation coefficients obtained
in the 250m² and 200m² greenhouses were 0.963 and
0.970, respectively. The 95% confidence interval of
the estimates varied between 0.810 and 0.995 in the 250m² greenhouse, and between 0.864 and 0.995 in the 200m² greenhouse (Table 2).
The sample size needed to estimate the
Pearson coefficient of correlation between productivity variables of cherry tomato, with a 95% confidence
interval equal to 0.4, varied between 10 and 275 in the 250m² greenhouse and between 10 and 200 in the
Figure 1 - Maximum, 97.5% percentile (LS 97.5%), mean, 2.5% percentile (LI 2.5%), and the minimum for 3000 “bootstrap” estimates of
the Pearson coefficient of correlation between the total weight of fruits and the mean length of fruits (A), between the mean width
200m² greenhouse (Table 1). Therefore, a sample size of 275 plants in the 250m² greenhouse and 200 plants in the 200m² greenhouse allows for estimating the
coefficient of correlation between the cherry tomato’s productivity variables with a 95% confidence interval
of at least 0.4, regardless of the relation between the parameters being studied. The use of this amplitude
of the confidence interval to determine a sample size is justified because at this value, the amplitude tends to stabilize when the correlation coefficient is of low
magnitude (Figure 1a).
Sample sizes determined by means of
the same amplitude of a confidence interval have
different precision values (this value is greater in the
correlation coefficients of greater magnitude than in
those with lower magnitude). Hence, it is important to highlight that if a researcher wants to estimate
the Pearson correlation coefficient with the same
precision, the sample size for each analysis should be different. If the same sample size is used, the precision estimation will not be the same. The better
amplitude definition of the 95% confidence interval
will be selected by each researcher according to the experimental precision of its estimates.
CONCLUSION
The sample size should be larger for determining a linear relation of the variables associated with the size and number of fruits per plant, owing to the low magnitude of this correlation.
To estimate the Pearson coefficients of
correlation between cherry tomato variables with
a 95% confidence interval amplitude equal to 0.4,
it is necessary to sample 275 plants in the 250m² greenhouse and 200 plants in the 200m2 greenhouse.
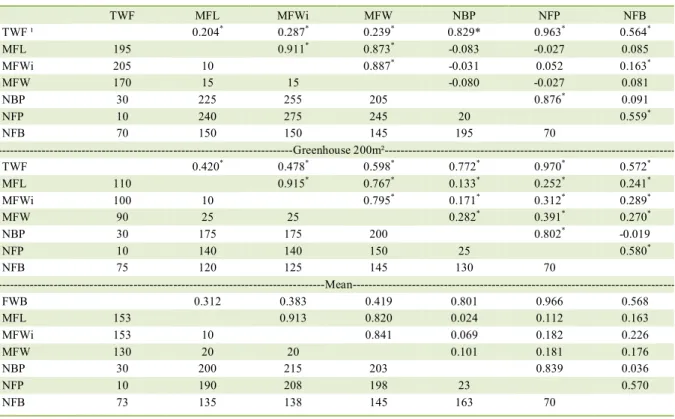
Table 1 - The matrix of Pearson correlation coefficients (upper diagonal) and sample sizes (lower diagonal) for 21 pairs of variables obtained in two trials and from their mean.
---Greenhouse
250m²---TWF MFL MFWi MFW NBP NFP NFB
TWF ¹ 0.204* 0.287* 0.239* 0.829* 0.963* 0.564*
MFL 195 0.911* 0.873* -0.083 -0.027 0.085
MFWi 205 10 0.887* -0.031 0.052 0.163*
MFW 170 15 15 -0.080 -0.027 0.081
NBP 30 225 255 205 0.876* 0.091
NFP 10 240 275 245 20 0.559*
NFB 70 150 150 145 195 70
---Greenhouse
200m²---TWF 0.420* 0.478* 0.598* 0.772* 0.970* 0.572*
MFL 110 0.915* 0.767* 0.133* 0.252* 0.241*
MFWi 100 10 0.795* 0.171* 0.312* 0.289*
MFW 90 25 25 0.282* 0.391* 0.270*
NBP 30 175 175 200 0.802* -0.019
NFP 10 140 140 150 25 0.580*
NFB 75 120 125 145 130 70
---Mean---FWB 0.312 0.383 0.419 0.801 0.966 0.568
MFL 153 0.913 0.820 0.024 0.112 0.163
MFWi 153 10 0.841 0.069 0.182 0.226
MFW 130 20 20 0.101 0.181 0.176
NBP 30 200 215 203 0.839 0.036
NFP 10 190 208 198 23 0.570
NFB 73 135 138 145 163 70
1
REFERENCES
CARGNELUTTI FILHO, A. et al. Sample size to estimate the
Pearson correlation coefficient among characters of castor bean.
Semina: Ciências Agrárias, v.33, p.953-962, 2012. Available from: <http://www.scielo.br/pdf/pab/v45n12/v45n12a05.pdf>. Accessed: Feb. 18, 2017. doi: 10.5433/1679 0359.2012v33n3p953. CARGNELUTTI FILHO, A. et al. Sample size for estimating the
Pearson correlation coefficient among corn characters. Pesquisa Agropecuária Brasileira, v.45, n.12, p.1363-1371, 2010. Available from: <http://www.scielo.br/pdf/pab/v45n12/v45n12a05.pdf>. Accessed: Feb. 18, 2017. doi: 10.1590/S0100 204X2010001200005. CARGNELUTTI FILHO, A. et al. Sample size to estimate the Pearson
correlation coefficient among characters of Crambe abyssinica.
Revista Ciência Agronômica, v.42, n.1, p.149-158, 2011. Available from: <http://www.scielo.br/pdf/rca/v42n1/v42n1a19.pdf>. Accessed: Feb. 18, 2017. doi: 10.1590/S1806 66902011000100019.
CRUZ, C.D.; REGAZZI A.J. Modelos biométricos aplicados ao melhoramento genético. Viçosa: UFV, 1997. 390p.
EMBRAPA. Sistema brasileiro de classificação de solos. Rio de Janeiro: Centro Nacional de Pesquisa de Solos, 2006. 306p. FERREIRA, D.F. Estatística básica. 2.ed. Lavras: Universidade Federal de Lavras, 2009. 664p.
HAESBAERT, F.M. et al. Sample size for experiments with bean pods in different environments. Ciência Rural, v.41, n.1, p.38-44, 2011. Available from: <http://www.scielo.br/pdf/cr/v41n1/ a834cr3400.pdf>. Accessed: Feb. 18, 2017. doi: 10.1590/S0103 84782011000100007.
HAIR J.F. et al. Análise multivariada de dados. Porto Alegre: Bookman, 2005. 593p.
LÚCIO A.D. et al. Sample size and plot size for growth and productivity characteristics of tomato. Horticultura Brasileira, v.30 n.4, p.660-668, 2012. Available from: <http://www.scielo.br/ pdf/hb/v30n4/v30n4a16.pdf>. Accessed: Feb. 18, 2017.
R Development Core Team. R: a language and environment for statistical computing. Viena: R Foundation for Statistical Computing, 2016. Available from: <http://www.R-project.org>. Accessed: Feb. 18, 2017.
ROLAS (REDE OFICIAL DE LABORATÓRIOS DE ANÁLISE DE SOLO E DE TECIDO VEGETAL DOS ESTADOS DO RIO GRANDE DO SUL E DE SANTA CATARINA). Recomendações de
adubações e de calagem para os estados do Rio Grande do Sul e Santa Catarina. Passo Fundo: SBCS Núcleo Regional Sul, 2004. 224p.
SANTOS, D. et al. Sample sufficiency for lettuce grown in different
environments. Ciência Rural, v.40, n.4, p.800-805, 2010. Available from: <http://www.scielo.br/pdf/cr/v40n4/a554cr1846.pdf>. Accessed: Feb. 18, 2017. doi: 10.1590/S0103 84782010000400009. SILVA, A.R. et al. Sample size for morphological characterization of pepper fruits. Horticultura Brasileira, v.29, n.1, p.125-129, 2011. Available from: <http://www.scielo.br/pdf/hb/v29n1/22.pdf>. Accessed: Feb. 18, 2017. doi: 10.1590/S010205362011000100022. SILVA, G.O. da et al. Sample size for evaluation of carrot traits in agroecologic cultivation systems. Horticultura Brasileira, v.27, n.2, p.166-170, 2009. Available from: <http://www.scielo.br/pdf/ hb/v27n2/v27n2a08.pdf>. Accessed: Feb. 18, 2017. doi: 10.1590/ S0102 05362009000200008.
Table 2 - Values of the 2.5% percentile (upper diagonal) and 97.5% percentile (lower diagonal) of the Pearson correlation coefficient for the 21 pairs of parameters, obtained from 3000 bootstrap re-samplings with a replacement of 10 plants.
---Greenhouse 250m²---
TWF MFL MFWi MFW NBP NFP NFB
TWF¹ -0.649 -0.604 -0.626 0.231 0.810 -0.120
MFL 0.790 0.620 0.539 -0.744 -0.772 -0.655
MFWi 0.845 0.987 0.562 -0.774 -0.751 -0.629
MFW 0.811 0.977 0.978 -0.767 -0.781 -0.648
NBP 0.974 0.657 0.731 0.684 0.384 -0.686
NFP 0.995 0.698 0.773 0.712 0.980 -0.128
NFB 0.906 0.738 0.782 0.741 0.763 0.907
---Greenhouse 200m²---
FWB -0.507 -0.472 -0.321 0.201 0.864 -0.179
MFL 0.865 0.676 0.283 -0.699 -0.631 -0.531
MFWi 0.882 0.988 0.329 -0.709 -0.633 -0.526
MFW 0.921 0.964 0.969 -0.628 -0.585 -0.550
NBP 0.955 0.764 0.801 0.855 0.334 -0.696
NFP 0.995 0.815 0.834 0.873 0.961 -0.184
NFB 0.910 0.806 0.838 0.832 0.643 0.911