Printed version ISSN 0001-3765 / Online version ISSN 1678-2690 http://dx.doi.org/10.1590/0001-3765201820170813
www.scielo.br/aabc | www.fb.com/aabcjournal
Sample size for estimating mean and coefficient of variation in species of crotalarias
MARCOS TOEBE1
, LETÍCIA N. MACHADO2
, FRANCIELI L. TARTAGLIA2
, JULIANA O. DE CARVALHO3
, CIRINEU T. BANDEIRA4
and ALBERTO CARGNELUTTI FILHO4
1
Departamento de Ciências Agronômicas e Ambientais, Universidade Federal de Santa Maria, Campus Frederico Westphalen, Linha 7 de Setembro, s/n, BR 386, Km 40, 98400-000 Frederico Westphalen, RS, Brazil
2
Universidade Federal do Pampa, Campus Itaqui, Rua Luiz Joaquim de Sá Britto, s/n, Bairro Promorar, 97650-000 Itaqui, RS, Brazil 3
Programa de Pós-Graduação em Fisiologia Vegetal, Departamento de Botânica, Universidade Federal de Pelotas, Campus Capão do Leão, 96160-000 Capão do Leão, RS, Brazil
4
Departamento de Fitotecnia, Universidade Federal de Santa Maria, Avenida Roraima, 1000, Camobi, 97105-900 Santa Maria, RS, Brazil
Manuscript received on October 11, 2017; accepted for publication on November 16, 2017
ABSTRACT
The objective of this study was to determine the sample size necessary to estimate the mean and coefficient of variation in four species of crotalarias (C. juncea, C. spectabilis, C. breviflora and C. ochroleuca). An experiment was carried out for each species during the season 2014/15. At harvest, 1,000 pods of each species were randomly collected. In each pod were measured: mass of pod with and without seeds, length, width and height of pods, number and mass of seeds per pod, and mass of hundred seeds. Measures of central tendency, variability and distribution were calculated, and the normality was verified. The sample size necessary to estimate the mean and coefficient of variation with amplitudes of the confidence interval of 95% (ACI95%) of 2%, 4%, ..., 20% was determined by resampling with replacement. The sample size varies among species and characters, being necessary a larger sample size to estimate the mean in relation of the necessary for the coefficient of variation.
Key words:Crotalaria sp., experimental precision, number of pods, resampling.
Correspondence to: Marcos Toebe E-mail: [email protected]
INTRODUCTION
The species of the genus Crotalaria are used as
cover plants in crops rotation systems, with high production of green matter mass and biological
nitrogen fixation, contributing to the production
of organic matter (Chaudhary 2016). According
to Vargas et al. (2017), the residual nitrogen of C.
juncea is sufficient for growing broccoli followed
by zucchini. Bhandari et al. (2016) highlight that the C. juncea is an important source of fiber,
but that few studies have been developed, being
the genetic breeding incipient in this species. C.
spectabilis can reduce the incidence of Ralstonia solanacearum in tomato plants (Deberdt et al. 2015) and also features low suitability for
reproduction of Helicoverpa armigera (Reigada et
al. 2016). According to Machado et al. (2007) and
C. ochroleuca can be used to reduce the population density and management of areas infested with
Pratylenchus brachyurus.
When the experiments were carried out, one of
the main steps is the definition of the sample size suitable to be used for the evaluation of the effect of treatments, being the same influenced by the desired
precision, by characters that will be evaluated, by the variability of the data and the error rate allowed. Sample size is important for the representativeness of the research and the validity of the conclusions (Koumanov 2017). According to Ferreira (2009), the resampling with replacement can be used for the sample sizing, being independent of the data probability distribution. This technique has been used in the sample sizing for the estimation of genetic and phenotypic parameters of sugar cane
(Leite et al. 2009), mean and coefficient of variation
(Toebe et al. 2014), linear correlation (Cargnelutti Filho et al. 2010, Toebe et al. 2015) and path analysis (Toebe et al. 2017b) in maize and the mean and standard deviation of pepper fruits (Silva et al. 2015). The resampling process was also used in the sampling size of cover plants, as for the estimation of the mean of characters of jack bean and velvet bean seeds (Cargnelutti Filho et al. 2012) and the plastochron in pigeon pea (Cargnelutti Filho et al. 2013).
Specifically in crotalarias, Facco et al. (2017) evaluated the influence of basic experimental units
in the estimate of the optimal plot size for the
evaluation of fresh mass of C. juncea. Teodoro et
al. (2015) and Toebe et al. (2017a) determined the sample size to estimate the average of characters in C. juncea and C. spectabilis using the Student’s t-distribution. In the study of Teodoro et al. (2015), the sample size oscillated among the levels of precision, variables and between the two species of crotalarias. It is likely that when a larger number of variables and species of this genus are evaluated, changes occur in the recommendation of the sample size. Still, although some theoretical studies
(Kelley 2007, Panichkitkosolkul 2009, Banik et al. 2012) and practical studies (Toebe et al. 2014) of
sample sizing for the coefficient of variation have
been developed, reports in the literature were not found on such information on species of crotalaria. Thus, the objective of this study was to determine the sample size necessary to estimate the mean and
coefficient of variation in four species of crotalarias
(C. juncea, C. spectabilis, C. breviflora and C. ochroleuca) in precision levels.
MATERIALS AND METHODS
Four tests of uniformity were carried out (blank experiments, i.e., without treatments) in the season of 2014/2015, in the experimental area of the Federal University of Pampa, Campus Itaqui, located in the municipality of Itaqui, State of Rio Grande do Sul, Brazil, in geographic coordinates lat 29°09’S and long 56°33’W and altitude of 74
m. According to the classification of Köppen, the
climate of the region is Cfa type, humid subtropical
with hot summers and without a defined dry season (Wrege et al. 2011), and the soil classified as Haplic
Plinthosol (Santos et al. 2013).
Each test of uniformity was performed in an
area of 65.61 m2 (8.1 m in length × 8.1 m width)
and was destined to one of the four species of
crotalarias (C. juncea, C. spectabilis, C. breviflora
and C. ochroleuca). In the four assays of uniformity
the fertilizer basis was 25 kg∙ha−1 of N, 100 kg∙ha−1
of P2O and 100 kg∙ha−1 of K2O and all the cultural treatments were carried out in a uniform way within the sample area. This standardization for performing of uniformity assays is indicated by Storck et al. (2016).
The seeds of C. juncea, cultivar IAC-KR1,
were seeded on 10/18/2014, with spacing between rows of 0.45 m and 27 seeds per meter of row,
totaling 60 seeds per m2. The seeds of C.spectabilis,
Afterwards, the amplitude of the confidence
interval of 95% was calculated (ACI95%) by the
difference between the percentile 97.5% and the
percentile 2.5%.
For the determination of sample size (number of pods) required to estimate the mean of each of the eight characters in each species of
crotalaria, maximum limits of ACI95% were fixed,
of 2% (greater precision), 4%, 6%, ..., 20%, (less precision) of mean. Whereas for the determination
of sample size required to estimate the coefficient of
variation (CV, in %), of each of the eight characters in each species of crotalaria, maximum limits of ACI95% were fixed of 2% (greater precision), 4%, 6%, ..., 20% (less precision). Then, it was started from the initial sample size (n = 10 pods) and it was considered as appropriate sample size (n) the number of pods from which the amplitude of the
confidence interval of 95% (ACI95%) was less than or equal to the maximum limit established for each level of precision, as already described in previous studies (Cargnelutti Filho et al. 2010, Toebe et al. 2014, 2015, 2017b). Statistical analyzes were performed with the aid of the program R (R Development Core Team 2017) and the application
Microsoft Office Excel®
.
RESULTS AND DISCUSSION
In general, it was found wide variability (difference
between maximum and minimum values) of data in eight characters evaluated in four species of
crotalarias (C. juncea, C. spectabilis, C. breviflora
and C. ochroleuca), which may be justified by the
number of pods evaluated (Table I). This wide variability is indicative that the extreme values are included in the sample of 1,000 pods, and this is important for the correct sample dimensioning. For a given character and species, the values of mean and median were similar among themselves,
indicating good fit of the data to normal distribution.
In this sense, it was found mesokurtic kurtosis
meter of row, totaling 73 seeds per m2. The seeds
of C. breviflora, common cultivar, were seeded on 10/17/2014, with spacing between rows of 0.45 m and 33 seeds per meter of row, totaling 73 seeds per
m2. The seeds of C.ochroleuca, common cultivar,
were seeded on 10/20/2014, with spacing between rows of 0.45 m and 44 seeds per meter of row,
totaling 98 seeds per m2.
In the period from March to June 2015, successive harvests of pods were held, randomly, in each assay of uniformity, in accordance with the productive cycle of each species. For each species (C. Juncea, C. spectabilis, C. breviflora and C. ochroleuca), 1,000 pods were collected and, in each pod, the following characters were evaluated: mass of pod with seeds (MPWS, in g); mass of pod without seeds (MPWOS, in g); length of the pod (LP, in mm); width of the pod (WP, in mm); height
of the pod (HP, in mm); number of seeds per pod
(NSP, in units); mass of seeds per pod (MSP, in g);
and mass of one hundred seeds (MHS, in g). From
these data it was calculated the minimum, mean, median, maximum, variance, standard deviation,
coefficient of variation, asymmetry and kurtosis
values of each character in each species, being checked the normality of the data through the test of Kolmogorv-Smirnov.
For each character of each species of crotalaria, 190 sample sizes were planned, being the smallest sample size of 10 pods and the other sample
sizes obtained with addition of five pods. Thus,
the sample sizes planned were n = 10, 15, 20, ..., 1,000 pods. For each planned sample size, in each species, 10,000 resamples with replacement were
obtained, being that in each resample, the mean (x̅)
and the coefficient of variation (CV, in %) of each
of the eight characters were estimated. Thus, for each planned sample size, 10,000 estimates of the
mean and coefficient of variation for each character
were obtained. Based on these 10,000 estimates of
each statistic ( x̅ and CV), the percentile 2.5%, the
in seven, four, seven and seven characters of the
species C. juncea, C. spectabilis, C. breviflora and
C. ochroleuca, respectively.
It was verified positive and significant
asymmetry (p ≤ 0.05) in five, zero, zero and one character and, negative and significant asymmetry (p ≤ 0.05) in one, three, four and two characters, in
the species C. juncea, C. spectabilis, C. breviflora
and C. ochroleuca, respectively (Table I). The
significant deviations of asymmetry observed in
50% of cases can be associated with high sample size used (n = 1,000 pods), since the amplitude of
the confidence interval of the asymmetry can be
reduced by increasing the size of the sample. Thus, small deviations of asymmetry become statistically
significant (Doane and Seward 2011, Wright and Herrington 2011), as already observed in data from
corn hybrids (Toebe et al. 2014).
The character NSP was the only character
that does not fit the normal distribution in the four
species evaluated (Table I). It was also not found
fit to normal distribution for these characters MSP
and MPWOS in C. breviflora and C. ochroleuca,
respectively. For the remaining cases, normality of data (p > 0.05) was observed. Considering the large number of evaluations, the wide variability of data, the similarity among the values of mean and median, the predominance of mesokurtic and symmetrical
data, the fit to the normal distribution and, also
taking into account, the process of sampling sizing via resampling (Ferreira 2009), it may be inferred
that the database offers reliability for the proposed
study, and the sample sizes determined serve as reference for the culture.
In the four species of crotalarias, the coefficient
of variation showed lower values in the characters originated from the measurement (LP, WP and
HP) in relation to those obtained by counting
and weighing (MPWS, MPWOS, NSP, MSP and
MHS - Table I). The coefficient of variation ranged
between 5.40% and 10.53% for the characters LP,
WP and HP assessed in the species C. juncea, C.
spectabilis, C. breviflora and C. ochroleuca. For the characters MPWS, MPWOS, NSP, MSP and
MHS, the coefficient of variation ranged between
8.83% and 36.31%. Yet the values of CV increased
at the order C. spectabilis, C. breviflora, C.
ochroleuca and C. juncea. These results suggest
a lower sample size for LP, WP and HP compared
to other characters and smaller sample size for
C. spectabilis, C. breviflora and C. ochroleuca in
relation to C. juncea.
In ten characters evaluated in plants of
C. spectabilis, Toebe et al. (2017a) verified a
coefficient of variation in the range of 7.819% for
mass of 100 grains to 55.452% for number of seeds
per plant. In C. juncea and C. spectabilis, Teodoro
et al. (2015) observed higher values of coefficients
of variation for fresh matter mass, followed by dry matter mass and yield, being observed greater
variability for characters evaluated in C. juncea in
relation to C. spectabilis, similarly to this study.
For the highest level of precision [amplitude of
the confidence interval of 95% (ACI95%) of 2% of the mean], the sample size ranged between 235 to
more than 1,000 pods for C. juncea, between 120
to more than 1,000 pods for C. spectabilis, between
115 to more than 1,000 pods for C. breviflora
and between 305 to more than 1,000 pods for C.
ochroleuca, depending on the character (Table II). These results indicate that to estimate the mean of various characters more than one thousand pods should be evaluated, if the researcher chooses to use this level of precision. In these cases, it would be recommended study of sample sizing with simulation of sample sizes greater those stipulated in the present study. Using semi-amplitude of confidence interval of 95% of 1% of the mean by the Student’s t test distribution, Teodoro et al.
(2015) verified the need for evaluation from 1,108
to 8,510 plants, depending on the character and the
species of crotalaria (C. juncea or C. spectabilis).
TABLE I
Minimum, mean, median, maximum, variance, standard deviation (SD), coefficient of variation (CV in %), asymmetry, kurtosis and p-value of the test of normality of Kolmogorov-Smirnov to eight characters measured in 1,000 pods of four species of crotalarias - C.juncea, C.spectabilis, C.breviflora and C.ochroleuca - in the season of 2014/15 in Itaqui - RS -
Brazil.
Characters measured (measurement units)(1)
Statistic MPWS (g) MPWOS (g) LP (mm) WP (mm) HP (mm) NSP (un.) MSP (g) MHS (g) Crotalaria juncea
Minimum 0.15 0.09 22.59 8.18 5.50 1.00 0.05 1.70
Mean 0.50 0.17 29.52 10.93 7.70 6.94 0.33 4.81
Median 0.49 0.16 29.47 10.88 7.69 7.00 0.32 4.89
Maximum 0.89 0.26 36.57 14.27 9.72 13.00 0.68 8.16
Variance 0.02 0.00 5.39 1.05 0.51 4.75 0.01 1.26
SD 0.14 0.03 2.32 1.02 0.71 2.18 0.12 1.12
CV(%) 27.40 16.75 7.86 9.37 9.24 31.39 36.31 23.29
Asymmetry(2) 0.15* 0.24* 0.10ns 0.35* 0.09ns 0.20* 0.18* -0.15*
Kurtosis(3) -0.29ns -0.26ns -0.11ns 0.11ns -0.05ns -0.27ns
-0.32* -0.29ns
P-value 0.83 0.15 0.92 0.31 0.67 0.00 0.36 0.31
Crotalaria spectabilis
Minimum 0.31 0.20 35.32 11.94 7.79 5.00 0.08 1.28
Mean 0.68 0.36 41.74 15.47 9.83 17.91 0.32 1.78
Median 0.69 0.36 41.82 15.48 9.85 18.00 0.32 1.78
Maximum 0.98 0.52 49.55 18.19 11.82 28.00 0.50 2.38
Variance 0.01 0.00 5.23 0.99 0.36 12.17 0.00 0.02
SD 0.11 0.05 2.29 0.99 0.60 3.49 0.07 0.16
CV(%) 15.98 14.93 5.48 6.43 6.09 19.48 20.51 8.83
Asymmetry(2) -0.34* -0.07ns -0.11ns -0.15ns -0.01ns -0.70* -0.51* -0.03ns Kurtosis(3)
0.24ns
-0.12ns
-0.04ns
-0.09ns
0.39* 0.91* 0.55* 0.86*
P-value 0.32 0.91 0.39 0.65 0.48 0.00 0.13 0.14
Crotalaria breviflora
Minimum 0.27 0.17 32.92 8.53 6.44 5.00 0.08 1.11
Mean 0.61 0.27 39.55 10.45 8.08 17.45 0.33 1.91
Median 0.61 0.27 39.53 10.47 8.10 18.00 0.34 1.93
Maximum 0.89 0.40 45.91 12.18 9.49 25.00 0.54 2.70
Variance 0.01 0.00 4.57 0.39 0.25 13.89 0.01 0.06
SD 0.11 0.04 2.14 0.63 0.50 3.73 0.08 0.25
CV(%) 17.64 15.14 5.40 5.99 6.16 21.37 24.11 13.16
Asymmetry(2) -0.21* 0.12ns -0.08ns -0.12ns -0.11ns -0.76* -0.39* -0.26* Kurtosis(3) -0.05ns -0.26ns -0.18ns -0.18ns 0.04ns
0.45* 0.00ns
0.23ns
P-value 0.27 0.76 0.92 0.66 0.43 0.00 0.04 0.12
Crotalaria ochroleuca
Minimum 0.45 0.25 41.06 11.52 8.00 26.00 0.18 0.43
Mean 1.10 0.52 56.28 16.84 11.49 81.16 0.57 0.71
Median 1.10 0.51 56.52 16.82 11.49 83.00 0.58 0.71
Maximum 1.71 0.86 72.62 21.85 15.09 115.00 0.97 1.01
Variance 0.05 0.01 25.03 3.05 1.47 215.09 0.02 0.01
SD 0.21 0.11 5.00 1.75 1.21 14.67 0.13 0.10
CV(%) 19.53 21.17 8.89 10.37 10.53 18.07 22.13 14.43
Asymmetry(2)
0.04ns
0.29* -0.24* -0.08ns
0.09ns
-0.77* -0.13ns
0.00ns Kurtosis(3) -0.01ns -0.18ns 0.19ns 0.05ns -0.16ns
0.89* 0.22ns
-0.15ns
P-value 0.36 0.05 0.25 0.36 0.86 0.00 0.25 1.00
(1)
MPWS: Mass of pod with seeds, in g: MPWOS: Mass of pods without seed, in g; LP: Length of the pod, in mm; WP: Width of
the pod, in mm; HP: Height of the pods, in mm; NSP: Number of seeds per pod, in units; MSP: Mass of seeds per pod, in g; MHS:
Mass of 100 seeds, in g; (2) *Asymmetry differs from zero, by means of the t test at 5% probability. ns Not significant. (3)
*Kurtosis
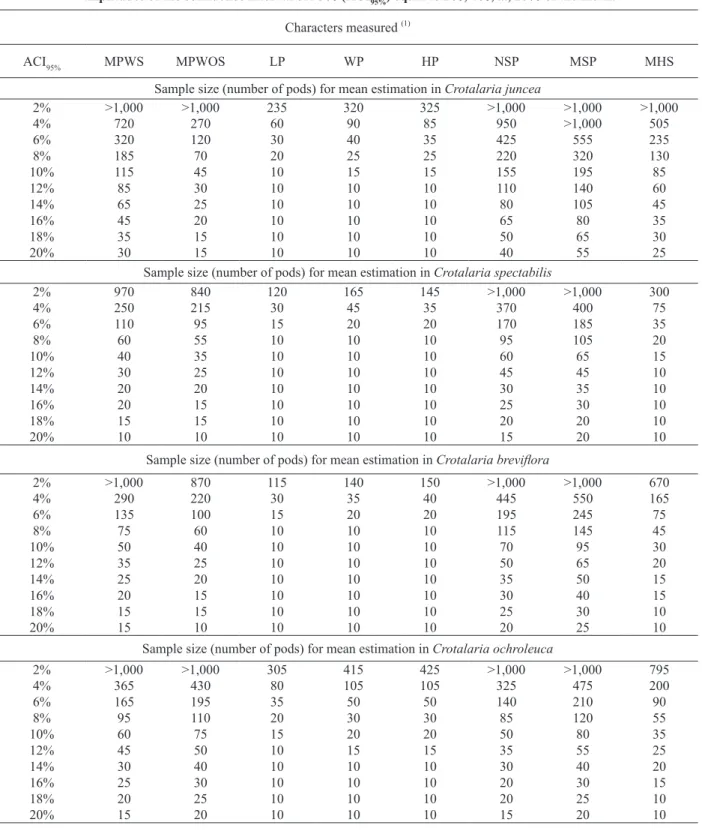
TABLE II
Sample size (number of pods) by resampling with replacement, to estimate the mean of eight characters measured in four species of crotalarias - C. juncea, C. spectabilis, C. breviflora and C. ochroleuca - in the season of 2014/15, for the
amplitudes of the confidence interval of 95% (ACI95%) equal to 2%, 4%, ..., 20% of the mean.
Characters measured (1)
ACI95% MPWS MPWOS LP WP HP NSP MSP MHS
Sample size (number of pods) for mean estimation in Crotalaria juncea
2% >1,000 >1,000 235 320 325 >1,000 >1,000 >1,000
4% 720 270 60 90 85 950 >1,000 505
6% 320 120 30 40 35 425 555 235
8% 185 70 20 25 25 220 320 130
10% 115 45 10 15 15 155 195 85
12% 85 30 10 10 10 110 140 60
14% 65 25 10 10 10 80 105 45
16% 45 20 10 10 10 65 80 35
18% 35 15 10 10 10 50 65 30
20% 30 15 10 10 10 40 55 25
Sample size (number of pods) for mean estimation in Crotalaria spectabilis
2% 970 840 120 165 145 >1,000 >1,000 300
4% 250 215 30 45 35 370 400 75
6% 110 95 15 20 20 170 185 35
8% 60 55 10 10 10 95 105 20
10% 40 35 10 10 10 60 65 15
12% 30 25 10 10 10 45 45 10
14% 20 20 10 10 10 30 35 10
16% 20 15 10 10 10 25 30 10
18% 15 15 10 10 10 20 20 10
20% 10 10 10 10 10 15 20 10
Sample size (number of pods) for mean estimation in Crotalaria breviflora
2% >1,000 870 115 140 150 >1,000 >1,000 670
4% 290 220 30 35 40 445 550 165
6% 135 100 15 20 20 195 245 75
8% 75 60 10 10 10 115 145 45
10% 50 40 10 10 10 70 95 30
12% 35 25 10 10 10 50 65 20
14% 25 20 10 10 10 35 50 15
16% 20 15 10 10 10 30 40 15
18% 15 15 10 10 10 25 30 10
20% 15 10 10 10 10 20 25 10
Sample size (number of pods) for mean estimation in Crotalaria ochroleuca
2% >1,000 >1,000 305 415 425 >1,000 >1,000 795
4% 365 430 80 105 105 325 475 200
6% 165 195 35 50 50 140 210 90
8% 95 110 20 30 30 85 120 55
10% 60 75 15 20 20 50 80 35
12% 45 50 10 15 15 35 55 25
14% 30 40 10 10 10 30 40 20
16% 25 30 10 10 10 20 30 15
18% 20 25 10 10 10 20 25 10
20% 15 20 10 10 10 15 20 10
(1) MPWS: Mass of pod with seeds, MPWOS: Mass of pods without seed, LP: Length of the pod, WP: Width of the pod, HP: Height
plants of C. spectabilis, depending on the character to be measured.
For intermediate precision [amplitude of the
confidence interval of 95% (ACI95%) of 10% of the mean], the sample size ranged from 10 to 195 pods for C. juncea, from 10 to 65 pods for C. spectabilis,
from 10 to 95 pods for C. breviflora and from 15
to 80 pods for C. ochroleuca, depending of the
character (Table II). At this level of precision, the assessment of 20 pods is sufficient to estimate
the mean of LP, WP and HP, regardless of the
species considered. Whereas for MPWOS and
MHS, 85 pods are necessary and, 195 pods for the
determination of the characters MPWS, NSP and
MHS, regardless of the species considered. Among
the species, greater sample size is necessary to
estimate the mean of C. juncea. As noted earlier,
the characters MPWS, MPWOS, NSP, MSP and
MHS showed greater variation, being higher the
variation also in C. juncea (Table I), resulting in
increased the sample size (Table II). For ACI95% of
10% of the mean, Cargnelutti Filho et al. (2012) recommended the evaluation of 117 and 66 seeds, respectively, in jack bean and velvet bean. Leite
et al. (2009) verified that the sample size ranged
in accordance with the genetic or phenotypic
parameter and with the variable. For C. spectabilis,
Toebe et al. (2017a) recommended from 10 to 484 plants and Teodoro et al. (2015) recommended from 44 to 340 plants, depending of the character and the species of crotalaria, with semi-amplitude
of 95% confidence interval of 5% of the mean.
Being adopted the lowest precision of this
study [amplitude of the confidence interval of 95%
(ACI95%) of 20% of the mean], the sample size
ranged from 10 to 55 pods for C. juncea, from 10
to 20 pods for C. spectabilis, from 10 to 25 pods
for C. breviflora and from 10 to 20 pods for C. ochroleuca, depending on the character (Table
II). C. juncea showed in general higher variability
and, consequently, higher sample size compared to the other species (Tables I and II). In this and
in other species of crotalaria, variability in the sample size in function of character was observed,
being that ACI95% in a simulated sample size was
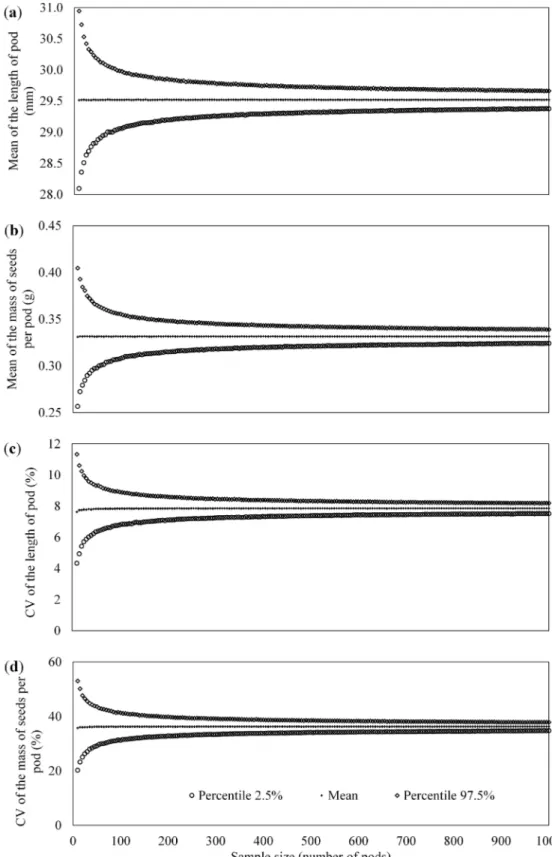
lower for the character length of pod (Figure 1a -
shorter variability) in relation to ACI95% of the mass
of seeds per pod (Figure 1b - greater variability). Variability in sample size between characters or pairs of characters has been frequently reported in
the literature, as it can be verified in sugar cane
(Leite et al. 2009), maize (Cargnelutti Filho et al. 2010, Toebe et al. 2014, 2015, 2017b), jack bean
and velvet bean (Cargnelutti Filho et al. 2012), C.
juncea (Teodoro et al. 2015) and in C. spectabilis
(Teodoro et al. 2015, Toebe et al. 2017a).
For the estimation of the coefficient of variation
(CV in %) in a higher level of precision [amplitude
of the confidence interval of 95% (ACI95%) of 2%], the sample size ranged between 55 to more than 1,000 pods, depending on the character and species (Table III). For intermediate precision [amplitude
of the confidence interval of 95% (ACI95%) of 10%],
the sample size for the estimate of coefficient of
variation ranged from 10 to 105 pods for C. juncea,
from 10 to 55 pods for C. spectabilis, from 10 to 65
pods for C. breviflora and from 10 to 50 pods for
C. ochroleuca, depending on the character. For the
estimate of coefficient of variation, with ACI95% of
5% in maize, Toebe et al. (2014) verified the need
of sample size from 20 to 725 ears, depending on the character, the year and hybrid to be evaluated.
Species with lower variability, as for example
C. spectabilis, need smaller sample size for
estimating the coefficient of variation as compared
to C. juncea (Table III). Still, characters that showed less variation, as for example, LP, WP
and HP (Table I), needed smaller sample size to
estimate the mean (Table II) and for the estimate
of the coefficient of variation (Table III), holding
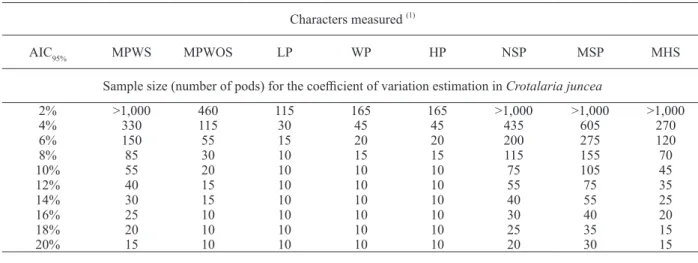
TABLE III
Sample size (number of pods) by resampling with replacement, to estimate the coefficient of variation of eight characters measured in four species of crotalarias - C. juncea, C. spectabilis, C. breviflora and C. ochroleuca - in the season of 2014/15,
for the amplitudes of the confidence interval of 95% (ACI95%) equal to 2%, 4%, ..., 20%.
Characters measured (1)
AIC95% MPWS MPWOS LP WP HP NSP MSP MHS
Sample size (number of pods) for the coefficient of variation estimation in Crotalaria juncea
2% >1,000 460 115 165 165 >1,000 >1,000 >1,000
4% 330 115 30 45 45 435 605 270
6% 150 55 15 20 20 200 275 120
8% 85 30 10 15 15 115 155 70
10% 55 20 10 10 10 75 105 45
12% 40 15 10 10 10 55 75 35
14% 30 15 10 10 10 40 55 25
16% 25 10 10 10 10 30 40 20
18% 20 10 10 10 10 25 35 15
20% 15 10 10 10 10 20 30 15
Sample size (number of pods) for the coefficient of variation estimation in Crotalaria spectabilis
2% 625 430 60 80 90 >1,000 >1,000 220
4% 160 110 20 25 25 320 315 55
6% 75 50 10 10 10 145 140 25
8% 40 30 10 10 10 85 80 15
10% 30 20 10 10 10 55 50 10
12% 20 15 10 10 10 40 35 10
14% 15 10 10 10 10 30 30 10
16% 10 10 10 10 10 25 20 10
18% 10 10 10 10 10 20 20 10
20% 10 10 10 10 10 15 15 10
Sample size (number of pods) for the coefficient of variation estimation in Crotalaria breviflora
2% 665 385 55 70 75 >1,000 >1,000 405
4% 165 100 15 20 20 350 360 100
6% 75 45 10 10 10 160 165 45
8% 45 30 10 10 10 90 95 30
10% 30 20 10 10 10 60 65 20
12% 20 15 10 10 10 45 45 15
14% 15 10 10 10 10 30 35 10
16% 15 10 10 10 10 25 25 10
18% 10 10 10 10 10 20 20 10
20% 10 10 10 10 10 15 15 10
Sample size (number of pods) for the coefficient of variation estimation in Crotalaria ochroleuca
2% 780 745 180 220 200 >1,000 >1,000 390
4% 195 185 50 60 50 285 305 95
6% 90 85 25 30 25 130 135 45
8% 50 50 15 15 15 75 75 30
10% 35 35 10 10 10 45 50 20
12% 25 25 10 10 10 35 35 15
14% 20 20 10 10 10 25 25 10
16% 15 15 10 10 10 20 20 10
18% 15 15 10 10 10 15 20 10
20% 10 10 10 10 10 15 15 10
(1) MPWS: Mass of pod with seeds, MPWOS: Mass of pods without seed, LP: Length of the pod, WP: Width of the pod, HP: Height
Figure 1 - Percentile 2.5%, mean and percentile 97.5% of 10,000 estimates of: (a) the mean of the length of pods, in mm; (b) mean of the mass of seeds per pod, in g; (c) the coefficient of variation (CV) of the length
of pods, in %, and; (d) the coefficient of variation of the mass of seeds per pod, in %, for the sample sizes n
scores of coefficients of variation and vice-versa.
The difference in variability of the sample size
for estimating the coefficient of variation among
characters of the same species can be found in
Figure 1c, d, where the ACI95% is lower for the
length of pods in comparison to that seen for mass
of seeds per pod in C. juncea. In these figures,
it is also possible to check that the mean values of the coefficient of variation remains constant
with increasing of the sample size, and there is a
reduction of ACI95%, i.e., the increase in sample
size does not reduce the coefficient of variation, but
reduces the variability of the estimate of the same, which means greater precision in the estimation of
the coefficient of variation, as already observed by
Toebe et al. (2014) in maize hybrids.
CONCLUSIONS
The sample size varies among species and
characters, being necessary a larger sample size to estimate the mean in relation of the necessary
for estimation of coefficient of variation. Based
on this study, researchers will be able to size their experimental samples considering the species of
crotalaria, variables and desired precision.
ACKNOWLEDGMENTS
We thank to the scholarship students and volunteers
for their help in conducting experimental and
data collection. To the Conselho Nacional de Desenvolvimento Científico e Tecnológico
(CNPq), to the Fundação de Amparo à Pesquisa do Estado do Rio Grande do Sul (FAPERGS), to the
Programa de Educação Tutorial do Ministério da
Educação and the Fundação Universidade Federal do Pampa (UNIPAMPA) by scholarships and
financial support. To the company Piraí Sementes® for granting seeds to research purposes.
REFERENCES
BANIK S, KIBRIA BMG AND SHARMA D. 2012. Testing the population coefficient of variation. J Mod Appl Stat Methods 11: 325-335.
BHANDARI HR, TRIPATHI MK, CHAUDHARY B AND
SARKAR SK. 2016. Sunnhemp breeding: Challenges and prospects. Indian J Agric Sci 86: 1391-1398.
B R A Z G B P, O L I V E I R A J R R S, C O N S TA N T I N J, RAIMONDI RT, RIBEIRO LM, GEMELLI A AND
TAKANO HK. 2016. Plantas daninhas como hospedeiras alternativas para Pratylenchus brachyurus. Summa Phytopathol 42: 233-238.
CARGNELUTTI FILHO A, TOEBE M, BURIN C, FICK
AL, ALVES BM AND FACCO G. 2012. Tamanho de amostra para a estimação da média do comprimento, diâmetro e massa de sementes de feijão de porco e mucuna cinza. Cienc Rural 42: 1541-1544.
CARGNELUTTI FILHO A, TOEBE M, BURIN C,
SILVEIRA TR AND CASAROTTO G. 2010. Tamanho de amostra para estimação do coeficiente de correlação linear de Pearson entre caracteres de milho. Pesq Agropec Bras 45: 1363-1371.
CARGNELUTTI FILHO A, TOEBE M, FACCO G,
SANTOS GO, ALVES BM AND BOLZAN A. 2013. Sample size for estimation of the plastochron in pigeonpea. Eur J Agron 48: 12-18.
CHAUDHARY B. 2016. Traditional cultivation of sunnhemp (Crotalaria juncea) in eastern India. Indian J Agric Sci 86: 369-372.
DEBERDT P, GOZÉ E, CORANSON-BEAUDU R, P E R R I N B, F E R N A N D E S P, L U C A S P A N D RATNADASS A. 2015. Crotalaria spectabilis and
Raphanus sativus as previous crops show promise for the control of bacterial wilt of tomato without reducing bacterial populations. J Phytopathol 163: 377-385. DOANE DP AND SEWARD LE. 2011. Measuring Skewness:
A Forgotten Statistic? J Stat Educ 19: 1-18.
FACCO G ET AL. 2017. Basic experimental unit and plot sizes with the method of maximum curvature of the coefficient of variation in sunn hemp. Afr J Agric Res 12: 415-423.
FERREIRA DF. 2009. Estatística básica, 2nd ed., Lavras: UFLA.
KELLEY K. 2007. Sample size planning for the coefficient of variation from the accuracy in parameter estimation approach. Behav Res Methods 39: 755-766.
KOUMANOV KS. 2017. Sample size determination in
horticultural research: an empirical approach. Sci Hort
225: 416-421.
LEITE MSO, PETERNELLI LA, BARBOSA MHP,
full-sib family evaluation in sugarcane. Pesq Agropec Bras 44: 1562-1574.
MACHADO ACZ, MOTTA LCC, SIQUEIRA KMS,
FERRAZ LCCB AND INOMOTO MM. 2007. Host status of green manures for two isolates of Pratylenchus brachyurus in Brazil. Nematology 9: 799-805.
PANICHKITKOSOLKUL W. 2009. Improved confidence intervals for a coefficient of variation of a normal distribution. Thailand Statistician 7: 193-199.
R DEVELOPMENT CORE TEAM. 2017. R: A Language and Environment for Statistical Computing.
REIGADA C, GUIMARÃES KF AND PARRA JRP. 2016. Relative fitness of Helicoverpa armigera (Lepidoptera: Noctuidae) on seven host plants: a perspective for IPM in Brazil. J Insect Sci 16: 1-5.
SANTOS HG, ALMEIDA JA, OLIVEIRA JB, LUMBRERAS JF, ANJOS LHC, COELHO MR, JACOMINE PKT, CUNHA TJF AND OLIVEIRA VA.
2013. Sistema brasileiro de classificação de solos, 3rd ed., Brasília: EMBRAPA.
SILVA AR, HILÁRIO RF, RÊGO ER, NASCIMENTO
NFF, DIAS CTS AND LIMA RP. 2015. A multivariate approach to determine sample size for morphological characterization of pepper fruits. Aust J Crop Sci 9: 1064-1068.
STORCK L, GARCIA DC, LOPES SJ AND ESTEFANEL V. 2016. Experimentação Vegetal, 3rd
ed., Santa Maria: UFSM, 200 p.
TEODORO PE, SILVA JÚNIOR CA, RIBEIRO LP, SILVA
FA, CORRÊA CCG, ZANUNCIO AS AND TORRES
FE. 2015. Sample dimension for estimation of biomass and
yield of sunn (Crotalaria juncea L.) and showy rattlebox (C. spectabilis Roth.). J Agron 14: 98-101.
TOEBE M, BANDEIRA CT, FORTES SKG, CARVALHO
JO, TARTAGLIA FL, TAMBARA AL AND MELO PJ. 2017a. Dimensionamento amostral e associação linear entre caracteres de Crotalaria spectabilis. Bragantia 76: 45-53.
TOEBE M, CARGNELUTTI FILHO A, BURIN C,
CASAROTTO G AND HAESBAERT FM. 2014.
Tamanho de amostra para estimação da média e do coeficiente de variação em milho. Pesq Agropec Bras 49: 860-871.
TOEBE M, CARGNELUTTI FILHO A, LOPES SJ, BURIN
C, SILVEIRA TR AND CASAROTTO G. 2015. Sample size in the estimation of correlation coefficients for corn hybrids in crops and accuracy levels. Bragantia 74: 16-24.
TOEBE M, CARGNELUTTI FILHO A, STORCK L AND
LÚCIO AD. 2017b. Sample size for estimation of direct effects in path analysis of corn. Genet Mol Res 16: 1-23.
VARGAS TO, DINIZ ER, PACHECO ALV, SANTOS RHS AND URQUIAGA S. 2017. Green manure-15
N absorbed by broccoli and zucchini in sequential cropping. Sci Hortic 214: 209-213.
WREGE MS, STEINMETZ S, REISSER JÚNIOR C AND ALMEIDA IR. 2011. Atlas climático da Região Sul do Brasil: Estados do Paraná, Santa Catarina e Rio Grande do Sul. Pelotas: Embrapa Clima Temperado; Embrapa Florestas.