(Annals of the Brazilian Academy of Sciences)
Printed version ISSN 0001-3765 / Online version ISSN 1678-2690 www.scielo.br/aabc
Efficiency of snake sampling methods in the Brazilian semiarid region
PAULO C.M.D. MESQUITA1, DANIEL C. PASSOS2 and SONIA Z. CECHIN1
1Laboratório de Herpetologia, Departamento de Biologia, Universidade Federal de Santa Maria,
Avenida Roraima, 1000, 97105-900 Santa Maria, RS, Brasil 2Núcleo Regional de Ofiologia/NuROF, universidade Federal do Ceará/uFC,
Campus do Pici, Centro de Ciências, Bloco 905, 60455-760 Fortaleza, CE, Brasil
Manuscript received on May 28, 2012; accepted for publication on February 27, 2013
ABSTRACT
The choice of sampling methods is a crucial step in every field survey in herpetology. In countries where time and financial support are limited, the choice of the methods is critical. The methods used to sample snakes often lack objective criteria, and the traditional methods have apparently been more important when making the choice. Consequently researches using not-standardized methods are frequently found in the literature. We have compared four commonly used methods for sampling snake assemblages in a semiarid area in Brazil. We compared the efficacy of each method based on the cost-benefit regarding the number of individuals and species captured, time, and financial investment. We found that pitfall traps were the less effective method in all aspects that were evaluated and it was not complementary to the other methods in terms of abundance of species and assemblage structure. We conclude that methods can only be considered complementary if they are standardized to the objectives of the study. The use of pitfall traps in short-term surveys of the snake fauna in areas with shrubby vegetation and stony soil is not recommended.
Key words: Caatinga, comparison, pitfall traps, Squamata, techniques.
Correspondence to: Paulo Cesar Mattos Dourado Mesquita E-mail: [email protected]
INTRODUCTION
The choice of sampling methods of biodiversity should be the most cost-effective as possible in attending to the requirements of the research. In this perspective, several factors must be considered: the surveyed taxon, research objectives, environment studied, time available for the development of the field work, and availability of financial resources (Aurichio and Salomão 2002, Silveira et al. 2010, Spence-Bailey et al. 2010).
Sampling methods for herpetofauna can be applied in the presence or absence of the researcher
in the field (heyer et al. 1994, Franco et al. 2002,
Willson and Dorcas 2004, Silveira et al. 2010). The most used methods to capture snakes that require
the presence of researchers in the field are:
time-constrained search (TCS), transects and occasional
encounters by the research staff (OE) (Franco et al. 2002). The OE method is often criticized because
it is hard to standardize, as it is not subject to strict planning. Nevertheless, this sampling technique has been useful and used by a large number of researchers in different neotropical biomes (see
Martins and Oliveira 1998, Bernarde and Abe
Among the methods that do not require the
constant presence of the researcher in the field,
the most used methods are traps and occasional
encounters by thirds (OET). Among the traps, the
pitfall traps (PIT) are the most used in neotropical environments, while other techniques, such as
“funnel traps”, “glue traps”, and artificial shelters are
still rarely used possibly because of limited funding (Cechin and Martins 2000, Auricchio and Salomão 2002, Sawaya et al. 2008, Silveira et al. 2010).
The literature on the methods of sampling
snakes indicates a different efficiency for each
method in different environments, and treats the snake fauna included in the studies of herpetofauna in general (Cechin and Martins 2000, Ribeiro-Júnior et al. 2008). Not specifying the methods for the group often leads to the snakes being subsampled (Greenberg et al. 1994, Parris 1999, Gardner et al. 2007, Garden et al. 2007, Ribeiro-Júnior et al. 2011).
Unlike studies on many animal groups, where
specific methods for the studied groups are
deve-loped, the methods for sampling snakes usually follow traditional methods for collecting general herpetofauna, rather than targeting the group itself (e.g. Vogt and Hine 1982, Jacobson 1984, Stubbs et al. 1984, Coyne 1994, Gascon 1994, Jones and
hayes-Odum 1994, Mcdiarmid and Altig 1999,
Auricchio and Salomão 2002, Franco et al. 2002, Freilich et al. 2005, Willson and Dorcas 2004), despite the knowledge of the wide variety of shapes and habits that snakes may have (Cadle and Greene 1993). Studies that focus on snakes often rely on multiple methods to sample snakes in order to capture the highest number of individuals and thus obtaining a good representation of the assemblage richness (e.g. Bernarde and Abe 2006, Sawaya et al. 2008). The major problem of the simultaneous use of several
methods is the difficulty in standardizing the samples of each method, making it difficult to compare the efficiency between these and adding sampling biases to the final results on the research (Silva 2010).
Shine and Bonnet (2000) indicate that snakes are good model organisms for many ecological questions due to the natural history plasticity of the group. The authors showed that there is a growing trend in using snakes to test ecological theories. Nevertheless, the majority of studies on tropical snakes address species inventories and characteristics of the natural history of some species, rarely seeking the understanding of patterns and processes at the community level (but see Vitt and Vangilder 1983, Luiselli et al. 1998, Brown and Shine 2002, Luiselli 2006, Akani et al. 2007, Brooks et al. 2009). This is an issue that deserves more attention as it is known that most species of snakes and the richest assemblages occur in tropical environments (Vitt
1987, Greene 1997, Martins and Oliveira 1998).
Herein we present a comparison between four of the most commonly used methods to sample
snakes (TCS, OET, OE and PIT) in relation
to the main limiting factors: capture rate over
time; financial cost for each snake collected and
environment while discussing the relationship and applicability in studies of species inventories and community ecology.
MATERIALS AND METHODS
STUDY AREA
The study area was the experimental farm Vale do Curu (main entrance: 03°49’06.1’’S / 39°20’14.8’’W, GPS Datum: WGS 84) in Pentecoste Municipality, State of Ceará, Northeast Brazil. It is a semiarid region with an annual mean temperature of 26.8°C, 73% relative humidity, and 723.3 mm of rainfall with a remarkable seasonality in the rainfall regime with a wet period from February to July and a dry period for the rest of the year (Barros et al. 2002, Leão et al. 2004).
Between January 2008 and June 2010, we made monthly visits to the study area, in which each
visit lasted approximately 90 hours. during the first
We considered each method as follows: time-constrained search (TCS), occasional encounters
by the staff (OE), occasional encounters by third (OET) and pitfall traps with drift-fences (PIT).
TCS
Consisted of the search for snakes on foot or by car (maximum speed of 25 km/h) carried out by three people at a slow pace in trails and roads within the area and surroundings. Each month we carried out a total of 24 hours of TCS, with 22 hours of TCS by foot and two hours by car. For logistical issues, we carried out 16 hours of diurnal TCS and eight hours of nocturnal TCS each month. For this method the initial investment was approximately $170.00
(uSd) (flashlight + hook for handling snakes +
sampling bags + batteries). We did not include the expenses for the car fuel because the search by car occurred exclusively during the traveling from and to the original city in a vicinal road and a road within the study area.
OE
Consisted of the encounter of snakes during the
field campaign when TCS was not being applied.
We estimate the time that the staff was subject to
OE in 46 hours per month (90 hours total, less 24 hours of TCS = 66 hours; less 20 hours of estimated
period of inactivity of the researchers). There was
no specific cost for the application of this method.
PIT
Consisted of three sets of traps installed in three different vegetation types (arboreal Caatinga,
shrub Caatinga and river floodplain). Each set of
traps was composed of 20 plastic containers (50 liters) buried in the soil in radial conformation
interconnected by five meter long and 60 cm high
drift fences (Mengak and Guynn-Jr 1987). A total of 60 containers were installed.
Within each bucket, we placed litter and a sheet of Styrofoam to serve as shelter against the weather conditions for the captured animals. We chose not
to follow the suggestion of Cechin and Martins (2000), of a linear conformation of the traps and 100 L buckets, because the stony soil and the shrubby vegetation make this alternative unfeasible. Each container was kept open for 60 hours. Considering the three sets of traps (60 buckets), we totalized 3,600 hours of PIT per month. The traps were checked
every 20 hours during the field campaigns. For this
method, the initial investment was approximately $1,260.00 (USD) (buckets + drift-fences (including replacements) + payment for local workers that helped digging the soil for the installation of the traps). We did not include the costs of durable equipment that was easily obtained in rural areas such as shovels, crowbars, and pickaxes because most of them were provided by the local workers.
OET
To fit the legal requirements and to standardize the effort of OET, a single local worker was trained during the first six months of the pilot
study for the techniques of handling and capturing snakes (training time consisted of 72 hours) and we requested him to capture only the snakes he encountered occasionally during his daily activities. The native collector was not paid to avoid the active sampling of animals. As snake encounters by this method are merely incidental, we considered
the effort of OET as 540 monthly hours (720 h
reduced by 180 h of the estimated inactivity of
the collector). The cost of OET was nearly $20.00
(USD) (a handcrafted hook + plastic containers to store the snakes).
Expenses with accommodation and transport for the study area were not included because these costs are not inherent to any particular method.
ANALYSIS
We compared the observed and estimated species
richness (Sobs and Sest, respectively) using the first
a better visual comparison, we have built sample-based rarefaction curves for the richness estimated for each method and for all the methods together (Gotelli and Colwell 2001).
We measured the snout-vent length (SVL) of captured snakes and compared it by each method
through the analysis of variance (ANOvA) and post hoc Tukey’s pairwise test to verify the differences in the size classes of the snakes captured. All analyses were performed with an alpha set at 0.05.
The capture rate of the snakes was evaluated as a function of the monetary investment (in USD invested/snake captured) and the time spent (in hours of effort/snake captured). We also observed the presence or absence of untargeted species captured by each method.
In order to access the suitability of using the combination of these methods in ecological studies, we compared the structures of the assemblage (composition, richness, and abundance) indicated by each method by building diagrams of the distribution of abundances for each method and by a cluster analysis UPGMA (Unweighted Pair Group method with Mean Arithmetic) using Euclidean distances as a measure of similarity between the structures resulted from each method.
RESULTS
NuMBER OF INDIVIDUALS AND SPECIES RICHNESS
After 24 months of samplings, we recorded 620 snakes through the four evaluated methods. TCS
responded for 55.8% (n = 346) of the captures, followed by OET with 37.1% (n = 230), PIT (n = 23), and OE (n = 21) contributed with less than 4%
each (Table I).
All methods together captured 22 species of
snakes. OET was the method that captured the highest number of species (n = 20), followed by TCS (n = 19), OE (n = 10) and PIT (n = 7).
The first order Jackniffe estimator of richness
predicted an assemblage composed of 22 (Sobs) to
26 species (Sest = 25.83) based on all the methods
together. The same estimator predicts a richness
of 23 species for OET (estimated value = 22.88), 22 species for TCS (estimated value = 21.88), 18 species for OE (estimated value = 17.67) and 11 species for PIT (estimated value = 10.83).
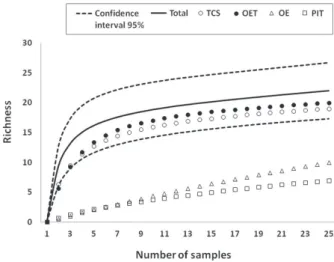
Observing the rarefaction curves, the methods of OE and PIT were far from reaching the plateau,
in spite of the relatively high effort (especially for
PIT). TCS and OET showed similar patterns in their
curves, after a fast growth in the early samples both maintained a slow and steady growth until the end
of the study, while OE and PIT showed a slow and continuous growth since the first samples (Figure 1).
Figure 1 - Sample-based rarefaction curves for all sampling
methods. Confidence interval is shown only for all methods together. TCS: time-constrained survey, OET: occasional encounters by thirds, PIT: pitfall traps, OE: occasional encounters by the field staff.
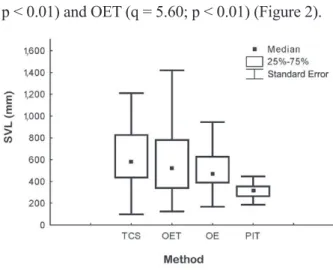
DIFFERENCES IN THE SIzES OF SNAKES CAPTURED
TCS captured snakes between 98 and 1,210 mm
SvL (mean = 623.22 ± Sd 243.27), OET captured snakes between 125 and 2,300 mm (mean = 575.40 ± Sd 313.90), OE between 169 and 1,250 mm (mean = 531.05 ± Sd 267.14) and PIT captured individuals between 186 and 580 mm (mean = 322.35 ± Sd 83.41).
The results from the ANOvA (F = 8.19; p =
the shorter amplitude of sizes and were significantly smaller than those captured by TCS (q = 6.76; p < 0.01) and OET (q = 5.60; p < 0.01) (Figure 2).
FINANCIAL COSTS
One snake was captured for every $ 0.49 uSd invested in TCS, $ 0.09 uSd in OET, no specific cost was estimated for OE, and one snake for every
$ 54.78 USD invested in PIT.
TIME COSTS
TCS was the method with the highest rate of capture at nearly 0.6 snakes per hour, or approximately one snake every 1 hour and 40 minutes of effort.
The methods of OET and OE showed similar encounter rates of 0.018 snake/hour (OET) and 0.019 snake/hour (OE), or approximately one
snake every 55 hours and 30 minutes of effort in
OET and one snake every 52 hours and 40 minutes in OE. PIT presented the lowest capture rate with
0.0053 snakes/hour (considering one set of traps, i.e. 20 buckets) or one snake every 187 hours and 40 minutes. If we consider the three sets of traps, the success rate falls to 0.0018 snakes/hour and considering each bucket individually the capture rate is 0.00026 snakes/hour, or one snake for every 3,756 hours and 30 minutes of effort in PIT.
Figure 2 - Non-outlier relation between size and sampling method for snakes in the study area. TCS: time-constrained
survey, OET: occasional encounters by thirds, PIT: pitfall traps, OE: occasional encounters by the field staff.
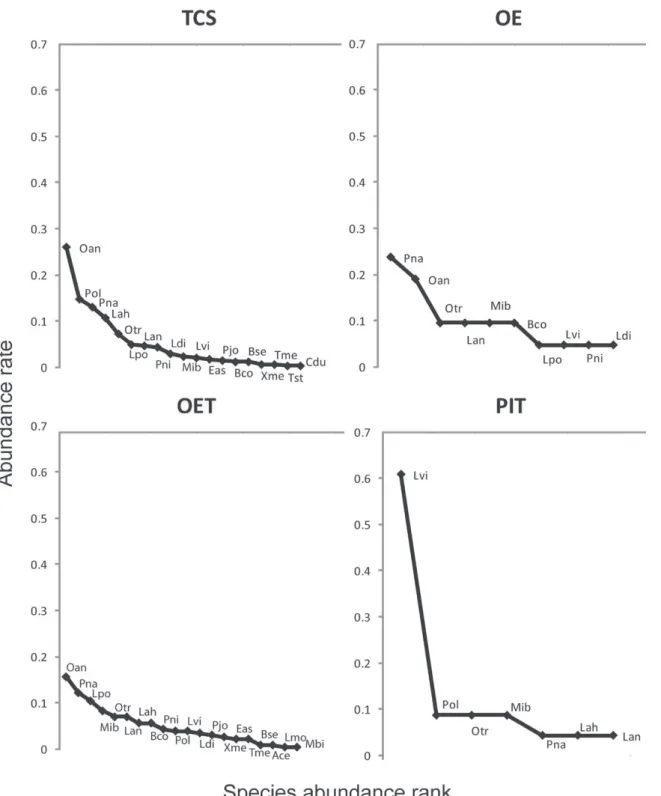
ASSEMBLAGE STRUCTURE
Three species were registered exclusively by
OET (Apostolepis cearensis [n = 2], Liophis mossoroensis [n = 1] and Mastigodryas bifossatus [n = 1]), two only by TCS (Crotalus durissus [n=1] and Thamnodynastes cf. strigilis [n=1]) and no exclusive species were captured by OE or PIT
(Figure 3).
The diagrams of distribution of abundances represent the importance of each component of the assemblage indicated by each method; we observed that PIT is the only method with a strong trend toward a single species (Figure 3).
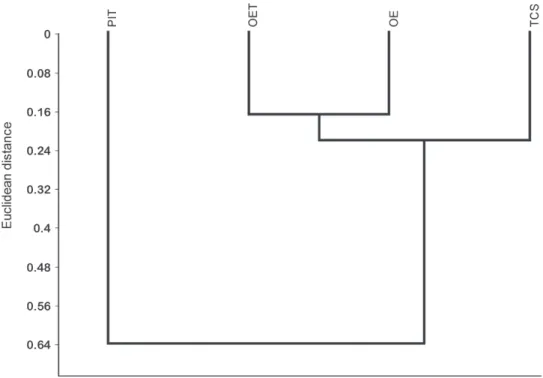
Regarding the assemblage structure (species composition, richness, and abundance) that is indicated by each method, the UPGMA formed a
group including TCS, OET, and OE, whereas PIT
did not cluster (Figure 4).
DISCUSSION
TCS and OET were the most efficient methods
in terms of representation of the richness of the area. The rarefaction curves for those methods were within the range of 95% of the sample-based rarefaction curves of all methods together. Although
the rarefaction curves of TCS and OET nearly
reached the plateau at the end of the samplings, we observed that the sample-based curves did not reach a steady plateau for any of the methods, which was expected as it is virtually impossible to sample all the species from any biological community (Gotelli and Colwell 2001).
TCS was the method with the highest rate of captures, and it resulted in a good representation of the richness as its estimated richness was the same as the total number of species known for the
area observed, including all the methods. Overall, the financial costs of TCS are low, but the results
disadvantage of being very physically demanding
and requires prior training and good fitness of the field staff. It has the advantage of being the most efficient method regarding the capture rate of snakes
over time, presenting a relatively low maintenance cost (basically the replacement of batteries) and a reasonable rate of catch per monetary unit invested ($ 0.49 USD per snake). Another advantage of TCS is that there is no mortality or capture of untargeted species. In addition to that, because it
is a method specifically directed to the capture of snakes, it allows field observations of the activity
and behavior of the snakes, providing valuable information on ecology and natural history of
many species. Our TCS results support the option
made by Brown and Shine (2002) that used TCS exclusively in their study on ecological patterns in a tropical snake assemblage.
OET was a good representative of the snake
assemblage in the area; the estimated richness by this method was only one species higher than what is known to the area. Although there
is a slow addition of individuals per hour, this addition is constant throughout the study period, which increases the probability of success of the method. The three species captured exclusively by
this method clearly show the importance of OET
in studies with snakes in semi-arid environments.
OET has a disadvantage because it may be biased
by the day to day work areas and schedule of the local collector, for example if the collector works in crops with seasonal harvest and, therefore, information about the seasonal activity of the captured snakes should be discarded because of the
periods that the collector stays longer in field.
Sometimes it is argued that one cannot rely on the information given by locals, but this problem can be mitigated by decreasing the number of collectors and training them properly, thus valuing the quality of the information rather than the quantity (Dorcas and Willson 2009). Another disadvantage of this method is the time required
for training the collectors. OET is a method
recognized as controversial and rarely the authority
Figure 4 - UPGMA dendrogram representing the similarities among the assemblage structure obtained
responsible for environmental permits authorizes its use, because it allegedly encourages the killing of snakes (Akani et al. 2007). During our study, no snakes were killed by the trained collector, although he did occasionally collect some animals that were roadkill or killed by other locals.
OET is advantageous because it requires
almost no maintenance and - at least initially - local people from the study area tend to see more animals than recently arrived researchers. It also enables the researcher to collect information throughout the study period, even without the presence of
researchers in the field (FitzGibbon and Jones 2006,
Franco et al. 2002). Those are important reasons for
the participation of local helpers in field research
that requires snake sampling, as long as they are not paid and receive previous training in all aspects of this method (e.g. human and animal safety).
OE was not efficient regarding the number
of individuals in this study because of the relatively short time of possible encounters by
OE. The method presents a slow rate of addition
of new species, but the capture rate in hours of
application is very similar to that of OET. zanella
and Cechin (2006) intuitively named this method
as “Occasional Encounters by Thirds”, which is
consistent with our results. Because, similarly
to OE, every snake encounter by OET is merely
incidental and it should obviously have the same probability of occurrence in the absence of
observer bias. Another advantage of OE is that there are no specific financial costs involved.
PIT was the least efficient method in all aspects
evaluated in this study. It is the least representative of the observed richness, did not capture any exclusive species, has the lowest capture rate, and
the highest financial investment by snake captured
(more than 100 times higher than TCS). Gibbons and Semlitsch (1982) suggest that PIT presents
problems due to the variable efficiency in sampling
different species. From 23 PIT-trapped individuals,
60.86% (n=14) belonged to a single small-sized
species (Liophis viridis) and it was the only method
with a significant difference in the size class of the
sampled snakes, tending to catch smaller snakes and in a smaller size range. There is evidence that
the size of the containers influences the capture
rate and size of the snakes caught, so the constraint observed in our studies may be due to the size of the buckets we used (Cechin and Martins 2000, Todd et al. 2007). However, with the impossibility of using larger containers in stony soils as those of many areas of the Brazilian Caatinga, this method is not advantageous in this type of environment.
Considering the financial expenses of PIT, it is
recommended in studies where it is expected that a large number of terrestrial, fossorial, and cryptozoic snakes, in long-term studies and at sites that are relatively plain and with sandy soils (Enge 2001, Rueda-Almonacid et al. 2006).
Among the methods evaluated, PIT is also the
method that requires the greatest time and financial
investment in maintenance due to damage to the drift-fences caused by intense solar radiation, low humidity, and animal or human action. Furthermore, the installation period is physically demanding because of the stony ground and high temperatures,
requiring a large number of field-assistants (in this study, ten assistants) resulting in higher financial
expenses. Ribeiro-Júnior et al. (2008) suggest that PIT is a cost-effective method for sampling lizards, amphibians, and small mammals. In this study, we demonstrate that the same cannot be said about snakes in the semi-arid regions in Brazil. This is consistent with the results in other areas that also captured a low number of snakes, even using larger containers than those used in our study (Ribeiro-Júnior et al. 2011).
As found by Garden et al. (2007) and Enge (2001), the number of untargeted groups, such as invertebrates, frogs, lizards, and small mammals, captured by PIT is high, making the method advantageous for general faunistic inventories, but not
was the only method in which the mortality of the untargeted species was observed even though the
mortality rate has not been quantified.
It is difficult to compare the eficiency of
PIT in different biomes, because, each study use slightly different delineation to apply this method. Nevertheless the capture rate of snakes per container per month was much lower than the rates for other regions of Brazil, even considering studies that used smaller containers (Cechin and Martins 2000). Although pragmatically, this relationship is not the most appropriate because containers connected by drift-fences should not be considered as independent units, but we chose to discuss this in order to be able to compare the available information. The most obvious advantages of PIT is that, after installation and proper maintenance, the sampling is passive and does not require a constant presence
in the field for long periods, it is not biased by the
researcher experience, and it allows some extent of
quantification of prey availability.
Our results are consistent with Silveira et al.
(2010), Garden et al. (2007), and Enge (2001) that PIT sample small and medium-sized animals or juveniles of larger animals, with terrestrial or fossorial habits. While active methods are usually more general, and record a wide variety of species. Campbell and Christman (1982) suggest that PIT capture animals rarely found by visual encounters, which was not corroborated for snakes in this semi-arid area, but it has been demonstrated for other tropical biomes (e.g. zanella and Cechin 2006, Sawaya et al. 2008).
We showed that TCS, OET, and OE are grouped
and could be compared regarding the structure of the assemblage while the results obtained by PIT are inappropriate for comparisons in studies that are based on abundances or assemblage structure at least in semiarid regions. PIT resulted in a very different assemblage structure compared to the other methods due to the strong tendency to capture only a small group of species, being unable to capture even some of the most abundant species.
The study area should also be considered
for the methods to be cost-effective. Our results
indicate that in semi-arid areas with stony soil, the most cost-effective set of sampling methods
tested are TCS, OET, and OE. We suggest the
non-application of PIT under the given conditions, and research of tropical areas should also consider other sampling methods not tested here, such as box and funnel traps that have been successfully used in many extratropical environments (Kjoss and Litvaitis 2001).
In conclusion, although it is one of the most
efficient methods to sample other groups of
herpetofauna, and therefore extremely useful in faunistic inventories, PIT was ineffective in catching snakes in the Brazilian semiarid region. Considering
the difficult to sample snakes in the field (Reinert
1993), the limited time and funding, we suggest that the time and funds usually invested in PIT should be invested in other methods that are more cost-effective and that are truly complementary, especially in shrubby environments with stony soils. Furthermore,
we suggest that when there are the simultaneous uses of different methods, the sampling effort should be standardized (in hours of effort, for example) to allow comparisons between different methods and studies (Ribeiro-Júnior et al. 2011). We agree with Silveira et al. (2010) that the methods should be used, focusing neither on convenience nor tradition, but rather fundamentally to obtain quality data that provide
results that fulfill the objectives of the study (Measey
2006, Garden et al. 2007, Ribeiro-Junior et al. 2008, Dorcas and Willson 2009, Spence-Bailey et al. 2010).
Species TCS OET OE PIT
Apostolepis cearensis Gomes, 1915 0 2 0 0
Boa constrictor Linnaeus, 1758 4 13 1 0
Boiruna sertaneja zaher, 1996 5 2 0 0
Crotalus durissus (Linnaeus, 1758) 1 0 0 0
Epicrates assisi Machado, 1945 6 4 0 0
Leptodeira annulata (Linnaeus, 1758) 16 15 1 1
Leptophis ahaetulla (Linnaeus, 1758) 37 13 0 1
Liophis dilepis (Cope, 1862) 10 7 2 0
Liophis mossoroensis Hoge & Lima-Verde, 1972 0 1 0 0
Liophis poecilogyrus Wied, 1825 17 29 1 0
Liophis viridis Günther 1862 7 9 3 14
Mastigodryas bifossatus (Raddi, 1820) 0 1 0 0
Micrurus ibiboboca (Merrem, 1820) 8 18 1 2
Oxybelis aeneus (Wagler, 1824) 87 36 4 0
Oxyrhopus trigeminus Duméril, Bibron & Duméril 1854 28 16 3 2
Philodryas nattereri Steindachner, 1870 44 28 3 1
Philodryas olfersii (Lichtenstein, 1823) 52 9 0 2
Pseudoboa nigra (Duméril, Bibron & Duméril, 1854) 15 9 2 0
Psomophis joberti (Sauvage, 1884) 5 7 0 0
Tantilla melanocephala (Linnaeus, 1758) 1 5 0 0
Thamnodynastes cf. strigilis (Mikan, 1828) 1 0 0 0
Xenodon merremii (Wagler, 1824) 2 6 0 0
TABLE I
Number of individuals of the species captured by each method at Pentecoste municipality, Northeast Brazil.
ACKNOWLEDGMENTS
We would like to thank Dra. Teresa Cristina Sauer ávila-Pires, Dra. Noeli zanella, Dra. Maria da Graça Salomão, and Dr. Everton Behr for their valuable
suggestions on the first versions of the manuscript.
Dra. Diva Maria Borges-Nojosa and the staff of
the Núcleo Regional de Ofiologia/universidade
Federal do Ceará for material and logistic support.
ICMbio for the license code: SISBIO/18596-1.
Coordenação de Aperfeiçoamento de Pessoal
de Nível Superior (CAPES) for the financial
desenvolvimento Científico e Tecnológico (CNPq)
for the research funding (protocol 303359/2009-9).
RESUMO
A escolha de métodos de amostragem é um passo crucial em todas as pesquisas de campo em herpetologia. Em países onde há frequentemente limitações de tempo e apoio financeiro a escolha dos métodos é crítica. Os métodos utilizados para amostrar as serpentes por vezes carecem de critérios objetivos e aparentemente a tradição tem sido mais importante para a escolha. Consequentemente, pesquisas usando métodos não padronizados são frequentemente encontradas na literatura. Nós comparamos quatro métodos comumente utilizados para a amostragem de taxocenoses de serpentes em uma área semiárida no Brasil. Comparamos a eficácia de cada método baseado no custo-benefício em relação ao número de indivíduos e espécies capturadas, investimento de tempo e financeiro. Constatamos que armadilhas de “pitfall” foi o método menos eficiente em todos os aspectos avaliados além de não ter sido complementar aos outros métodos, em relação à abundância das espécies e estrutura da assembleia. Concluímos que os métodos podem ser considerados complementares apenas se padronizados para os objetivos do estudo. O uso de armadilhas de queda em pesquisas de curto prazo da fauna de serpentes em áreas arbustivas e de solo pedregoso não é recomendado.
Palavras-chave: Caatinga, comparação, armadilhas pitfall, Squamata, técnicas.
REFERENCES
AKANI GC, EBERE N, LUISELLI L AND ENIANG EA. 2007.
Community structure and ecology of snakes in fields of oil
palm trees (Elaeis guineensis) in the Niger Delta, southern Nigeria. Afr J Ecol 46: 500-506.
ARAuJO CO, CORRÊA-FILhO DT AND SAWAYA RJ. 2010. Snake assemblage of Estação Ecológica de Santa Bárbara, SP: A Cerrado remnant in southeastern Brazil. Biota Neotrop 10(2): 235-245.
AuRIChIO P AND SALOMãO MG. 2002. Técnicas de coleta e
preparação de vertebrados para fins científicos e didáticos.
São Paulo: Instituto Pau Brasil de História Natural, 348 p. BARROS VS, COSTA RNT AND AGUIAR JV. 2002. Função de pro-dução da cultura do melão para níveis de água e adubação nitrogenada no Vale do Curu - CE. Irriga 7(2): 98-105.
BERNARDE PS AND ABE AS. 2006. A snake community at
Espigão Oeste, Rondônia, Southwestern Amazon, Brazil.
South Am J Herpetol 1(2): 102-113.
BROOKS SE, ALLISON EH, GILL JA AND REYNOLdS JD. 2009.
Reproductive and trophic ecology of an assemblage of aquatic and semi-aquatic snakes in Tonle Sap, Cambodia. Copeia 2009(1): 7-20.
BROWN GP AND SHINE R. 2002. Influence of weather conditions
on activity of tropical snakes. Austral Ecol 27: 596-605. CADLE JE AND GREENE HW. 1993. Phylogenetic patterns,
biogeography, and the ecological structure of Neotropical snake assemblages. In: RICKLEFS RE AND SCHLUTER D (Eds), Species diversity in ecological communities: historical and geographical perspectives, Chicago: University of Chicago Press, p. 281-293.
CAMPBELL HW AND CHRISTMAN SP. 1982. Field techniques for herpetofaunal community analysis. In: Scott Jr NJ (Ed), Herpetological Communities. Washington: Society for the Study of Amphibians and Reptiles and Herpetologists’ League, p. 193-200.
CECHIN Sz AND MARTINS M. 2000. Eficiência de armadilhas
de queda (pitfall traps) em amostragem de répteis e anfíbios no Brasil. Rev Bras zool 17(3): 729-740. COLWELL RK. 2005. EstimateS: Statistical estimation of species
richness and shared species from samples. Version 7.5. User’s Guide and application (http://purl.oclc.org/ estimates).
COYNE MS. 1994. Feeding ecology of subadult green sea turtles in south Texas waters. Thesis, Master of Science, Texas A&M University, 86 p.
DIxO M AND MARTINS M. 2008. Are leaf-litter frogs and lizards affected by edge effects due to forest fragmentation
in Brazilian Atlantic forest? J Trop Ecol 24: 551-554.
DORCAS M AND WILLSON JD. 2009. Innovative methods for studies of snake ecology and conservation. In: Mullin SJ and Seigel RA (Eds), Snakes: Ecology and Conservation Ithaca, Cornell University Press, p. 5-37.
ENGE KM. 2001. The pitfalls of pitfall traps. J Herpetol 35(3): 467-478.
FITzGIBBON S AND JONES D. 2006. A community-based wildlife survey: the knowledge and attitudes of residents of suburban Brisbane, with a focus on bandicoots. Wildlife Res 33: 233-241.
FRANCO FL, SALOMãO MG AND AuRIChIO P. 2002. Répteis. In: Aurichio P and Salomão MG (Eds), Técnicas de
coleta e preparação de vertebrados para fins científicos
e didáticos. São Paulo: Instituto Pau Brasil de História Natural, p. 75-125.
FREILICH JE, CAMP RJ, DUDA JJ AND KARL AE. 2005. Problems with Sampling Desert Tortoises: A Simulation Analysis Based on Field Data. J Wildlife Manage 69(1): 45-56. GARDEN JG, MCALPINE CA, POSSINGhAM HP AND JONES DN.
2007. Using multiple survey methods to detect terrestrial reptiles and mammals: what are the most successful and
GARDNER TA, BARLOW J AND PERES CA. 2007a. Paradox, presumption and pitfalls in conservation biology: The importance of habitat change for amphibians and reptiles. Biol Conserv 138: 166-179.
GARDNER TA, FITzHERBERT EB, DREWERS RC, HOWELL KM
AND CARO T. 2007b. Spatial and temporal patterns of abundance and diversity of an East African leaf litter amphibian fauna. Biotropica 39(1): 105-113.
GASCON C. 1994. Bottom-nets as a new method for quantita-tively sampling tadpole populations (Amphibia, Anura). Rev Bras zool 11(2): 355-359.
GIBBONS JW AND SEMLITSCH RD. 1982. Terrestrial drift fences with pitfall traps: an effective technique for quantitative sampling of animal populations. Brimleyana 1982: 1-16. GOTELLI NJ AND COLWELL RK. 2001. Quantifying biodiversity:
procedures and pitfalls in the measurement and comparison of species richness. Ecol Lett 4: 379-391.
GREENBERG CH, NEARY DG AND HARRIS LD. 1994. A com-parison of herpetofaunal sampling effectiveness of pitfall, single-ended, and double-ended funnel traps used with drift fences. J Herpetol 28(3): 319-324.
GREENE HW. 1997. Snakes: the evolution of mystery in nature. Berkeley: University of California Press, 351 p.
HARTMANN PA, HARTMANN MT AND MARTINS M. 2009a. Ecology of a snake assemblage in the Atlantic forest of southeastern Brazil. Pap Avulsos zool 49(27): 343-360. HARTMANN PA, HARTMANN MT AND MARTINS M. 2009b.
Ecologia e história natural de serpentes no Núcleo Santa Virgínia do Parque Estadual da Serra do Mar, no sudeste do Brasil. Biota Neotrop 9(3): 173-184.
HEYER WR, DONNELLY MA, MCDIARMID RW, HAYEK LC
AND FOSTER MS. 1994. Measuring and Monitoring Biological Diversity: Standard Methods for Amphibians. Washington: Smithsonian Institution Press, 384 p. HUANG C AND HOu PL. 2004. Density and diversity of litter
amphibians in a monsoon forest of Southern Taiwan. zool Stud 43(4): 795-802.
JACOBSON ER. 1984. Immobilization, Blood Sampling, Necropsy Techniques and Diseases of Crocodilians: A Review. J zoo Anim Med 15(1): 38-45.
JONES D AND HAYES-ODUM L. 1994. A method for the restraint and transport of crocodilians. Herpetol Rev 25: 14-15. KJOSS VA AND LITVAITIS JA. 2001. Comparison of 2 methods
to sample snake communities in early successional habitats. Wildlife Soc B 29(1): 153-157.
LEãO RAO, TEIXEIRA AS, ANDRADE EM AND OLIVEIRA F.
2004. Automatic delimitation and characterization of a catchment located at the Fazenda Experimental do Vale do Curu in Pentecoste County – Brazil. Rev Cienc Agron 35(1): 26-35.
LUISELLI L. 2006. Resource partitioning and interspecific
competition in snakes: the search for general geographical
and guild patterns. Oikos 114: 193-211.
LUISELLI L, AKANI GC AND CAPIzzI D. 1998. Food resource partitioning of a community of snakes in a swamp rainforest of south-eastern Nigeria. J zool 246: 125-133.
MAGURRAN AE. 2004. Measuring Biological Diversity.
Oxford: Blackwell Science, 264 p.
MARTINS M AND OLIVEIRA ME. 1998. Natural history of snakes in forests of Manaus region, Central Amazonia, Brazil. Herpetol Nat Hist 6(2): 78-150.
MCDIARMID RW AND ALTIG R. 1999. Tadpoles: The Biology of anuran larvae. Chicago: University of Chicago Press, 458 p.
MEASEY GJ. 2006. Surveying biodiversity of soil herpetofauna: towards a standard quantitative methodology. Eur J Soil Biol 42(2006): 103-110.
MENGAK MT AND GUYNN Jr DC. 1987. Pitfalls and snap traps for sampling small mammals and herpetofauna. Am Mid Nat 118(2): 284-288.
PARRIS KM. 1999. Review: amphibian surveys in forests and woodlands. Contemp Herpetol 1999: 1-14.
PRUDENTE ALC, MASChIO GF, SANTOS-COSTA MC AND
FEITOSA DT. 2010. Serpentes da bacia petrolífera de Urucu, Município de Coari, Amazonas, Brasil. Acta Amazo 40(2): 381-386.
REINERT HK. 1993. Habitat selection in snakes. In: Seigel RA and Collins JT (Eds), Snakes: Ecology and Behavior. New York: McGraw-Hill, p. 201-240.
RIBEIRO-JÚNIOR MA, GARDNER TA AND áVILA-PIRES TCS.
2008. Evaluating the Effectiveness of Herpetofaunal Sampling Techniques across a Gradient of Habitat Change in a Tropical Forest Landscape. J Herpetol 42(4): 733-749. RIBEIRO-JÚNIOR MA, ROSSI RV, MIRANDA CL AND á
VILA-PIRES TCS. 2011. Influence of pitfall trap size and design
on herpetofauna and small mammal studies in Neotropical Forest. zoologia 28(1): 80-91.
RUEDA-ALMONACId JV, CASTRO F AND CORTEz C. 2006.
Técnicas para el inventario y muestreo de anfibios: una compilación. In: ANGuLO A ET AL. (Eds), Técnicas de Inventario y Monitoreo para los Anfibios de la Región
Tropical Andina. Bogotá: Conservación Internacional, p. 135-171.
SAWAYA RJ, MARQUES OAv AND MARTINS M. 2008. Compo-sição e história natural das serpentes de Cerrado de Itirapina, São Paulo, sudeste do Brasil. Biota Neotrop 8(2): 127-148.
SHINE R AND BONNET X. 2000. Snakes: a new ‘model organism’
in ecological research? Trends Ecol Evol 15: 221-222.
SILVA FR. 2010. Evaluation of survey methods for sampling anuran species richness in the Neotropics. S Am J Herpetol 5(3): 212-220.
SILVEIRA LF, BEISIEGEL BM, CuRCIO FF, VALduJO PH, DIxO M, VERDADE VK, MATTOx GMT AND CUNNINGHAM PTM.
2010. Para que servem os inventários de fauna? Estud Av
24(68): 173-207.
SIQUEIRA CC ET AL. 2009. Density and richness of leaf litter frogs (Amphibia: Anura) of an Atlantic Rainforest area
in the Serra dos Orgãos, Rio de Janeiro State, Brazil.
SPENCE-BAILEY LM, NIMMO DG, KELLY LT, BENNETT AF AND
CLARKE MF. 2010. Maximising trapping efficiency in reptile
surveys: the role of seasonality, weather conditions and moon phase on capture success. Wildlife Res 37: 104-115. STUBBS D, HAILEY A, PuLFORd E AND TYLER W. 1984.
Popu-lation Ecology of European Tortoises: Review of Field Techniques. Amphibia-Reptilia 5(1): 57-68.
TOdd BD, WINNE CT, WILLSON JD AND GIBBONS JW. 2007.
Getting the Drift: Examining the Effects of Timing, Trap Type and Taxon on Herpetofaunal Drift Fence Surveys. Am Mid Nat 158: 292-305.
VITT LJ. 1987. Communities. In: SEIGEL JT ET AL. (Eds), Snakes: ecology and evolutionary biology. New York: McGraw-Hill, p. 335-365.
VITT LJ AND VANGILDER LD. 1983. Ecology of a snake community in Northeastern Brazil. Amphibia-Reptilia 4: 273-296.
VOGT RC AND HINE RL. 1982. Evaluation of techniques for assessment of amphibian and reptile populations in
Wisconsin. In: SCOTT Jr NJ (Ed), herpetological
Communities. Washington: Society for the Study of Amphibians and Reptiles and Herpetologists’ League, p. 201-217.
WINCK GR, SANTOS TG AND CECHIN Sz.2007. Snake assem-blage in a disturbed grassland environment in Rio Grande
do Sul state, southern Brazil: population fluctuations of
Liophis poecilogyrus and Pseudablabes agassizii. Ann zool Fenn 44: 321-332.
WILLSON JD AND DORCAS ME. 2004. A comparison of aquatic drift fence with traditional funnel trapping as a quantitative method for sampling amphibians. Herpetol Rev 35(2): 148-150.