www.jped.com.br
ORIGINAL
ARTICLE
Body
mass
index
reference
charts
for
individuals
with
Down
syndrome
aged
2---18
years
夽
,
夽夽
Fabio
Bertapelli
a,∗,
Maira
R.
Machado
a,
Raísa
do
Val
Roso
a,
Gil
Guerra-Júnior
baUniversidadeEstadualdeCampinas(UNICAMP),FaculdadedeCiênciasMédicas,Campinas,SP,Brazil
bUniversidadeEstadualdeCampinas(UNICAMP),FaculdadedeCiênciasMédicas,DepartamentodePediatria,Campinas,SP,Brazil
Received11February2016;accepted16April2016 Availableonline29June2016
KEYWORDS
Trisomy21; Bodymassindex; Weight;
Height; Growthcharts; Nutritionalstatus
Abstract
Objective: TodevelopBraziliangrowthchartsforbodymassindex(BMI-for-age)forindividuals withDownsyndrome(DS).ThesecondaryobjectivewastocomparetheBMI-for-agewiththe CentersforDiseaseControlandPreventionstandards(CDC).
Methods: Aretrospectiveandcross-sectionalgrowthstudyof706youthwithDS(56.7%males) wasperformedin51centersinSãoPaulostate,Brazil.Weightandheightwereusedtocalculate theBMI(kg/m2).TheLMSmethodwasappliedtoconstructthegrowthcharts.Z-scoreswere
basedontheCDC2000growthstandards.
Results: TheBMI-for-agereferencechartsshowedexcellentgoodnessoffitstatisticsforboys andgirlswithDSaged2---18years.At2yearsofage,themeanBMIZ-scoresofboysandgirls withDSwerelowercomparedtothoseoftheCDC(Z-score=−0.2).Incontrast,childrenwith DSaged3---18yearshadhighermeanZ-scoresforBMI-for-agewhencomparedtothoseofthe CDC(Z-scores=+0.2to+1.3).
Conclusions: TheBMIofBrazilianyouthwithDSdiffersfromthosereferencesestablishedby CDC.ThesearethefirstBrazilianBMI-for-agechartsforindividualswithDSandwillhopefully guideclinicians andparentsin theevaluationandmanagement ofthenutritional statusin childrenandadolescentswithDSinBrazil.
©2016SociedadeBrasileiradePediatria.PublishedbyElsevierEditoraLtda.Thisisanopen accessarticleundertheCCBY-NC-NDlicense(http://creativecommons.org/licenses/by-nc-nd/ 4.0/).
夽
Pleasecitethisarticleas:BertapelliF,MachadoMR,RosoRV,Guerra-JúniorG.Bodymassindexreferencechartsforindividualswith Downsyndromeaged2---18years.JPediatr(RioJ).2017;93:94---9.
夽夽
StudycarriedoutatUniversidadeEstadualdeCampinas(UNICAMP),Campinas,SP,Brazil. ∗Correspondingauthor.
E-mail:[email protected](F.Bertapelli).
http://dx.doi.org/10.1016/j.jped.2016.04.005
0021-7557/©2016SociedadeBrasileiradePediatria.PublishedbyElsevierEditoraLtda.ThisisanopenaccessarticleundertheCCBY-NC-ND
PALAVRAS-CHAVE
Trissomia21; Índicedemassa corporal; Peso; Estatura; Curvasde crescimento; Estadonutricional
GráficodereferênciadoÍndicedeMassaCorporalparaosindivíduoscomsíndrome deDownentre2e18anosdeidade
Resumo
Objetivo: Desenvolvercurvas específicasde Índicede MassaCorporal(IMC-para-idade) para populac¸ãobrasileiracomsíndromedeDown(SD).Oobjetivosecundáriofoicompararosvalores deIMC-para-idadecomosvaloresnormativosdoCentroparaoControledeDoenc¸asdosEstados Unidos(CDC).
Métodos: Trata-sedeestudodotiporetrospectivoetransversal.Aamostrafoiconstituídade 706 jovenscomSD (56,7%,meninos)recrutadosem 51 instituic¸ões noestadodeSãoPaulo, Brasil.PesoeestaturaforamobtidoseempregadosparaocálculodeIMC(Kg/m2).Ométodo
LMSfoiusadoparaaconstruc¸ãodascurvas.EscoresZforamcalculadoscombasenareferência doCDC2000.
Resultados: Ascurvas dereferência deIMC-para-idade para meninose meninascomSD na faixaetáriaentre2-18anosapresentaramexcelenteajusteestatístico.Aosdoisanosdeidade, o escoreZ médioIMC decrianc¸as comSD apresentou-semenor quandocomparadoao CDC (escoreZ=-0,2).Emcontraste,osescoresZmédiosdeIMCdejovenscomSDforamsuperiores nasidadesentre3-18anos(escoresZ=+0,2a+1,3).
Conclusões: Apopulac¸ãobrasileiracomSDapresentoudiferentespadrõesdeIMCquando com-paradaàsreferênciasdoCDC.Ascurvasdesenvolvidasnesseestudorepresentamaprimeira referência nacional deIMC-para-idade para jovenscom SD.Espera-se, portanto, queessas curvaspossamguiarpaiseprofissionaisnaavaliac¸ãodoestadonutricionaldecrianc¸ase ado-lescentescomSDnoterritóriobrasileiro.
©2016SociedadeBrasileiradePediatria.PublicadoporElsevierEditoraLtda.Este ´eumartigo OpenAccesssobumalicenc¸aCCBY-NC-ND(http://creativecommons.org/licenses/by-nc-nd/4. 0/).
Introduction
Down syndrome (DS) is a chromosomal disorder with an
approximate incidence between 3.05 and 14 cases per
10,000livebirthsintheUnitedStatesandChina.1,2Recent studies have shown a population prevalence between 6.1 and13.1per10,000persons.3,4Thelifeexpectancyof indi-viduals with DS has increased considerably over the past years.Astudysuggeststhat94.4%ofchildrenwithDSborn in 2000 will survive up to 2020, 90.8% up to 2030, and 76.3%upto2050.3Lifeexpectancyislinkedtothe develop-mentofresearchandservicesprovidedtothispopulation.5 Despitetheseadvances,childrenwithDShavehealth con-ditionsthataffecttheirqualityoflife,includingcongenital heart disease, hypothyroidism, gastrointestinal disorders, andobstructive sleepapnea.6 Accordingtothe guidelines of the AmericanAcademy of Pediatricsand of the Brazil-ianMinistryofHealth,individualswithDSalsohavegrowth restrictionandoverweight.7,8
The adequate monitoring of the nutritional status of youthwithDShelpstopreventandidentifyoverallhealth problems.The bodymassindex(BMI)isahealth indicator thatis commonlyusedtoclassifythenutritionalstatusof children, adults,andthe elderly. The Centers for Disease ControlandPrevention(CDC)hasrecommendedtheuseof BMItoassessthehealthstatusofchildrenolderthan2years. However,youthwithDShavedifferentweight,height,and BMI standards when compared tochildren in the general populationwithoutDS.9
Youth with DS aged 2---20 years had lower height and higherBMIwhencomparedtotheCDCcharts,suggestingthe needforspecificgrowthchartsforyouthwithDS.10InBrazil, theMinistryofHealthrecommendstheuseof the weight-for-agechartsbyCronketal.11formonitoringthenutritional statusof Brazilian youth withDS aged2---18 years. These chartscombinecross-sectionalandlongitudinaldata includ-ing730U.S.individualswithDSaged1monthto18years.11 Theclinicalandpracticaluseofthesecurves,however,had beenquestionedbytheAmericanAcademyofPediatrics.8
Due to the limitations of the existing charts and the absence of normative values of BMI-for-age for Brazilian youthwithDS,thisstudy aimed todevelop Brazilian BMI-for-agechartsforindividualswithDSaged2---18years.The secondaryobjectivewastocomparetheBMI-for-ageofthe studyparticipantswiththenormativevaluesestablishedby theCDC/2000.
Methods
Children and adolescents with DS aged 2---18 years were recruitedfromaretrospectiveandcross-sectionalstudy car-riedoutbetween2012and2015.Thestudywasconductedat UniversidadeEstadualdeCampinas,48specializedcenters thatprovide care toindividuals with intellectual disabili-ties,andtwospecializedcentersforindividualswithDS,all locatedinthestate ofSãoPaulo.The studywasapproved
by the Ethics Committee of the Faculdade de Ciências
140.186/2012).Aninformedconsentwassignedbyparents andguardians.
Clinicaldatarecordswere obtainedthroughinterviews with families and from medical records. A questionnaire wasappliedtoparentsandguardians,includinginformation onage, sex, gestationalage, comorbidities, medications, weight,height,andheadcircumference.Duringthe inter-view(2012---2014),informationwasalsoobtainedfromthe ChildHealthrecordCardandquestionnairesprovidedto par-ents(byhealthcarefacilities,medicalclinics,andhospitals inthecityofCampinas).Weightandheightweremeasured by a trained team. Participants were measured barefoot and wearinglight clothes. In Campinas, height was mea-suredusingaportablestadiometer,modelE210(Wiso®,SC,
Brazil).Weight wasmeasured usingadigital scale, model W801(Wiso®,SC,Brazil).
Data screening wascarried out in different stages: 1) Weexcludedduplicateddatabasedonidentificationcode, birthdate,andmeasurementdate;2)Weremoved outliers (fivestandarddeviationsaboveorbelowthemean);3)We excludeddatapointsdemonstratinglossofheightovertime. Thequestionnairesandclinicalrecordswerereviewedand datainconsistencieswereresolved.Weightandheightdata were used to calculate BMI using the following formula: BMI=weightdividedbyheightsquared(kg/m2).Generalized
additive modelsfor location, scale and shape (GAMLSS)12 wereusedfor theconstruction ofthe BMI-for-age curves, usingtheRsoftware(RFoundationfor Statistical Comput-ing,version 3.2.2, Vienna,Austria). The LMS methodand wormplotswereusedformodelingthecurves.13,14
The percentiles generated for BMI-for-age were: 5th, 10th,25th,50th,75th,85th,90th,and95th.MeanZ-scores werecalculatedtocomparetheBMI-for-age withthe nor-mative references established by theCDC,15 according to thefollowingequation:Z=[(X/M)L
−1]/L*S,whereXisthe observedmeasurement(BMI)ofeachparticipant,Misthe median, L is the skewness, −1 is the constant, and S is thecoefficientofvariation.ThevaluesofL,M,andSwere obtainedfromCDC/2000normativecharts.
Results
Participants
Thesampleconsistedof706individualswithDSaged2---18 yearsbornbetween 1978and 2012(56.7% males).Atotal of1,986BMIdatapointswereusedtoconstructthecharts. Preterminfantswere10.1%(<37weeksgestation).Atotal of17.9%hadcongenitalheartdisease,13.1%hadundergone cardiacsurgery,and22%hadhypothyroidism(allcontrolled throughlaboratorytests).Missingdataforgestationalage, heartdisease,andhypothyroidismwere57.9%,31.3%,and 27.2%,respectively.
BMIcharts
ThereferencechartsofBMI-for-ageforboysandgirlswith DSaged2---18yearsshowedexcellentgoodnessoffit statis-tics. Mostsubjects showedmore than a singledata point (82%).The numberof data points, means, standard devi-ations,LMS,andpercentiles forage andsexareshown in
42
40 Down syndrome (BMI)Boys: 2 to 18 years
95th
90th
85th
75th
50th
25th
10th
5th
38
36
34
32
30
28
26
24
22
20
18
16
14
12
2 3 4 5 6 7 8 9 10
Age (Years)
BMI (kg/m
2)
11 12 13 14 15 16 17 18
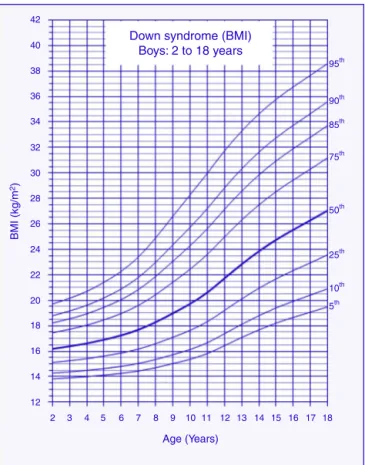
Figure1 Bodymassindex(BMI)curvesformalechildrenand adolescentswithDownsyndromeaged2---18years.
Tables1and2.BMI-for-agechartsofboysandgirlswithDS canbeseen inFigs.1 and2.At2yearsof age,themean BMIZ-scoreofchildrenwithDSwaslowercomparedtothe normative valuesofthe CDC(Z-score=−0.2).Incontrast, meanBMIZ-scoresofchildrenandadolescentswithDSwere higheratages3---18years(Z-scores=+0.2to+1.3).
Discussion
ThisstudydepictsthefirstBrazilianBMI-for-age chartsfor children and adolescents with DS aged 2---18 years. The studyalsofounddifferencesinBMIamongthechildrenand adolescentswithDSenrolledin thepresentstudy andthe normativevaluesestablishedbytheCDC.Theresultshave clinicalandpracticalimplicationsregardingthemonitoring ofthenutritionalstatusofchildrenandadolescentswithDS inBrazil.
Table1 Bodymassindex(BMI)valuesofmalechildrenandadolescentswithDownsyndromeaged2---18years.
Age n Mean SD L M S Percentiles(BMI,kg/m2)---males
5% 10% 25% 50% 75% 85% 90% 95%
2 97 16.39 1.76 −1.2594 16.1884 0.1059 13.83 14.28 15.12 16.19 17.45 18.22 18.79 19.71 3 86 16.60 1.69 −1.2747 16.3847 0.1107 13.91 14.38 15.26 16.38 17.72 18.55 19.16 20.16 4 79 16.63 1.90 −1.2922 16.6125 0.1163 14.00 14.49 15.42 16.61 18.05 18.94 19.60 20.70 5 72 17.47 2.27 −1.3133 16.9091 0.1235 14.12 14.64 15.62 16.91 18.47 19.45 20.19 21.42 6 64 17.53 2.83 −1.3330 17.2500 0.1317 14.26 14.81 15.86 17.25 18.96 20.06 20.89 22.28 7 72 18.11 3.24 −1.3468 17.6922 0.1418 14.44 15.04 16.17 17.69 19.60 20.84 21.79 23.41 8 75 19.28 3.93 −1.3417 18.2846 0.1537 14.71 15.35 16.59 18.28 20.44 21.87 22.99 24.90 9 70 20.35 4.04 −1.3018 18.9805 0.1660 15.03 15.73 17.10 18.98 21.42 23.06 24.35 26.60 10 77 20.57 4.41 −1.2190 19.7185 0.1772 15.37 16.14 17.64 19.72 22.44 24.28 25.72 28.27 11 76 21.13 4.60 −1.0920 20.6106 0.1867 15.81 16.66 18.32 20.61 23.60 25.62 27.20 29.96 12 69 23.15 4.74 −0.9386 21.7209 0.1938 16.44 17.38 19.20 21.72 24.97 27.14 28.82 31.72 13 65 23.27 4.18 −0.7887 22.8300 0.1982 17.08 18.11 20.10 22.83 26.30 28.57 30.31 33.28 14 68 24.63 5.09 −0.6574 23.8454 0.2011 17.68 18.79 20.94 23.85 27.49 29.84 31.63 34.62 15 49 25.75 5.10 −0.5447 24.7468 0.2030 18.21 19.40 21.68 24.75 28.53 30.94 32.76 35.78 16 40 26.14 5.63 −0.4393 25.5368 0.2046 18.66 19.92 22.33 25.54 29.44 31.90 33.74 36.76 17 39 26.53 5.58 −0.3356 26.2865 0.2060 19.07 20.41 22.95 26.29 30.31 32.81 34.66 37.67 18 30 28.00 5.85 −0.2346 27.0475 0.2074 19.48 20.90 23.57 27.05 31.18 33.72 35.59 38.60
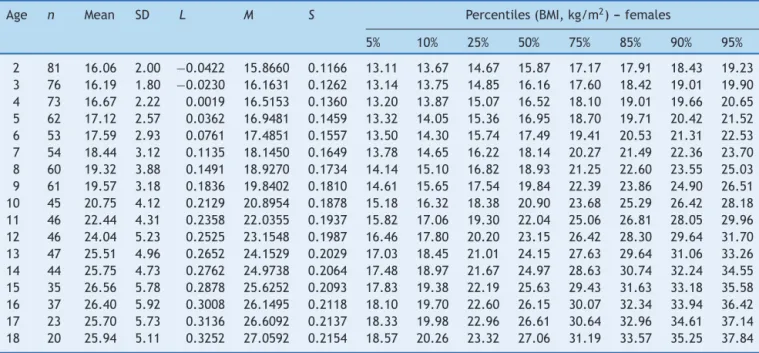
Table2 Bodymassindex(BMI)valuesoffemalechildrenandadolescentswithDownsyndromeaged2---18years.
Age n Mean SD L M S Percentiles(BMI,kg/m2)---females
5% 10% 25% 50% 75% 85% 90% 95%
2 81 16.06 2.00 −0.0422 15.8660 0.1166 13.11 13.67 14.67 15.87 17.17 17.91 18.43 19.23 3 76 16.19 1.80 −0.0230 16.1631 0.1262 13.14 13.75 14.85 16.16 17.60 18.42 19.01 19.90 4 73 16.67 2.22 0.0019 16.5153 0.1360 13.20 13.87 15.07 16.52 18.10 19.01 19.66 20.65 5 62 17.12 2.57 0.0362 16.9481 0.1459 13.32 14.05 15.36 16.95 18.70 19.71 20.42 21.52 6 53 17.59 2.93 0.0761 17.4851 0.1557 13.50 14.30 15.74 17.49 19.41 20.53 21.31 22.53 7 54 18.44 3.12 0.1135 18.1450 0.1649 13.78 14.65 16.22 18.14 20.27 21.49 22.36 23.70 8 60 19.32 3.88 0.1491 18.9270 0.1734 14.14 15.10 16.82 18.93 21.25 22.60 23.55 25.03 9 61 19.57 3.18 0.1836 19.8402 0.1810 14.61 15.65 17.54 19.84 22.39 23.86 24.90 26.51 10 45 20.75 4.12 0.2129 20.8954 0.1878 15.18 16.32 18.38 20.90 23.68 25.29 26.42 28.18 11 46 22.44 4.31 0.2358 22.0355 0.1937 15.82 17.06 19.30 22.04 25.06 26.81 28.05 29.96 12 46 24.04 5.23 0.2525 23.1548 0.1987 16.46 17.80 20.20 23.15 26.42 28.30 29.64 31.70 13 47 25.51 4.96 0.2652 24.1529 0.2029 17.03 18.45 21.01 24.15 27.63 29.64 31.06 33.26 14 44 25.75 4.73 0.2762 24.9738 0.2064 17.48 18.97 21.67 24.97 28.63 30.74 32.24 34.55 15 35 26.56 5.78 0.2878 25.6252 0.2093 17.83 19.38 22.19 25.63 29.43 31.63 33.18 35.58 16 37 26.40 5.92 0.3008 26.1495 0.2118 18.10 19.70 22.60 26.15 30.07 32.34 33.94 36.42 17 23 25.70 5.73 0.3136 26.6092 0.2137 18.33 19.98 22.96 26.61 30.64 32.96 34.61 37.14 18 20 25.94 5.11 0.3252 27.0592 0.2154 18.57 20.26 23.32 27.06 31.19 33.57 35.25 37.84
of age when comparedtoCDC standards.After that age, childrenwithDSarelikelytohavehigherprevalenceof over-weightandobesitywhencomparedtochildreninthegeneral population without DS.20,21 Risk factors for obesity in DS includeleptinhormonedisorders,decreasedrestingenergy expenditure, unbalanced diet, and low levels of physical activity.22---25
The percentiles of BMI-for-age of children with DS increasedgraduallyintheagerangefrom2to18years;a similarpatternwasobservedintheBMI-for-agepercentiles of U.S. children withDS aged 2---20 years.10 The uninter-ruptedincreasesinBMIobservedinindividualswithDSare notconsistentwiththeBMIstandardsfromthegeneral pop-ulationwithoutDS.Growthinternationalreferencesshowa
rapidaccelerationin medianpercentiles ofBMI-for-age in thefirstyearoflife,followedbyadeclineuntiltheageof 5years,andareaccelerationatlaterages.15,26,27
These BMI-for-age curves are descriptive standards of growthinchildrenandadolescentswithDS.However,these curvesdo not indicatean optimal standard of weight, to whichallchildrenwithDSshouldgrow.Theusethesecurves, however, allows for comparison and monitoring of body weightstatusofindividualswithDSinBrazil.
42
40 Down syndrome (BMI)Girls: 2 to 18 years
95th
90th
85th
75th
50th
25th
10th
5th 38
36
34
32
30
28
26
24
22
20
18
16
14
12
2 3 4 5 6 7 8 9 10
Age (Years)
BMI (kg/m
2)
11 12 13 14 15 16 17 18
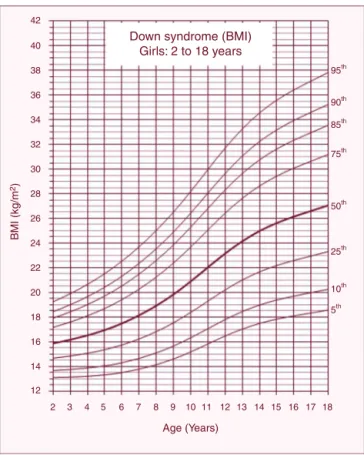
Figure2 Body massindex(BMI) curvesfor femalechildren andadolescentswithDownsyndromeaged2---18years.
BMI-for-agepercentilesamongthepopulationofthisstudy andtheCDChasshowndifferencesfromthepractical stand-point. For example, a male child with DS aged 14 years (BMI:23.85kg/m2,50thpercentile,see Table1)wouldbe
classifiedintheoverweightcategorybytheCDC/BMI param-eters(CDC/BMI:22.66kg/m2,85thpercentile).Theresults suggest that further studies are needed to examine the associationbetween BMIcutoffs andtheoverall health of childrenandadolescentswithDS.
This study has some limitations. First, the data were obtained fromclinical recordsand may include measure-ment errors. However, the data screening was rigorously performed to minimize biases. Second, the sample was restrictedtothestateofSãoPauloanddoesnotrepresent the total population of children with DS in Brazil. Con-versely,thestateofSãoPaulo,withanestimatedpopulation of 44,035,304 individuals (21.7% of Brazil) can represent theeconomicandethnicaldiversityofthecountry.Finally, thecurves donot representthe optimal growthstatus of childrenwithDS,consideringthatsomegrowth-influencing factorswerenotcontrolled,suchasbreastfeeding,lactation support,comorbidities,maternalhealth,andsocioeconomic status. Further studies should investigate the association betweenthesefactorsandthegrowthofchildrenand ado-lescentswithDS.
In conclusion,the Brazilianindividuals withDSshowed different BMI-for-age when compared toCDC references. The curves developed in this study represent the first nationalreferenceofBMI-for-ageforyouthwithDS. There-fore,itisexpectedthatthesecurvescanguideparentsand
professionalsinassessingthenutritionalstatusofchildren andadolescentswithDSinBrazil.
Funding
Coordenac¸ãodeAperfeic¸oamentodePessoaldeNível
Supe-rior (CAPES) and Conselho Nacional de Desenvolvimento
CientíficoeTecnológico(CNPq).
Conflicts
of
interest
Theauthorsdeclarenoconflictsofinterest.
Acknowledgments
The authors received financial supportfrom Coordenac¸ão deAperfeic¸oamentodePessoaldeNívelSuperior(CAPES ---BEX3546/15-2)andfromConselhoNacionalde Desenvolvi-mentoCientíficoeTecnológico(PIBIC---CNPq).Theauthors
would like to thank Roberto A. Soares, João F. Cosmo,
AlessandraC.P.D.Costa,ElianeT.Nogueira,FabioCrozara, CéliadeOliveira,andMariaA.C.Pachecofortheir excel-lent technical assistance. The authors would also like to thanktheAssociac¸õesdePaiseAmigosdosExcepcionaisdo EstadodeSãoPaulo(APAEs/SP), OutpatientClinicof Pedi-atricSpecialtyIntegrationofFaculdadedeCiênciasMédicas,
Universidade Estadual deCampinas (AIEP/FCM/UNICAMP),
DepartmentofMedicalGenetics(DGM/FCM/UNICAMP), Cen-tro de Investigac¸ão em Pediatria (CIPED/FCM/Unicamp), Federac¸ãodasAPAEsdoEstadodeSãoPaulo(FEAPAES/SP), Centro deEducac¸ão Especial Síndrome de Down (CEESD), andFundac¸ãoSíndromedeDown(FSD)fortheirfundamental collaborationinthisstudy.
References
1.DengC,YiL,MuY,ZhuJ,QinY,FanX,etal.Recenttrends inthebirthprevalenceofDownsyndromeinChina:impactof prenataldiagnosisandsubsequentterminations.PrenatDiagn. 2015;35:311---8.
2.ParkerSE,MaiCT,CanfieldMA,RickardR,WangY,MeyerRE, etal.Updatednationalbirthprevalenceestimatesforselected birthdefectsintheUnitedStates,2004---2006.BirthDefectsRes A:ClinMolTeratol.2010;88:1008---16.
3.deGraafG, VisJC,Haveman M,vanHoveG, deGraafEAB, TijssenJGP,etal.Assessmentofprevalence ofpersonswith Downsyndrome:atheorybaseddemographicmodel.JApplRes IntellectDisabil.2011;24:247---62.
4.Presson AP, Partyka G, Jensen KM, Devine OJ, Rasmussen SA, McCabe LL, et al. Current estimate of Down Syn-dromepopulationprevalenceintheUnitedStates.JPediatr. 2013;163:1163---8.
5.Day SM,StraussDJ, Shavelle RM,ReynoldsRJ. Mortalityand causesofdeathinpersonswithDownsyndromeinCalifornia. DevMedChildNeurol.2005;47:171---6.
6.RoizenNJ,MagyarCI,KuschnerES,SulkesSB,DruschelC,van WijngaardenE,et al. Acommunity cross-sectionalsurvey of medicalproblemsin440childrenwithDownsyndromeinNew YorkState.JPediatr.2014;164:871---5.
Comunicac¸ão eEducac¸ão em Saúde).Brasília: Ministério da Saúde;2012,v.1.
8.BullMJ.HealthsupervisionforchildrenwithDownsyndrome. Pediatrics.2011;128:393---406.
9.BertapelliF,MartinJE,GoncalvesEM,deOliveiraBarbetaVJ, Guerra-JuniorG.GrowthcurvesinDownsyndrome:implications forclinicalpractice.AmJMedGenetPartA.2014;164A:844---7. 10.ZemelBS,PipanM,StallingsVA,HallW,SchadtK,Freedman DS,etal.GrowthchartsforchildrenwithDownsyndrome in theUnitedStates.Pediatrics.2015;136:e1204---11.
11.CronkC,CrockerAC,PueschelSM,SheaAM,ZackaiE,PickensG, etal.GrowthchartsforchildrenwithDownsyndrome:1month to18yearsofage.Pediatrics.1988;81:102---10.
12.Stasinopoulos DM, Rigby RA. Generalized additive models for location scale and shape (GAMLSS) in R. J Stat Softw. 2007;23:1---46.
13.van Buuren S, Fredriks M. Worm plot: a simple diagnos-ticdevice for modellinggrowthreference curves. Stat Med. 2001;20:1259---77.
14.ColeTJ,GreenPJ.Smoothingreferencecentilecurves:theLMS methodandpenalizedlikelihood.StatMed.1992;11:1305---19. 15.KuczmarskiRJ,OgdenCL,GuoSS,Grummer-StrawnLM,Flegal
KM,MeiZ,etal.2000CDCGrowthChartsfortheUnitedStates: methodsanddevelopment.VitalHealthStat.2002;11:1---190. 16.MorrisJK,ColeTJ,SpringettAL,DennisJ.Downsyndromebirth
weightinEnglandandWales:implicationsforclinicalpractice. AmJMedGenetPartA.2015;167:3070---5.
17.Weisz B, David AL, Chitty L, Peebles D, Pandya P, Patel P, etal.Associationofisolatedshortfemurinthemid-trimester fetus with perinatal outcome. Ultrasound Obstet Gynecol. 2008;31:512---6.
18.SpenderQ,SteinA,DennisJ,ReillyS,PercyE,CaveD.An explo-rationoffeedingdifficultiesinchildrenwithDownsyndrome. DevMedChildNeurol.1996;38:681---94.
19.Blazek JD, Malik AM, Tischbein M, Arbones ML, Moore CS, RoperRJ. Abnormal mineralization oftheTs65Dn Down syn-dromemouse appendicularskeletonbeginsduringembryonic development in a Dyrk1a-independent manner. Mech Dev. 2015;136:133---42.
20.Van Gameren-Oosterom HB, Van Dommelen P, Schonbeck Y, Oudesluys-MurphyAM,VanWouweJP,BuitendijkSE.Prevalence of overweightin Dutch childrenwithDown syndrome. Pedi-atrics.2012;130:e1520---6.
21.AlexanderM,PetriH,DingY,WandelC,KhwajaO,FoskettN. Morbidityand medicationinalargepopulationofindividuals withDownsyndromecomparedtothegeneralpopulation.Dev MedChildNeurol.2016;58:246---54.
22.MaggeSN,O’NeillKL,ShultsJ,StallingsVA,StettlerN.Leptin levelsamongprepubertal childrenwithDownsyndrome com-paredwiththeirsiblings.JPediatr.2008;152:321---6.
23.HillDL,ParksEP,ZemelBS,ShultsJ,StallingsVA,StettlerN. Restingenergyexpenditureandadiposityaccretionamong chil-drenwithDownsyndrome:a3-yearprospectivestudy.EurJClin Nutr.2013;67:1087---91.
24.O’NeillKL,ShultsJ,StallingsVA,StettlerN.Child-feeding prac-tices in children with down syndrome and their siblings. J Pediatr.2005;146:234---8.
25.PitettiK, BaynardT, AgiovlasitisS.Children andadolescents withDownsyndrome,physicalfitnessandphysicalactivity.J SportHealthSci.2013;2:47---57.
26.deOnisM,OnyangoAW,BorghiE,SiyamA,NishidaC,Siekmann J. Developmentofa WHO growth reference for school-aged childrenand adolescents. BullWorld HealthOrgan. 2007;85: 660---7.