Rev Bras
Cineantropom
Hum
DOI: http://dx.doi.org/10.5007/1980-0037.2016v18n5p548
original article
Diagnostic accuracy of anthropometric
indicators to predict excess body fat in
adolescents aged 11-14 years
Acurácia de indicadores antropométricos de obesidade
para predição do excesso de gordura corporal em
adolescentes de onze a catorze anos
Kethrin Maila Weiss¹ Danielle Biazzi Leal²
Maria Alice Altenburg de Assis2,3 Andreia Pelegrini4
Abstract – he aim of this study was to evaluate the diagnostic accuracy of body mass index (BMI), waist circumference (WC), waist-to-height ratio (WHtR) and conicity index (C index) for the prediction of excess body fat (estimated by skinfold thickness) and determine the cutofs of anthropometric indicators (BMI, WC, WHtR and C index) that best predict excess body fat. Overall, 1,589 students (11-14 years old) from public and private schools of Florianopolis (southern Brazil) participated in this study. Anthropometric measurements of body weight, height, WC, and skinfolds (triceps and medial calf ) were collected. ROC curves were used to compare the discriminatory power of BMI, WC, WHtR and C index in detecting adolescents with excess body fat (relative body fat estimated with skinfold thickness). All anthropometric indicators, except for C index in females, obtained good performance in the detection of excess body fat in both sexes, expressed as the area under the ROC curve. Cutofs for boys and girls, respectively, associated with high excess body fat were BMI (20.7 and 19.7kg/m²), WC (68.7 and 65.9cm), WHtR (0.43 and 0.41cm), and C index (1.13 and 1.11). he study showed that, except for C index in females, BMI, WC and WHtR can be used to identify excess body fat in adolescents, considering the suggested cutofs from this research.
Key words: Adolescents; Adolescent health; Anthropometry; Body composition.
Resumo – O objetivo deste estudo foi veriicar a acurácia diagnóstica do índice de massa corporal (IMC), perímetro da cintura (PerC), razão cintura estatura (RCEst) e índice de conicidade (ÍndiceC) para detectar excesso de gordura corporal (estimada por meio de dobras cutâneas) e determinar os pontos de corte dos indicadores antropométricos (IMC, PerC, RCEst e ÍndiceC) que melhor predizem o excesso de gordura corporal. Participaram do estudo 1.589 escolares (11-14 anos) da rede de ensino pública e privada de Florianópolis, SC. Foram coletadas massa corporal, estatura, PerC e dobras cutâneas (tríceps e panturrilha medial). As curvas ROC foram utili-zadas para comparar o poder discriminatório do IMC, PerC, RCEst e ÍndiceC na identiicação de adolescentes com excesso de gordura corporal. Todos os indicadores antropométricos, exceto o ÍndiceC para as moças, obtiveram bom desempenho na detecção do excesso de gordura corporal em ambos os sexos. Os pontos de corte para rapazes e moças, respectivamente, associados com a gordura corporal elevada foram IMC de 20,7 e 19,7kg/m², PerC de 68,7 e 65,9cm, RCEst de 0,43 e 0,41cm e ÍndiceC de 1,13 e 1,11. Todos os indicadores antropométricos, exceto o ÍndiceC para o sexo feminino, podem ser empregados em adolescentes, a partir dos pontos de corte sugeridos
1 State University of Santa Catarina. Health and Sport Science Center. Florianópolis, SC. Brazil.
2 Federal University of Santa Catari-na. Sports Center. Graduate Program in Physical Education. Florianópolis, SC. Brazil
3 Federal University of Santa Catari-na. Health Sciences Center. Graduate Program in Nutrition. Florianópolis, SC. Brazil
4 State University of Santa Catarina. Health and Sport Science Cen-ter. Graduate Program in Human Movement Sciences. Florianópolis, SC. Brazil
Obesity, considered a worldwide public health problem, has reached in-creasingly higher proportions in individuals of all age groups and both sexes, regardless of socioeconomic status1. Estimates for Latin America indicate that 3.8 million children under ive years, 22.2 to 25.9 million school children, and 16.5 to 21.1 million adolescents are overweight or obese2.
hese values are worrying due to the greater predisposition of obese children and adolescents for the development of cardiovascular and pulmo-nary diseases, diabetes mellitus, biliary problems and some cancers3. In this sense, screening overweight in childhood and adolescence has been widely recommended, since this problem tends to remain during adulthood4-6.
In reference curves for Brazil6 and the International Obesity Task Force (IOTF)7, cutofs for body mass index (BMI) in adolescents vary according to sex and age. In national references6, cutofs for overweight in boys and girls aged 11-14 years range from 19.68 kg / m² to 22.00 kg / m² and 19.51 kg / m² to 23.28 kg / m², respectively. Cutofs for obesity range from 25.58 kg / m² to 27.74 kg / m² in boys and from 23.54 kg / m² to 28.04 kg / m² in girls6. International reference7 that uses data from six countries (including Brazil) presents cutofs for overweight for age group from 11 to 14 years ranging from 20.55 kg / m² to 22.96 kg / m² for boys and from 20.74 kg / m² to 23.66 kg / m² for girls. Cutofs for obesity range from 25.10 kg / m² to 27.98 kg / m² for males and from 25.42 kg / m² to 28.87 kg / m² for females7. Early diagnosis of overweight and obesity is important so that preventive measures can be adopted. For this, there are diferent methods that can be used to assess body composition such as indirect (hydrostatic weighing, dual energy X-ray absorptiometry (DXA), plethysmography, MRI) and doubly indirect measurements (anthropometry and bioelectri-cal impedance). However, indirect methods have high costs and require trained technical staf for the assessment of measures8, while doubly indi-rect techniques, such as anthropometry, have been considered one of the simplest, fast, low cost forms and can be applied in population studies8.
In this context, diferent anthropometric indicators have been used as indirect measure in the identiication of adolescents with overweight, high blood pressure and abnormal serum lipemia9-12, which can be considered an important strategy for screening in the school environment because these methods are simple, fast, also allowing referral to a more careful clinical evaluation. Among these indicators, BMI is the most widely used because it is a simple, non-invasive, inexpensive method and has shown good agreement with adiposity indicators8. However, for being a measure that identiies total body volume, BMI has some limitations, mainly for expressing the sum of all body weight components (lean body mass, bone mass and fat mass), without distinguishing components6.
anthro-Accuracy of anthropometric indicators for obesity Weiss et al.
pometric indicators in predicting excess body fat have been conducted in students of diferent age groups (children and adolescents)11,13 from difer-ent regions of the state of Santa Catarina11 from public schools11 and have used BMI, WC and WHtR as anthropometric indicators13. In this sense, this study advances in research including adolescent schoolchildren (11-14 years) from public and private schools.
Despite the large number of studies on the prevalence of overweight in children and adolescents, there is still controversy about the anthropo-metric indicator that best predicts excess body fat. hus, this study aims to determine the diagnostic accuracy of BMI, WC, WHtR and C index to detect excess body fat (estimated by skinfolds) and determine the cutofs of anthropometric indicators (BMI, WC, WHtR and C index) that best pre-dict excess body fat in schoolchildren from Florianópolis, Santa Catarina.
METHODOLOGICAL PROCEDURES
his is a school-based cross-sectional study carried out in Florianópolis from April to October 2007. Participating schools were selected in a ran-dom sampling process performed in a previous survey conducted in 2002 on the prevalence of overweight and obesity in Florianópolis14. In the 2007 survey, the same schools as in the previous investigation were included because the aim was to assess the trend in the prevalence of overweight / obesity and the body composition evolution of schoolchildren from the comparison of data obtained in 2002 and 2007.
In this study, the sample was composed of two groups of students: 1) those who, in the 2002 survey, aged 7-10 years and in 2007 aged 11-14 years; 2) students aged 11-14 years randomly selected in 2007, with equal probability in each of the schools. he inclusion of the irst group intended to carry out follow-up of students who participated in the study in 200214. he census performed by the Municipal Department of Education located 1,100 adolescents belonging to the irst group. All were invited to partici-pate in the study; however, only 735 students provided data for the 2007 survey. he sample size of the second group was calculated considering a school population of 28,060 students aged 11-14 years, prevalence of excess weight of 12.6%15, margin of error of three percentage points and design efect of 1.5. his calculation totaled 700 adolescents. With margins of error for tests losses, the inal sample was composed of 800 adolescents.
he sampling procedure resulted in the participation of 865 new ado-lescents for the year 2007, and 735 adoado-lescents who already participated in 2002. Eleven participants were excluded due to the absence of complete anthropometric data.
All students aged 11-14 years with no physical or intellectual disabilities and present in classroom on the day of data collection were considered eligible.
cal Education with level-2 certiication by the International Society for the Advancement of Kinanthropometry (ISAK). Technical measurement errors were calculated in order to minimize the possibility of evaluation errors. Intra-class (intra-observer) and inter-class (between observers) cor-relation coeicients were> 0.95 for skinfolds, values considered acceptable for beginners and intermediate-level anthropometrists17.
Anthropometric measurements were performed with barefoot adoles-cents wearing light clothes. Body mass was obtained with the use of elec-tronic scale (MARTE®, model P) with capacity of 180 kg and resolution of 100 grams. Height was measured with a portable stadiometer ixed to the wall (AlturaExata®) with zero point at ground level and resolution of 0.5 cm.
BMI was calculated using the ratio between body weight (kg) and squared height (in meters). WC was measured at the midpoint between the last rib and the upper edge of the iliac crest (natural waist), with an inelastic tape. his measurement was performed in duplicate and in the case of diference by more than 5%, a third measurement was performed. WHtR was determined by the ratio between waist circumference (cm) and height (cm). he C index was determined using body mass, height and waist circumference according to the equation of Valdez18: C index = waist circumference (m) / (0.109) * (√body mass (kg) / height (m)).
Skinfold thickness (triceps and medial calf) were carried out with scientiic skinfold caliper (Cescorf®) with resolution of 0.1 mm on the right side of the body. Measurements were performed in duplicate, and a third measurement was taken when skinfolds difer more than 1 mm. he average of readings at each location and the nearest two readings were used for analysis.
Body fat was assessed by relative body fat (% BF)19 for boys and girls using the sum of skinfold of triceps (TR) and medial calf (MC). Cutofs used for excess body fat classiication were recommended by Lohman16 according to sex and age. % BF above 20% for boys and 25% for girls was considered high16.
Accuracy of anthropometric indicators for obesity Weiss et al.
speciicity with respective 95% CI were calculated. he signiicance level for all analyses was p <0.05. Statistical analyses were performed using the SPSS version 20.0 and MedCalc version 13.1.
he study was approved by the Ethics Committee for Research with Human Beings of the Federal University of Santa Catarina (Protocol No. 028/2006), and followed requirements and procedures of Resolution No. 466/12 of the National Council of Health, which regulates research involv-ing humans20. All participants agreed to participate in the study and their parents or guardians signed the Informed Consent Form.
RESULTS
Overall, 1,589 children (747 boys and 842 girls) with mean age of 12.9 years were evaluated. Students who refused to participate or for which parents have not provided written consent totaled 289 (148 males and 141 females), but were replaced by students previously indicated for replacement in the sampling process.
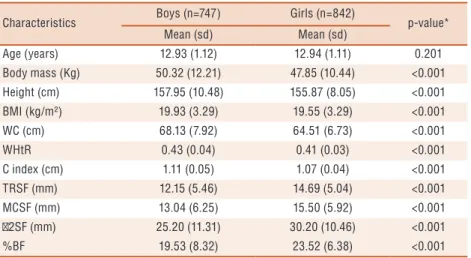
All anthropometric measurements showed signiicant diferences in mean values between boys and girls, which are higher for male adolescents, except for skinfold TR and MC, sum of two skinfolds and % BF (Table 1).
Table 1. Comparison of the main general characteristics of the study population according to sex. Florianopolis, Santa Catarina (2007).
Characteristics Boys (n=747) Girls (n=842) p-value* Mean (sd) Mean (sd)
Age (years) 12.93 (1.12) 12.94 (1.11) 0.201
Body mass (Kg) 50.32 (12.21) 47.85 (10.44) <0.001 Height (cm) 157.95 (10.48) 155.87 (8.05) <0.001 BMI (kg/m²) 19.93 (3.29) 19.55 (3.29) <0.001
WC (cm) 68.13 (7.92) 64.51 (6.73) <0.001
WHtR 0.43 (0.04) 0.41 (0.03) <0.001
C index (cm) 1.11 (0.05) 1.07 (0.04) <0.001 TRSF (mm) 12.15 (5.46) 14.69 (5.04) <0.001 MCSF (mm) 13.04 (6.25) 15.50 (5.92) <0.001 2SF (mm) 25.20 (11.31) 30.20 (10.46) <0.001
%BF 19.53 (8.32) 23.52 (6.38) <0.001
BMI: body mass index; WC: waist circumference; WHtR: waist-to-height ratio; C index: Conicity index; TRSF: triceps skinfold; MCSF: medial calf skinfold; 2SF: sum of TR and MC skinfolds; % BF: relative body fat; * Mann-Whitney U test
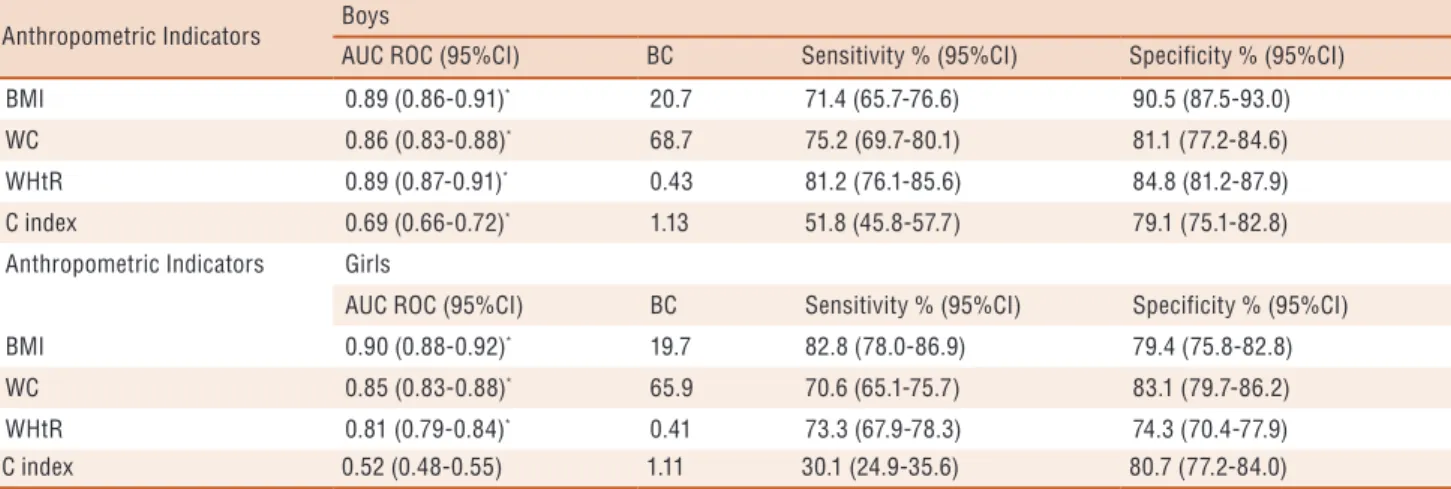
In both sexes, it was possible to observe that all anthropometric indicators showed good performance in the identiication of excess body fat, as indicated by AUC higher than 0.80, except for the C index. However, no signiicant values were observed only for C index of females (p = 0.390) (Table 2).
DISCUSSION
In the present study, all anthropometric indicators have obtained good results to diagnose high body fat, except for C index in girls. hese results showed that excess body fat can be measured either by BMI, character-ized as a general indicator of obesity, as by WHtR, WC and C Index (for males), the central obesity indicators.
hese results corroborate the indings of Pelegrini et al.11, who investi-gated adolescents aged 15-17 years of Florianópolis / SC and concluded that of the four anthropometric indicators (BMI, WC, WHtR and C Index), the irst three had the highest AUC in relation to high body fat in both sexes. On the other hand, a study conducted in children aged 7-10 years in the same city using the sum of four skinfolds found that BMI had better diagnostic performance in screening excess body fat than WC or WHtR, although the three anthropometric indicators (BMI, WC or WHtR) showed signiicant AUC values 13. Such comparisons should be made with caution, especially for diferent age groups analyzed in each study.
Anthropometric Indicators
AUC ROC (95%CI) BC Sensitivity % (95%CI) Specificity % (95%CI)
BMI 0.89 (0.86-0.91)* 20.7 71.4 (65.7-76.6) 90.5 (87.5-93.0)
WC 0.86 (0.83-0.88)* 68.7 75.2 (69.7-80.1) 81.1 (77.2-84.6)
WHtR 0.89 (0.87-0.91)* 0.43 81.2 (76.1-85.6) 84.8 (81.2-87.9)
C index 0.69 (0.66-0.72)* 1.13 51.8 (45.8-57.7) 79.1 (75.1-82.8)
Anthropometric Indicators Girls
AUC ROC (95%CI) BC Sensitivity % (95%CI) Specificity % (95%CI)
BMI 0.90 (0.88-0.92)* 19.7 82.8 (78.0-86.9) 79.4 (75.8-82.8)
WC 0.85 (0.83-0.88)* 65.9 70.6 (65.1-75.7) 83.1 (79.7-86.2)
WHtR 0.81 (0.79-0.84)* 0.41 73.3 (67.9-78.3) 74.3 (70.4-77.9)
C index 0.52 (0.48-0.55) 1.11 30.1 (24.9-35.6) 80.7 (77.2-84.0)
AUC: area under the curve; BMI: body mass index; WC: waist-to-height ratio; C index: Conicity index; BC: best cutoff; * P <0.05 (area under the ROC curve).
Accuracy of anthropometric indicators for obesity Weiss et al.
Regarding international studies, a study conducted with American children and adolescents (5-18 years), participating in he National Health and Nutrition Examination Survey (NHANES: 1999-2004), also found that BMI and % BF derived from skinfolds showed reasonable agreement in adiposity classiication21. Neovius et al.22 conducted a study with Swed-ish adolescents aged 17 in 2005 using plethysmography (indirect method of assessing body composition) as the gold standard and found that BMI and WC are good obesity indicators in adolescence. In Iranian adolescents aged 10-18 in 200723, the analysis of the accuracy of BMI, WC, WHtR and the sum of four skinfolds (triceps, biceps, subscapular and supra-iliac) as predictors of % BF (estimated by bioimpedance) showed that BMI was better than other anthropometric indicators in predicting % BF and diagnosing excess adiposity. In Turkish adolescents aged 10-15 years, a study investigated BMI, WC and waist-to-hip ratio in screening obesity estimated by % BF by skinfolds, BMI and WC were considered the most important indicators to predict high % BF 24.
he indings of this study indicate that the best cutofs for detecting excess body fat (based on the sum of two skinfolds) were for BMI 20.7 kg / m² for boys and 19.7 kg / m² for girls. herefore, the values in this sample are within cutofs suggested by national6 and international7 references for overweight classiication except for females for the IOTF reference7. he cutofs for obesity according to these references are greater than those of the present study. However, the proposed cutofs are indicating that even below values proposed by Conde and Monteiro6 and IOTF7, adolescents already have excess body fat.
For WHtR, it was observed that the best cutof to detect excess body fat was 0.43 cm and 0.41 cm for males and females, respectively. hese cutofs corroborate those found in adolescents aged 15-17 years living in Florianópolis (SC) and in midwestern state of Santa Catarina (0.43 cm for boys and 0.41 cm for girls)11. It is noteworthy that such cutofs are below those internationally recommended to detect abdominal obesity in both sexes and at all ages (0.50 cm)25. However, a recent study in children aged 7-10 years of Florianópolis (SC)13 also showed lower values (0.46 for boys and 0.45-0.43 for girls) compared to this proposal.
It was observed that the C Index proved to be a good predictor of high body fat only for boys, indicating a cutof of 1.13. In Florianópolis (SC) and midwestern state of Santa Catarina, it was observed that for the diagnosis of excess body fat, cutofs for C Index were 1.12 for boys and 1.06 for girls11. hese data, especially for boys, may be justiied because boys tend to have more central body fat distribution compared to girls, whose largest fat tissue deposit occurs in the regions of thighs and hips.
Among the strengths of this study, the representative sample of ado-lescents of Florianópolis, SC stands out. One limitation was the fact of not using an indirect method considered “gold standard” for analysis of body composition. he use of this type of method impairs its use in population studies due to the high cost. However, skinfold measurements have been used in other diagnostic performance studies as a reference measure11,24.
Despite the cross-sectional design of the study, which does not allow identifying causality among variables, it is emphasized that in diagnostic accuracy studies, as is the case of this study, the study design does not seem to inluence the results, because variables are collected at the same time.
CONCLUSION
his study showed that all analyzed anthropometric indicators can be used to detect high body fat in this population, except for C Index for women. hus, these indings support the use of anthropometric indicators as a non-invasive, low-cost and easy-to-apply assessment for use in the nutritional monitoring of adolescents.
REFERENCES
1. WHO (World Health Organization). Prioritizing areas for action in the ield of
population-based prevention of childhood obesity. World Health Organ 2012.
2. Riveira JÁ, Cossio TG, Pedraza LS, Aburto TC, Sánchez TG, Martorell R.
Childhood and adolescent overweight and obesity in Latin America: a systematic review. Lancet Diabetes Endocrinol 2014;2(4):321-32.
3. WHO (World Health Organization). Report on modelling adulthood obesity
across the WHO European Region, prepared by consultants (led by T. Marsh and colleagues) for the WHO Regional Oice for Europe in 2013. Nutrition, Physical Activity and Obesity. Portugal, 2013.
4. Chung ST, Hong B, Patterson L, Petit CJ, Ham JN. High Overweight and
Obe-sity in Fontan Patients: A 20-Year History. Pediatr Cardiol 2016;37(1):192-200.
5. Llewellyn A, Simmonds M, Owen CG, Woolacott N. Childhood obesity as a
predictor of morbidity in adulthood: a systematic review and meta-analysis. Obes Rev 2016;17(1):56-67.
6. Conde WL, Monteiro CA. Body mass index cutof points for evaluation of
nu-tritional status in Brazilian children and adolescents. J Ped 2006;82(4):266-72.
7. Cole TJ, Bellizzi MC, Flegal KM, Dietz WH. Establishing a standard
deini-tion for child overweight and obesity worldwide: internadeini-tional survey. BMJ 2000;320(7244):1-6.
8. Rezende F, Rosado L, Franceschinni S, Rosado G, Ribeiro R, Marins JCB.
Revisão crítica dos métodos disponíveis para avaliar a composição corporal em grandes estudos populacionais e clínicos. Arch Latinoam Nutr 2007;57(4):327-34.
9. Beck CC, Lopes AS, Pitanga FJG. Indicadores antropométricos de sobrepeso
e obesidade como preditores de alterações lipídicas em adolescentes. Rev Paul Pediatr 2011;29(1):46-53.
10. Savva SC, Tornaristis M, Savva ME, Kourides Y, Panagi A, Silikiotou N, et
Accuracy of anthropometric indicators for obesity Weiss et al.
CORRESPONDING AUTHOR
Andreia Pelegrini
Centro de Ciências da Saúde e do Esporte - CEFID
Rua Pascoal Simone, 358 - Coqueiros -
CEP: 88080-350 - Florianópolis – SC. Brasil.
E-mail: [email protected]
11. Pelegrini A, Silva DAS, Silva JMFL, Grigollo L, Petroski EL. Indicadores
antro-pométricos de obesidade na predição de gordura corporal elevada em adolescentes. Rev Paul Pediatr 2015;33(1):56-62
12. Giugliano R, Melo ALP. Diagnóstico de sobrepeso e obesidade em escolares:
utilização do índice de massa corporal segundo padrão internacional. J Ped 2004;80(2):129-34.
13. Ribeiro EAG, Leal DB, Assis MAA. Acurácia diagnóstica de índices
antropomé-tricos na predição do excesso de gordura corporal em crianças de sete a dez anos. Rev Bras Epidemiol 2014;17(1):243-54.
14. Assis MA, Rolland-Cachera MF, Grosseman S, Vasconcelos FA, Luna ME,
Calvo MC, et al. Obesity, overweight and thinness in schoolchildren of the city of Florianopolis, Southern Brazil. Eur J Clin Nutr 2005;59(9):1015-21.
15. Wang Y, Monteiro C, Popkin BM. Trends of obesity and underweight in older
children and adolescents in the United States, Brazil, China, and Russia. Am J Clin Nutr 2002;75(6):971-7.
16. Lohman TG, Roche AF, Martorell, R. Anthropometric standardization reference
manual. Champaign: Human Kinetics, 1988.
17. Frainer DE, Adami F, Vasconcelos FA, Assis MA, Calvo MC, Kerpel R.
Stand-ardization and reliability of anthropometric measurements for population surveys. Arch Latinoam Nutr 2007;57(4):335-42.
18. Valdez R. A simple model based index of abdominal adiposity. J Clin Epidemiol
1991;44(9):955-6.
19. Slaughter MH, Lohman TG, Bouileau RA, Horswil CA, Stillman RJ, Van Loan
MD, et al. Skinfold equations for estimation of body fatness in children and youth. Hum Biol 1988;60(5):709-23.
20. Brasil. Conselho Nacional de Saúde (CNS). Resolução nº 466 de 12 de Dezembro
de 2012. Diário Oicial da União, 13 jun, 2013. Disponível em: http://pesquisa. in.gov.br/imprensa/jsp/visualiza/index.jsp?jornal=1&pagina=59&data=13/06/2013 [2015 nov 21].
21. Laurson KR, Eisemann JC, Welk GJ. Body Mass Index standards based on
agree-ment with health-related body fat. Am J Prev Med 2011;42(4 Suppl 2):S100-S105.
22. Neovius M, Linné Y, Rossner S. BMI, waist-circumference and waist-hip-ratio as
diagnostic tests for fatness in adolescents. Int J Obes 2005;29(2):163-9.
23. Ejtahed HS, Asghari G, Mirmiran P, Hosseinpour-Niazi S,
Sherafat-KazemZa-deh R, Azizi F. Body mass index as a measure of percentage body fat predic-tion and excess adiposity diagnosis among Iranian adolescents. Arch Iran Med 2014;17(6):400-5.
24. Kavak V, Pilmane M, Kazoka D. Body mass index, waist circumference and
waist-to-hip-ratio in the prediction of obesity in Turkish teenagers. Coll Antropol 2014;38(2):445-51.
25. McCarthy HD, Ashwell M. A study of central fatness using waist-to-height ratios