DOI: http://dx.doi.org/10.5007/1980-0037.2017v19n3p299
Diagnostic property of anthropometric indicators
in the prediction of high body fat estimated by
DXA in hypertensive women
Propriedade diagnóstica dos indicadores antropométricos
na predição do excesso de gordura corporal estimado
por meio do DXA em mulheres hipertensas
Camila Tomicki1
Aline Mendes Gerage1
Raphael Mendes Ritti-Dias2
Diego Augusto Santos Silva1
Tânia Rosane Bertoldo Benedetti1
Abstract – Excess body fat is an important risk factor for the development of arterial hyper-tension. he aim of this study was to verify the diagnostic performance of anthropometric indicators in the prediction of excess body fat estimated by Dual-energy Radiometric Absorptiometry (DXA) in hypertensive women. A cross-sectional study with 71 hyper-tensive women (57.9 ± 10.1 years; 77.8 ± 15.1 kg; 156.8 ± 5.2 cm) was carried out. he anthropometric indicators analyzed were: Body Mass Index (BMI), Waist Circumference (WC), Waist-to-Hip Ratio (WHR), Waist-to-Height Ratio (WHtR) and Conicity Index (C Index). Body fat measured by DXA was used as the reference method. Descriptive statistics and ROC curve were used for data analysis. Comparing the anthropometric indicators with the percentage of total fat estimated by DXA, signiicant diferences were observed in BMI, WC and WHR (P <0.05). In relation to the percentage of trunk fat, a diference was identiied in BMI and WC (P <0.05). Among the anthropometric indica-tors analyzed, BMI (0.83), WC (0.79) and WHtR (0.80)had the largest areas under the ROC curve in relation to excess body fat determined by DXA. he cutof points were conservative in relation to those suggested in literature. Anthropometric indicators BMI (24.72 kg/m²), WC (87.81 cm) and WHtR (0.55) can be adopted in the evaluation of excess body fat in hypertensive women, since they demonstrated to be good predictors when confronted with DXA.
Key words: Anthropometry; Body fat distribution; Sensitivity and speciicity; Women.
Resumo – O excesso de gordura corporal é importante fator de risco para o desenvolvimento e agravamento da hipertensão arterial. Objetivou-se veriicar o desempenho diagnóstico dos indicadores antropométricos na predição de excesso de gordura corporal estimado por meio do absortometria radiológica de dupla energia (DXA) em mulheres hipertensas. Realizou-se estudo transversal com 71 mulheres hipertensas (57,9 ± 10,1 anos; 77,8 ± 15,1 kg; 156,8 ± 5,2 cm). Os indicadores antropométricos analisados foram: Índice de Massa Corporal (IMC), Circunferência da Cintura (CC), Relação Cintura-Quadril (RCQ), Relação Cintura-Estatura (RCEst) e Índice de Conicidade (IC). A gordura corporal mensurada por meio da DXA foi utilizada como método de referência. Utilizou-se estatística descritiva e curva ROC para a análise dos dados. Comparando os indicadores antropométricos com o percentual de gordura total estimado pelo DXA, observou-se diferenças signiicativas no IMC, na CC e na RCEst (P < 0,05). Em relação ao percentual de gordura de tronco, identiicou-se diferença no IMC e na CC (P < 0,05). Dos indicadores antropométricos estudados, o IMC (0,83), a CC (0,79) e a RCEst (0,80) tiveram as maiores áreas sob a curva ROC quando comparados a RCQ (0,50) e ao IC (0,55). Os pontos de corte se mostraram conservadores em relação àqueles sugeridos pela literatura. Os indicadores antropométricos IMC (24,72 kg/m²), CC (87,81 cm) e RCEst (0,55) podem ser adotados na avaliação do excesso de gordura corporal em mulheres hipertensas, uma vez que demonstraram ser bons preditores quando confrontados com DXA.
1 Federal University of Santa Catari-na. Florianópolis, SC. Brazil.
2 Albert Einstein Institute for Tea-ching and Research. São Paulo-SP. Brazil.
Prediction of high body fat in hypertensive women Tomicki et al.
INTRODUCTION
Excess body fat is an important risk factor for the development and progression of several chronic non-communicable diseases, including arterial hypertension1. Increased body fat stimulates the
renin-angiotensin-aldosterone system and sympathetic nerve activity, in addition to a physi-cal compression in kidneys, causing changes in intrarenal hemodynamic behavior and impairments in sodium excretion, which together contribute to increase blood pressure2.
In this context, accurate control of excess body fat becomes important among hypertensive individuals, since disease control and the success of pharmacological or non-pharmacological interventions can be mediated by changes in this variable3. his may be even more relevant in women who are
naturally more prone to accumulation of fat in certain body regions due to hormonal issues4. In addition, the reduction in estrogen production observed
in women with advancing age increases the sympathetic nervous activity and impairs endothelial function, hindering blood hypertension control5.
Dual-energy radiological abortometry (DXA) evaluates the amount and distribution of body fat with high degree of accuracy, objectivity and reproducibility when all the measurement procedures recommended by the manufacturer are adopted6,7. However, it is not always accessible in
mid-dle- and low-income countries. hus, simpler procedures, involving more accessible techniques and measures, with lower operational costs, such as anthropometric indicators8, may be more applicable and, therefore, it is
important to evaluate whether such measures are sensitive and speciic in the prediction of excess body fat when compared to DXA, which has been used as an alternative in the validation of diagnostic methods of ex-cess body fat in population studies based on doubly indirect techniques, such as anthropometric indicators9. In apparently healthy women, Body
Mass Index (BMI) in conjunction with Waist Circumference (WC) and Conicity Index (CI) appear to be the best anthropometric indicators in predicting excess body fat10, but it is still unclear if this method applies to
hypertensive women.
herefore, the aim of this study was to verify the diagnostic perfor-mance of anthropometric indicators [(Body Mass Index (BMI), Waist Circumference (WC), Waist-to-Hip Ratio (WHR), Waist-to-Height Ratio (WHtR) and Conicity Index (C Index)] in the prediction of excess body fat estimated by DXA in hypertensive women.
METHODOLOGICAL PROCEDURES
Recruitment
of Pernambuco, Recife, Brazil, in 2014.
he study was approved by the Committee of Ethics in Research with Human Beings of the Federal University of Santa Catarina under protocol No. 811,266. After being informed about the aims and procedures of the study, all participants signed the free and informed consent form (TCLE) in compliance with Resolution 466/12 of the National Health Council.
Screening
As inclusion criteria, the following requirements were observed: age equal to or greater than 40 years, report of medical diagnosis of blood hyperten-sion (systolic / diastolic blood pressure ≥ 140/90 mmHg) controlled by the use of antihypertensive medication for at least three months prior to the start of the study, not having diabetes and other cardiovascular diseases, physical limitations, and not being regularly enrolled in any physical ac-tivity program.
Demographic and Clinical Data
By means of a face-to-face individual interview, adopting an anamnesis form prepared by the researchers, demographic information (age and in-come) and those related to the use of antihypertensive drugs were collected.
Anthropometric measurements
Body weight (BW) was measured with barefoot participants, dressed in light clothing, using a digital scale (Welmy®, São Paulo, Brazil) with precision of 0.1 kg. Height (HEI) was obtained by means of a stadiometer connected to the scale, with accuracy of 0.1 cm.
WC was measured using an inelastic tape measure (Sanny®, São Paulo, Brazil), with precision of 0.1 cm, at the point of the smallest circumference between thorax and hip. Using the same tape measure, the hip circumfer-ence (Q ) was measured in the widest area of the hips and in the largest protrusion of the buttocks. For all anthropometric measurements, the procedures described by the International Society for the Advancement of Kinanthropometry (ISAK)11 were used.
From BW, HEI, WC and Q scores, BMI (BMI = BW (kg) / HEI2
(m)), WHR [WHR = WC (cm) / Q (cm)], WHtR (WHtR = WC (cm) / HEI (cm)] and CI [CI = WC (m) / 0.109 √ BW (kg) / HEI (m)] were calculated12-16.
In order to classify participants according to anthropometric indica-tors, the cutof points proposed in literature were considered: adequate BMI <25 kg / m2 and inadequate ≥ 25 kg / m2, adequate WC <88 cm
and inadequate ≥ 88 cm13, adequate WHR <0.85 cm and inadequate ≥0.85
cm14, adequate WHtR ≤ 0.50 and inadequate ≤ 0.5015 and adequate CI
Prediction of high body fat in hypertensive women Tomicki et al.
Body Fat Measured through DXA
DXA with full-body scanner (Lunar Prodigy DXA, model NRL 41990, GE® Lunar, Madison, WI) was used to evaluate total body and trunk fat (% FDXA) (criterion method). he participant was asked to lie down on the table in dorsal decubitus position, along a standard longitudinal line, remaining motionless during the measurement. he procedure lasted about ive to 10 minutes for each participant and was performed by the same evaluator, with experience in this type of measurement, who previously calibrated the device according to manufacturer’s recommendations.
Participants were recommended to follow the routine procedures before the evaluation in order not to cause measurement errors: to maintain the diet of the last days, not to smoke, to not drink alcohol in the 24 hours before the test, to maintain the routine medication and not to change the hydration standard17.
We chose to categorize %FDXA by performing distribution into percen-tiles. he inal quartile (75th percentile) was used as the reference value to
classify excess body fat, i.e., women who presented value equal or greater to the 75th percentile (%F
DXA ≥ 47.6) were diagnosed with excess body fat,
and women who presented values below the 25th percentile (%F
DXA <42)
were considered without excess body fat.
Statistical analysis
Variables were expressed as mean, standard deviation, minimum value and maximum value. After categorizing participants according to the cutof points suggested for each one of the anthropometric indicators, the Stu-dent’s t test for independent samples was used to compare the fat percent-age estimated by DXA between groups. Receiver Operator Characteristic Curve (ROC) analysis was performed to calculate the sensitivity and speciicity among anthropometric indicators (BMI, WC, WHR, WHtR, CI) in relation to the criterion measure (%FDXA) and for comparison of the area under the curve, in the identiication of excess body fat, considering a 95% conidence interval. Sensitivity and speciicity values not less than 60% and area under the ROC curve not less than 50% were criteria used for selection of cutof points18. Analyses were performed using the SPSS
software (Statistical Package for Social Sciences) version 22.0.
RESULTS
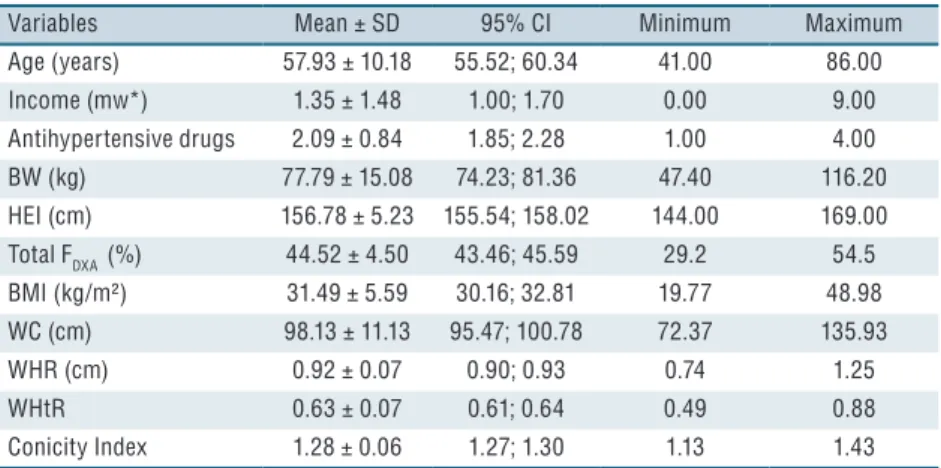
he general characteristics of the sample, composed of 71 hypertensive women, were presented in Table 1.
Table 2 shows the comparison of the total and trunk fat percentage estimated by DXA according to the classiication of participants based on the cutof points proposed for each of the anthropometric indicators (BMI12,
WC13, WHR14, WHtR15, and Conicity Index16). Comparing the total fat
classiied with inadequate BMI and WC presented higher total and trunk fat percentage in comparison to the group with adequate indicators. In addition, the total fat percentage was higher for the group with inadequate WHtR in relation to the group with this indicator within criterion considered adequate.
Table 1. General characteristics, body fat and anthropometric indicators of hypertensive women (n = 71).
Variables Mean ± SD 95% CI Minimum Maximum
Age (years) 57.93 ± 10.18 55.52; 60.34 41.00 86.00 Income (mw*) 1.35 ± 1.48 1.00; 1.70 0.00 9.00 Antihypertensive drugs 2.09 ± 0.84 1.85; 2.28 1.00 4.00 BW (kg) 77.79 ± 15.08 74.23; 81.36 47.40 116.20 HEI (cm) 156.78 ± 5.23 155.54; 158.02 144.00 169.00 Total FDXA (%) 44.52 ± 4.50 43.46; 45.59 29.2 54.5 BMI (kg/m²) 31.49 ± 5.59 30.16; 32.81 19.77 48.98 WC (cm) 98.13 ± 11.13 95.47; 100.78 72.37 135.93
WHR (cm) 0.92 ± 0.07 0.90; 0.93 0.74 1.25
WHtR 0.63 ± 0.07 0.61; 0.64 0.49 0.88
Conicity Index 1.28 ± 0.06 1.27; 1.30 1.13 1.43
SD = standard deviation. 95% CI = confidence interval. mw = minimum wages (R$ 724,00). BW = body weight. HEI= height. %FDXA = relative body fat. BMI = Body Mass Index. WC = Waist Circumference. WHR = Waist-to-Hip Ratio. WHtR = Waist-to-Height Ratio.
Table 2. Total and trunk fat percentage estimated by DXA according to the classification of participants based on cutoff points proposed for the anthropometric indicators (n = 71).
Adequate†
Mean ± SD (95%CI)
Inadequate††
Mean ± SD (95%CI)
P*
Total fat (%)
BMI (kg/m²) 36.35 ± 4.47 (31.65; 41.04)
45.28 ± 3.72
(44.36; 46.20) 0.00
WC (cm) 39.77 ± 5.26
(35.72; 43.81)
45.22 ± 3.98
(44.20; 46.23) 0.00
WHR (cm) 44.99 ± 2.88 (42.58; 47.39)
44.34 ± 4.62
(43.17; 45.52) 0.70
WHtR 32.20 ± 4.24
(-5.92; 70.32)
44.88 ± 4.01
(43.92; 45.84) 0.00
Conicity Index 41.90 ± 7.01 (34.54; 49.25)
44.77 ± 4.20
(43.72; 45.8) 0.13 Trunk fat (%)
BMI (kg/m²) 35.55 ± 6.86 (28.35; 42.74)
45.63 ± 4.18
(44.59; 46.66) 0.00
WC (cm) 39.08 ± 6.65
(33.97; 44.19)
45.61 ± 4.48
(44.47; 46.74) 0.00
WHR (cm) 45.56 ± 3.15 (42.93; 48.19)
44.64 ± 5.48
(43.25; 46.03) 0.64
WHtR 31.05 ± 11.10
(-68.69; 130.79)
45.18 ± 4.54
(44.08; 46.26) 0.32
Conicity Index 39.58 ± 8.98 (30.16; 49.01)
45.26 ± 4.56
(44.13; 46.39) 0.18
Prediction of high body fat in hypertensive women Tomicki et al.
In the analysis of the areas under the ROC curve, it was observed that BMI, WC and WHR were more sensitive and speciic in the identiication of women with excess body fat when compared to the other anthropometric indicators. When the areas under the ROC curves were compared with one another, a statistically signiicant diference (P <0.05) was observed in anthropometric indicators BMI, WC and WHR, respectively (Table 3).
Table 3. Diagnostic properties of anthropometric indicators to detect excess body fat in relation to the criterion measure (%FDXA).
Comparison ROC curve
(CI 95%) Cutoff point † Sensitivity Specificity BMI vs %FDXA 0.83 (0.72-0.93)* 24.72 1.00 0.89 WC vs %FDXA 0.79 (0.68-0.90)* 87.81 1.00 0.83 WHR vs %FDXA 0.50 (0.33-0.66) 0.88 0.80 0.80 WHtRvs %FDXA 0.80 (0.70-0.91)* 0.55 1.00 0.83 CIvs %FDXA 0.55 (0.39-0.71) 1.27 0.60 0.60
95% CI = confidence interval. BMI = Body Mass Index. WC = Waist Circumference. WHR = Waist-to-Hip Ratio. WHtR = Waist-to-height Ratio. CI = Conicity Index. %FDXA = relative body fat. Vs = versus. * Significant ROC curve (P <0.05). † Cutoff points obtained from the ROC curve analysis.
hrough the analysis of the ROC curve, two of the anthropometric indicators are below the reference line (WHR and CI), that is, they are indicators with low discriminatory power for excess body fat estimated by means of DXA (Figure 1).
Figure 1. Area under the ROC curve of anthropometric indicators to predict excess body fat in hypertensive women
DISCUSSION
WC also proved to be good predictors of excess body fat .
In addition, in comparing the fat percentage estimated by DXA accord-ing to groups classiied based on cutof points recommended in literature for each of the anthropometric indicators, it was identiied that, in fact, when classiication was based on BMI12, WC13 and WHtR15, groups (adequate
and inadequate) signiicantly difered for total fat percentage. Regard-ing the trunk fat percentage, there was also a diference between groups when analyzed according to BMI and WC classiication. hese indicators have been accepted as simple measures used to evaluate the amount and distribution of body fat and also as useful indicators to provide important information to predict the presence of blood hypertension19,20.
BMI consists of an anthropometric indicator widely used in the general population to identify obesity and related health risks12, corroborating the
indings of the present study that identiied higher speciicity and sensitivity values, as well as greater area under the ROC curve for this indicator. In the present study, the best cutof point for BMI to diagnose excess body fat was 24.7 kg / m2, close to the cutof point proposed by the World Health Organization12, which is ≥ 25.0 kg / m2.
However, there are controversies about using the same cutof point for adults and older individuals in order to detect excess body fat, since changes in body composition due to the aging process should be considered21,22.
WC is mainly correlated with the distribution of visceral adipose tissue and, therefore, such an anthropometric indicator has been recommended for the speciic evaluation of abdominal obesity23. Recent studies have
highlighted the increase in abdominal obesity in the Brazilian female population24,25. In this study, it was observed that the best cutof point for
predicting excess body fat was 87.8 cm. his inding is in line with the proposal of the United States National Institute of Health26, and by the
World Health Organization13, used in most western countries recommends
for women WC ≥ 88 cm as the best cutof point for identifying health risks. he literature has shown that WHtR is a good discriminator of ab-dominal obesity related to cardiovascular risk factors16. In the present study,
the best cutof point for the detection of excess body fat in women was 0.55, similarly to the recommendation of literature, which suggests values equal to or higher than 0.5 for both sexes16,27. he study by Rodrigues et
al.28 determined cutof points for WHtR in Brazilians and the cutof point
Prediction of high body fat in hypertensive women Tomicki et al.
fat, being an acceptable index of intra-abdominal fat29. he cutof point
for this indicator suggested in this study was 0.88 cm. A study conducted with Brazilian women over 50 years reported the same cutof point29,
dif-fering from the cutof point recommended in literature, 0.8515. In turn,
CI is another anthropometric option that provides information on body fat distribution. A study comparing CI to other anthropometric indica-tors found that it is a good predictor for the identiication of visceral fat30,
which, to a certain extent, contradicts the indings of the present study. In addition, the value of 1.18 is recommended in studies17,29 as the best cutof
point in the prediction of excess body fat; however, in the present study, the cutof point found was 1.27.
he discrepancy among studies may be related to the population in question, since, in the present study, only hypertensive women were analyzed. Gomes et al.10 suggest, for example, that CI is a good indicator
for preliminary diagnosis of health risks in populations not yet diagnosed with any chronic disease.
his study presents some limitations that should be considered in the interpretation of results, for example the sample heterogeneity regarding age and the fact that the sample is not representative, which limits the pos-sibility of extrapolation of results. However, the use of DXA as a reference standard is a strong point of the study. Another point to be emphasized is that other studies involving hypertensive populations have assessed “the power” of anthropometric indicators in predicting cardiovascular risk or blood hypertension, but few have proposed to investigate whether these indicators are, in fact, sensitive in the prediction of overweight.
CONCLUSION
Based on the above results, it was concluded that anthropometric indica-tors BMI, WC and WHtR can be used to diagnose excess body fat in hypertensive women, being thus important measures of the efect of phar-macological and non-pharphar-macological interventions in this population. In addition, due to their high sensitivity and speciicity, simplicity and low operating costs, these methods are more afordable for the monitoring of the health status of hypertensive women.
REFERENCES
1. Gerage AM, Benedetti TR, Farah BQ , Santana F da S, Ohara D, Andersen LB, et al. Sedentary Behavior and Light Physical Activity Are Associated with Brachial and Central Blood Pressure in Hypertensive Patients. PLoS One 2015;10(12):e0146078.
2. Hall ME, Carmo JM do, Silva AA da, Juncos LA, Wang Z, Hall JE. Obesity, hypertension, and chronic kidney disease. Int J Nephrol Renovasc Dis 2014;7:75-88.
3. Sociedade Brasileira de Cardiologia. V Diretrizes Brasileiras de Hipertensão Arte-rial. Arq Bras Cardiol 2007;89(3):e24-79.
Bioelectric impedance spectroscopy underestimates fat-free mass compared to dual energy X-ray absorptiometry in incurable cancer patients. Eur J Clin Nutr 2008;63(6):794–801.
7. Lohman M, Tallroth K, Kettunen JA, Marttinen MT. Reproducibility of dual-energy x-ray absorptiometry total and regional body composition measure-ments using diferent scanning positions and deinitions of regions. Metabolism 2009;58(11):1663-8.
8. Peer N, Steyn K, Lombard C, Gwebushe N, Levitt N. A high burden of hyper-tension in the urban black population of Cape Town: he Cardiovascular Risk in Black South Africans (CRIBSA) Study. PLoS One 2013;8(11):e78567.
9. Rech CR, Ferreira LA, Cordeiro BA, Vasconcelos FAG; Petroski EL. Body composition estimates using dual-energy X-ray Absorptiometry. Rev Bras Cienc Mov 2007;15(4):87-98.
10. Gomes MA, Rech CR, Gomes MBA, Santos DL. Correlação entre índices an-tropométricos e distribuição de gordura corporal em mulheres idosas. Rev Bras Cineantropom Desempenho Hum 2006;8(3):16-22.
11. Stewart, A.; Marfell-Jones, M.; Olds, T.; Ridder, H. International Standards for Anthropometric Assessment. International Society for the Advancement of Kinanthropometry; 2011.
12. World Health Organization. Global status report on noncommunicable diseases 2010: Description of the global burden of NCDs, their risk factors and determi-nants. Geneva: World Health Organization; 2011.
13. World Health Organization. Waist circumference and waist-hip ratio: report of WHO expert consultation. Geneva: World Health Organization; 2011.
14. American Heart Association. hird Report of the National Cholesterol Education Program (NCEP) Expert Panel on Detection, Evaluation, and Treatment of High Blood Cholesterol in Adults (Adult Treatment Panel III) Final Report. Circulation 2002;106(25):3143–421.
15. Hsieh SD, Muto T. he superiority of waist-to-height ratio as an anthropometric index to evaluate clustering of coronary risk factors among non-obese men and women. Prev Med 2005;40(2):216-220.
16. Valdez R. A simple model-based index of abdominal adiposity. J Clin Epidemiol 1991;44(9):955-6.
17. Rech CR, Petroski EL, Silva RCR, Silva JCN. Indicadores antropométricos de ex-cesso de gordura corporal em mulheres. Rev Bras Med Esporte 2006;12(3):119-24.
18. Almeida RT, Almeida MMG, Araujo TM. Obesidade abdominal e risco car-diovascular: desempenho de indicadores antropométricos em mulheres. Arq Bras Cardiol 2009;92(5):375-80.
19. Silva ARA, Dourado KF, Pereira PB, Lima DSC, Fernandes AO, Andrade AM, et al. Razão TG/HDL-c e Indicadores Antropométricos Preditores de Risco para Doença Cardiovascular. Rev Bras Cardiol 2012;25(1):41-9.
20. Jeppesen J, Hein HO, Suadicani P, Gyntelberg F. Triglyceride concentration and ischemic heart disease: an eight-year follow-up in the Copenhagen Male Study. Circulation 1998;97(11):1029-36.
21. Silveira EA, Kac G, Barbosa LS. Prevalência e fatores associados à obesidade em idosos residentes em Pelotas, Rio Grande do Sul, Brasil: classiicação da obesidade segundo dois pontos de corte do índice de massa corporal. Cad Saúde Pública 2009;25(7):1569-77.
22. Lipschitz DA. Screening for nutritional status in the elderly. Prim Care 1994;21(1):55-67.
Prediction of high body fat in hypertensive women Tomicki et al.
308
CORRESPONDING AUTHOR
Camila Tomicki
Rua Deputado Antônio Edu Vieira, 1400, Apto 304, Bloco A, Bairro Pantanal
CEP 88040-001, Florianópolis, Santa Catarina, Brasil. Email: camitomicki@gmail.com
24. Martins IS, Marinho SP. O potencial diagnóstico dos indicadores da obesidade centralizada. Rev Saúde Pública 2003;37(6):760-7.
25. Olinto MTA, Nacul LC, Dias-da-Costa JS, Gigante DP, Menezes AMB, Macedo S. Níveis de intervenção para obesidade abdominal: prevalência e fatores associados. Cad Saúde Pública 2006;22(6):1207-15.
26. National Institutes of Health, National Heart, Lung, and Blood Institute. Clini-cal guidelines on the identiication, evaluation, and treatment of overweight and obesity in adults: the evidence report. Obes Res 1998;6(2):S51-S209.
27. Félix-Redondo FJ, Grau M, Baena-Díez JM, Dégano IR, León AC, Guembe MJ, et al. Prevalence of obesity and associated cardiovascular risk: the DARIOS study. BMC Public Health 2013;13(1):542.
28. Rodrigues SL, Baldo MP, Mill JG. Association of waist-stature ratio with hy-pertension and metabolic syndrome: population-based study. Arq Bras Cardiol 2010;95(2):186-91.
29. Pitanga FJG, Lessa I. Indicadores antropométricos de obesidade como instrumento de triagem para risco coronariano elevado em adultos na cidade de Salvador (Bahia). Arq Bras Cardiol 2005;85(1):26-31.