Helisamara Mota Guedes
I, José Carlos Amado Martins
II, Tânia Couto Machado Chianca
IIII Universidade Federal dos Vales do Jequitinhonha e Mucuri, Department of Nursing. Diamantina-MG, Brazil. II Escola Superior de Enfermagem de Coimbra, World Health Organization Collaborating Centre. Coimbra, Portugal. III Universidade Federal de Minas Gerais, School of Nursing, Nursing Graduate Program. Belo Horizonte-MG, Brazil.
Submitted: 19-12-2014 Approved: 06-01-2015
ABSTRACT
Objective: to analyze the predictive value of the Manchester Triage System in relation to clinical outcome of patients. Methods: prospective observational study of 577 patients admitted to the ER and subjected to risk classifi cation. The Therapeutic Intervention Scoring System-28 (TISS-28) was used to measure the severity of patients (primary outcome) and secondary outcomes: high / transfer, death, and length of hospital stay. Descriptive and univariate analyzes were conducted. Results: patients classifi ed as red are 10.7 times more likely to have scores above 14 in TISS-28 in relation to others. Patients classifi ed as red have 5.9 times more chance of progression to death compared to others. Patients of high priority service are 1.5 times more likely to be hospitalized over fi ve days than low priority. Conclusion: STM proved a good predictor of clinical outcomes. Key words: Nursing; Emergency Medical Services; Triage; Clinical Evolution.
Predictive value of the Manchester Triage System:
evaluation of patients’ clinical outcomes
Helisamara Mota Guedes E-mail: [email protected]
CORRESPONDING AUTHOR
was conducted in the emergency department (ED) of the
San-ta Casa de Caridade of Diamantina - MG, reference to the
extended health region of Jequitinhonha hospital medical as-sistance of medium and high complexity, becoming the main city’s gateway to the urgent care clinics, besides being refer-ence for other ED units in the region.
The study was approved by the Research Ethics Committee at the UFMG under the protocol CAAE - 0430.0.203.000-11.
The study population consisted of all patients who were admitted to Diamantina ED and remained in hospital for more than 24 hours.
For sample size calculation, we used 95% confidence level, maximum error of 5% and a rate of interest of 47%(10),
reaching a sample of 370 patients. We added 20% to this val-ue, totaling 444 participants, due to possible losses.
The study included patients admitted to the ER who went through the coding process and had medical charts with the identification of the nurse professional who performed the service, the description of the evaluation and the level of risk classification assigned.
Patients referred to another hospital and discharged or who died before 24 hours of data collection were excluded. We also excluded those under 18 years old.
Data collection began on May 19th and ended on
Septem-ber 20th, 2012, a total sample of 577 patients.
For data collection a semi-structured questionnaire with in-formation regarding the MTS was used. To measure the sever-ity of patients (primary outcome) the Therapeutic Intervention Scoring System - 28 (TISS-28) was used. The TISS-28 is applied retrospectively in order to use the information obtained in the last 24 hours of the patient’s length of stay in the service. Dur-ing the study, an instrument that had been built to assess the severity of patients in ED was not identified in the literature. We chose to use the TISS-28 because this is a translated and validated instrument in Brazil(11) used by other studies that
used patients classification in other hospital departments(7).
Data from clinical outcome (discharge/referral and death) and hospital length of stay (secondary outcome) were ob-tained through search in the information system of the Hospi-tal Management System, SPDATA.
It was considered as exposure variable the classification from MTS to the user in the admission, and the coding consid-ered by the colors red, orange, yellow, green, blue and white. In the analyzes, the term “high priority” was used for the col-ors red and orange and “low priority” for yellow, green and blue(3-4). In this study, only one person was classified in blue.
We decided to keep this classification for analysis and add white color.
Data were entered and statistically analyzed using the Statis-tical Package for Social Sciences (SPSS), version 17.0. Double data entry was performed. To analyze the characteristics of patients, descriptive statistics and inferential analysis frequen-cies were used. The association between qualitative variables was performed using the chi-square test. The relationship be-tween the average points of TISS-28 and the length of hospital stay in each classification group was verified by Kruskal-Wallis test. The significance level adopted was p ≤0.05. Thereafter INTRODUCTION
Triages carried out in emergency services without the use of protocols were made intuitively until recently and without using a specific methodology. Thus, they were not replicable to other health professionals and did not serve as a parameter for audits(1).
From 2008, in order to standardize emergency care in the State of Minas Gerais, the state government has standardized the implementation of risk classification using the Manchester Triage System (MTS) in all state emergency units(2). Since then,
public hospitals of Minas Gerais have sought to develop strat-egies for the implementation of this risk assessment tool for users seeking emergency care in public institutions.
MTS was developed in the city of Manchester, England, in 1994 by a group of professionals specialized in triage. After iden-tifying the main complaint of the user by the nurse, they devel-oped a specific flowchart driven by discriminators which are pre-sented as questions(3-4). MTS presents 52 different flowcharts and
a risk scale. This scale has five categories identified by number, name, color, and target time to the initial medical evaluation. According to the protocol, the individual can be coded in five colors: red (immediate care); orange (very urgent care); yellow (urgent care); green (standard care) and blue (non-urgent care)(4-6).
MTS includes severity criteria in an objective and systemat-ic manner; it defines the clinsystemat-ical priority and the recommend-ed time of patient care, from entering the unit until mrecommend-edical attention. This does not indicate medical diagnosis, but the identification of the main complaint(1).
In Brazil, some questions emerged after the implementation of MTS at the front doors of the emergency services, such as the decision to use this protocol without instrument validation, which can cause serious problems in the use of non-validated instruments that are not culturally adapted to our reality(7-8).
Added to this fact, some Brazilian hospitals have manual system for recording information. This system has flaws in measure, which allows duplication of efforts such as admis-sion of patients by two different ordinances, loss of registra-tion instrument or delay in locaregistra-tion, illegible handwriting, incomplete data, hindering the flow of information between health professionals.
Studies to evaluate the prediction of risk classification pro-tocols are still scarce in Brazil, which is why a study that vali-dates all MTS priority levels for application in emergency ser-vices with manually registration is important. It is understood as classification predictor “how much it can be supported by the clinical prognostic of the patient, or even how much of the given code to the patient at admission in the service can con-firmed by the prognostic, while in the emergency service”(9).
The objective of this study was to analyze the predictive value of the Manchester Triage System in relation to the clini-cal prognostic of patients of a hospital.
METHODS
Mann-Whitney test was performed. Bonfer-roni’s correction was used (p<0.01). To measure the strength of association between exposure and outcome we calculated the odds ratio (OR), 95% confidence interval and p value. It was considered as exposure variable MTS categories and as outcome the dichotomy of the TISS-28 cutoff point, discharge/referral and death, dichotomy of the cutoff length of hospital stay. For TISS-28 data and length of hospital stay the median was used, which corresponds to percentile 50. To control confounding variables, logis-tic regression was performed.
RESULTS
Out of the 577 patients classified, 242 (41.9%) were female and 335 (58.1%) were male. Minimum age of patients was 18 years old and the maximum 102 years old, mean 58.69 years.
Patients were coded with the colors red (21 - 3.6%), orange (158 to 27.4%), yellow (267-46.3%), green (62-10.7%), blue (1-0.2%), and white (68-11.8%).
Regarding the severity of patients, we found 468 (81.1%) patients coded as class I (physiologically stable patients re-quiring prophylactic observation), 95 (16.5%) in class II (phys-iologically stable patients, but requiring intensive care nursing and continuous monitoring) and 14 (2.4%) in class III (severe and hemodynamically unstable patients). There was statistical significance differences between classes by TISS-28 and the risk classification of the groups (p <0.001). In this study, there were no patients in Class IV of severity.
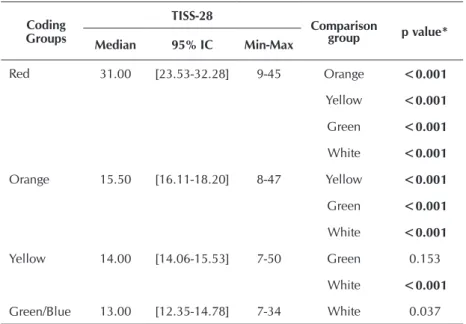
The mean score in TISS-28 found in patients coded as red was 27.90 points, orange 17.15 points, yellow 14.79 points, green 13.56 points and white 12.28 points.
We found significant statistical difference among the groups in relation to the score obtained in the TISS-28 (Table 1). There was no significance at the intersection of patients classified in yellow with green and green with white.
It is observed that patients code as red had higher scores than in other colors. Thus, this category was identified by TISS-28 as most severe from the clinical point of view than the other categories. The same observation can be made regard-ing the category orange to yellow and yellow to green.
The median score of TISS-28 showed the cutoff point 14 being possible to predict that the greater the patient’s clini-cal priority, according to the MTS, the greater the number of points obtained in TISS-28 and, consequently, the more se-vere is the patient.
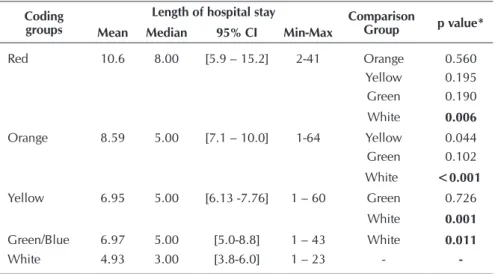
The length of hospital stay is a fact that was used as an outcome measure for the predictive value of the MTS. It was observed that the higher the clinical priority of the patient, the higher is the length of hospital stay. The average length of hos-pital stay decreased in the same order of patients’ complexity:
red, orange, yellow, green. Overall, patients were hospitalized on average for 7.3 days, with a minimum stay of 1 day and maximum of 64 days.
Analysis for multiple comparisons was conducted for hospital stay among all color groups (Table 2) we found a significant dif-ference between patients classified according to risk in red and white, orange and white, yellow and white, green and white
Regarding the secondary outcome discharge/referral or death among patients treated at the hospital, 83.5% were dis-charged. Proportionally there were more deaths among patients who were coded as high priority: 42.8% red, 17.0% orange and 8.9% yellow. In patients coded in green, 9.6% progressed to death, and 7.3% from the white group also had the same out-come. From the referred patients, 79.1% were coded as orange and yellow. A statistical difference between clinical outcome and risk classification groups was found (Table 3).
Univariate analysis showed significant data on primary and secondary outcomes, according to Table 4.
There is statistical difference between the risk classifica-tions of the groups regarding scores above 14 in TISS-28. Pa-tients coded in red have 10.7 times greater chances of having a score above 14 points in TISS-28 than in the other colors. Patients considered as high priority of service have 3.1 times higher chances of having a score above 14 points in TISS-28 than patients who were considered as low priority.
The median of length of hospital stay indicated a cutoff point of 5 days. Univariate analysis showed a statistical difference be-tween the color of risk classification groups orange and the high clinical priority of the length of stay for more than 5 days.
Patients of high priority are 1.5 times more likely to stay in hospital longer than 5 days than the low clinical priority. Table 1 - Statistical analysis by multiple comparisons of TISS-28 categories
in the coding groups, Diamantina, MG, Brazil, 2012
Coding Groups
TISS-28
Comparison
group p value* Median 95% IC Min-Max
Red 31.00 [23.53-32.28] 9-45 Orange <0.001
Yellow <0.001
Green <0.001
White <0.001
Orange 15.50 [16.11-18.20] 8-47 Yellow <0.001
Green <0.001
White <0.001
Yellow 14.00 [14.06-15.53] 7-50 Green 0.153
White <0.001
Green/Blue 13.00 [12.35-14.78] 7-34 White 0.037
Source: Research data.
Note: *P calculated by Mann Whitney test adjusted by Bonferroni for p<0,01. Kuskal Wallis test, p<0,001.
MTS proved to be a good predictor for the length of stay for more than 5 days, because patients with high clini-cal priority have more chances to stay in hospital when compared with low clinical priority patients.
As for the secondary outcome, uni-variate analysis showed a statistical difference between the risk classifica-tion of the groups in regard to death. There was no statically significance only between white and green.
It is possible to predict that the greater the severity of the patient, the greater the chances of progression to death, showing that the MTS can be a good predictor of death.
Patients coded as red have 5.9 times greater chances of progression to death when compared to those coded in
oth-er colors. Patients with high priority of service have 2.5 times greater chances of progression to death than patients classified as low priority.
DISCUSSION
Regarding the characterization of the sample of the present study, most were males 58.1%. This data corroborated a study conducted in the emergency de-partment of the State of Minas Gerais in which they found 57.3% of men(7).
The mean age of patients was 58.6 years, minimum 18 and maximum of 102 years old. Study conducted with patients who remained in the service after 24 hours found a mean age of 57.3 years old(7), near to the present study. Table 2 - Statistical analysis by multiple comparisons of hospital stay between the
risk classification groups, Diamantina, MG, Brazil, 2012
Coding groups
Length of hospital stay Comparison
Group p value* Mean Median 95% CI Min-Max
Red 10.6 8.00 [5.9 – 15.2] 2-41 Orange 0.560
Yellow 0.195 Green 0.190 White 0.006
Orange 8.59 5.00 [7.1 – 10.0] 1-64 Yellow 0.044 Green 0.102 White <0.001
Yellow 6.95 5.00 [6.13 -7.76] 1 – 60 Green 0.726 White 0.001
Green/Blue 6.97 5.00 [5.0-8.8] 1 – 43 White 0.011
White 4.93 3.00 [3.8-6.0] 1 – 23 -
-Source: Research data.
Note: *p calculated by Mann Whitney test adjusted by Bonferroni for p<0,01. Kuskal Wallis test, p=0,038.
Table 3 - Stratification of clinical outcomes between the risk classification groups. Diamantina. MG. Brazil. 2012
Risk Classification
Outcome
Total
p value* Discharge Death Referral
n % n % n % n %
Red 12 2.1 9 1.5 - - 21 3.6
<0.001
Orange 122 21.1 27 4.8 9 1.5 158 27.4
Yellow 233 40.3 24 4.2 10 1.8 267 46.3
Green/Blue 55 9.5 6 1.0 2 0.4 63 10.9
White 60 10.5 5 0.8 3 0.5 68 11.8
All patients 482 83.5 71 12.3 24 4.2 577 100
Source: Research data.
Note: *p calculated through chi-square test. significant if p≤0.05.
Note: Blue and green were grouped together because only one person was discharged.
Table 4 - Univariate analysis for the variables of risk classification, with the outcome scores for TISS-28 >14, length of hos-pital stay >5 days and death, Diamantina, MG, Brazil, 2012
Outcome High Priority Low Priority Red Orange Yellow Green/Blue White
TISS-28 >14
OR 3.160 0.316 10.779 2.778 0.708 0.469 0.341
95% CI 2.148-4.647 0.215-0.466 2.487-46.717 1.894-4.076 0.509-0.984 0.268-0.821 0.193-0.600
p <0.001 <0.001 0.001 <0.001 0.040 0.008 <0.001
Length of hospital stay >5 days
OR 1.504 0.665 1.985 1.457 0.842 0.907 0.614
95% CI 1.041-2.172 0.460-0.960 0.823-4.789 1.007-2.108 0.603-1.176 0.528-1.557 0.356-1.057
p 0.030 0.030 0.127 0.046 0.313 0.723 0.079
Death
OR 2.509 0.399 5.964 1.752 0.551 0.740 0.532
95% CI 1.486-4.237 0.236-0.673 2.416-14.723 1.043-2.943 0.327-0.928 0.307-1.786 0.206-1.370
study considered the total time of the patient when admitted to the ER, until discharge/referral to another hospital or death.
Another indicator used in this study to measure the effective-ness of MTS is prediction of death. Patients coded in red died more than those who were coded in orange and yellow. The same analysis can be made for orange with respect to yellow. In this study, the percentage of people in green who died was slightly higher than yellow, but the univariate analysis showed no statisti-cal association between those coded in green and other colors in regard to death. There was no statistical difference for white.
The presented data have shown that the MTS is a good pre-dictor of death, that is, the higher the severity of the patient the greater the chances of progression to death. Patients coded in red have 6 times more chances to die. Patients classified as high clinical priority are 2.5 times more likely to die while in the low priority patients the chance is of 0.399. The data from this study confirm the findings of another study(9) that patients coded as red
die more than those coded as orange and yellow and have 3.8 times greater chances of dying when compared to orange and 7.1 times higher compared to yellow. It was concluded that the prognostic of patients is different between the categories of MTS and, notably, the patients in the red group are more critically ill.
Death is associated with urgent MTS categories(6). The
predic-tion of Manchester in relapredic-tion to death has also been described in another study, in which the risk of death in patients of higher priority was 5.58 times greater than the risk of death for low priority patients. The study adds that the risk of hospitalization in high priority was 4.86 times greater than the lowest priority(4).
International studies concluded that MTS proved to be a very powerful tool to distinguish the risk of death, need for hospitalization and use of diagnostic tests such as electrocar-diogram and laboratory tests(3-4,15).
The percentage of deaths was small (1.9%) in patients clas-sified as non-urgent (green and white). These deaths may be related to the fact that there is deterioration in patients’ clinical condition during the 24 hours of hospitalization.
The results of this prospective observational study concern-ing the predictive analysis of the MTS in relation to the clinical prognostic of the users of a hospital in Minas Gerais using pre-viously tested and validated instruments which are clinically relevant, similar to those found in national and international studies, being able to state that has external validity for the region of Vale do Jequitinhonha-MG.
A limitation factor of the study was the choice of the mea-surement instrument TISS-28, which selects patients who are in hospital from 24 to 48 hours. The choice of this instrument made difficult to compare with other studies of the area and allowed us to obtain different data, since critical ill patients may die within 24 hours, and less severe patients may already have been discharged.
CONCLUSION
The present study found a majority of male patients (58.1%) with a mean age of 58.6 years old coded as yellow (46.5%).
The study data allow us to conclude that MTS showed to be a good predictor of clinical severity, since after applying The mean age of patients in this study is higher compared
to that found (mean 52.3 years) in patients on care admis-sion(4). This may be related to the fact that younger patients
seeking care with less severe problems are treated and dis-charged in less than 24 hours.
In the same hospital of this research, a study conducted with medical charts of all patients who were admitted to ER, being coded as “red” (7-1.4%), “orange” (46-9.2% ), “yellow” (181-36.2%), “green” (235- 47.0%) and “blue” (from 31 to 6.2%)(12). The data from this study showed that after 24 hours,
this reality change, since the tendency is for patients classi-fied as standard and non-urgent to no longer be in the hospi-tal. Thus, after 24 hours, we found coded as “red” (21-3.6%), “orange” (158-27.4%), “yellow” (267- 46.3%), “green” (65-10.7%), “blue”(1-0.2%), “white”(68-11.6%). This can be justi-fied because it is an hospital inserted in a context in which primary care is not structured to meet the cases of low com-plexity, so 53.2% of classification was standard (green) and non-urgent (blue). After 24 hours, we observed that only peo-ple with higher priority remained in hospital, and therefore there was a prevalence of people rated as yellow and orange.
It can be argued that patients with higher clinical priori-ties (red, orange and yellow) had higher scores on the TISS-28 indicating they were more physiologically compromised and therefore required more health care. The opposite can be said for those classified in green and white.
A statistically significant difference was found between the colors of the risk classification and the score obtained by the TISS-28. The data obtained are similar to one study found that applied TISS-28 in patients classified by the MTS(7), which
vali-dates the claim that the higher the score received in the TISS-28, the highest clinical priority in MTS.
In this study, the mean score of the TISS-28 received by patients coded in the red color was high, compared to studies in ICU hospitalized patients who found an average of 21.0 points(13) and 20.14(14) points in TISS-28. This may be related to
the fact that the hospital where this study was conducted is a reference to the expanded health region and has only 10 ICU beds, prioritizing the most critical patients.
The length of hospital stay was also used in this research as one of the outcomes to measure MTS prediction. Data shows that more severe patients remain hospitalized longer when compared to lower clinical priority patients. Thus, the MTS is a good predictor of length of hospital stay for high clinical pri-ority patients when compared to low clinical pripri-ority patients. There was no statistical significance for the coding of pa-tients in red color and the length of hospital stay greater than five days. This may have happened because of the patients cod-ed as rcod-ed dicod-ed before 5 days, since death is higher in this group. Patients of high priority of service have 1.5 times more chances to stay in hospital longer than 5 days than low clini-cal priority patients. We found only one study that identified no statistical difference between MTS groups, compared with the average length of hospital stay(9). We suggest that further
a severity scale between 24 to 48 hours, there was associa-tion of severity of the risk classificaassocia-tion with those obtained by TISS-28. MTS proved to be a good predictor of length of hospital stay, since patients with high clinical priority remain in hospital longer than the low clinical priority ones. MTS was also a good predictor of discharge/referral and death, since patients classified by the MTS in the categories of clinical se-verity had more chances of death.
The MTS preconization in the State of Minas Gerais is a recent regulation from 2008, to validate its use in emergency
rooms and recommend MTS use as a triage instrument for urgent and emergency units of all Brazilian states. Thus, the standardization of the language used in the risk classification in the country will be possible.
AKNOWLEDGEMENTS
To Fapemig, public notice Demanda Universal (Ref. No. APQ-01153-12) public notice Extension in research interface (Ref. No. APQ-02677-12) by the grant.
REFERENCES
1. Mackway-Jones K, Marsden J, Windle J. Grupo Brasileiro de Classificação de risco. Sistema Manchester de Classifi-cação de Risco. 2. ed. Belo Horizonte (MG): Grupo Brasi-leiro de Classificação de risco; 2010.
2. Grupo Brasileiro de Acolhimento com Classificação de Ris-co. História da Classificação de Risco em Minas Gerais [Inter-net]. 2013 [acesso em 08 de fevereiro de 2013]. Disponível em: http://www.gbacr.com.br/index.php?option=com_con tent&task=view&id=76&Itemid=110
3. Martins HM, Cuña LM, Freitas P. Is Manchester (STM) more than a triage system? A study of its association with mortality and admission to a large Portuguese hospital. Emerg Med J. 2009;26(3):183-6.
4. Santos AP, Freitas P, Martins HM. Manchester triage sys-tem version II and resource utilisation in emergency de-partment. Emerg Med J [Internet]. 2014 [cited 2013 Feb-ruary 08];31(2):148-52. Available from: http://www.ncbi. nlm.nih.gov/pubmed/23345313
5. Storm-Versloot MN, Vermeulen H, Van Lammeren N, Luitse JS, Goslings JC. Influence of the Manchester tri-age system on waiting time, treatment time, length of stay and patient satisfaction; a before and after study. Emerg Med J [Internet]. 2014 [cited 2013 February 08];31(1):13-8. Available from: http://www.ncbi.nlm.nih. gov/pubmed/23302504
6. Van der Wulp I, Schrijvers AJ, van Stel HF. Predicting ad-mission and mortality with the Emergency Severity Index and the Manchester Triage System: a retrospective obser-vational study. Emerg Med J [Internet]. 2009 [cited 2013 February 08];26(7):506-9. Available from: http://www. ncbi.nlm.nih.gov/pubmed/19546272
7. Pinto Júnior D, Salgado PO, Chianca TCM. Predictive va-lidity of the Manchester Triage System: evaluation of out-comes of patients admitted to an emergency department. Rev Latinoam Enferm. 2012;20(6):1041-7.
8. Souza CC, Toledo AD, Tadeu LFR, Chianca MCT. Risk classification in an emergency room: agreement level be-tween a Brazilian Institutional and the Manchester Proto-col. Rev Latinoam Enferm. 2011;19(1):26-33.
9. Pinto Júnior, D. Valor preditivo do protocolo de classifica-ção de risco em unidade de urgência de um hospital mu-nicipal de Belo Horizonte [dissertação]. Belo Horizonte (MG): Universidade Federal de Minas Gerais; 2011.
10. Barbeta PA, Reis MM, Bornia AC. Estatística: para cursos de engenharia e informática. São Paulo (SP): Atlas; 2010.
11. Nunes B. Tradução para o português e validação de um instrumento de medida de gravidade em UTI: TISS - 28 - Terapeutic Intervention Scoring System (dissertação). São Paulo (SP): Universidade Federal de São Paulo; 2000.
12. Guedes HM, Almeida AGP, Ferreira FO, Vieira Júnior G, Chianca TCM. Risk classification: portrait of a population using a Brazilian emergency service. Referência [Internet]. 2014 [cited 2013 February 08];IV(1):37-44. Available from: http://www.scielo.oces.mctes.pt/scielo.php?pid=S0874-02832014000100005&script=sci_arttext&tlng=pt
13. Elias ACGP, Matsuo T, Cardoso LTQ, Grion CMC. Appli-cation of the therapeutic intervention scoring system (TISS 28) at an intensive care unit to evaluate the severity of the patient. Rev Latinoam Enferm. 2006;14(3):324-9.
14. Silva MCM, Sousa RMC. A versão simplificada do Thera-peutic Intervention Scoring System e seu valor prognósti-co. Rev Esc Enferm USP [Internet]. 2004 [acesso em 08 de fevereiro de 2013];38(2):217-24. Disponível em: http:// www.scielo.br/pdf/reeusp/v38n2/13.pdf