Temporal variation in the
prevalence of weight and
obesity excess in adults:
Brazil, 2006 to 2009
Variação temporal na prevalência
do excesso de peso e obesidade em
adultos: Brasil, 2006 a 2009
Denise Petrucci Gigante I
Giovanny Vinícius Araújo de França II
Luciana Monteiro Vasconcelos Sardinha III
Betine Pinto Moehlecke Iser IV
Gustavo Velasquez Meléndez V
I Universidade Federal de Pelotas (UFPel) – Pelotas (RS), Brazil
II Universidade Federal de Pelotas (UFPel) – Pelotas (RS), Brazil
III Secretary of Health Surveillance, Health Ministry – Brasília (DF), Brazil IV Secretary of Health Surveillance, Health Ministry – Brasília (DF), Brazil
V Universidade Federal de Minas Gerais (UFMG) – Belo Horizonte (MG), Brazil
Financial Support: none.
Correspondence to: Denise Petrucci Gigante – Epidemiology Post Graduation Program –
Universidade Federal de Pelotas – Rua Marechal Deodoro, 1.160 – 3rd floor – CEP: 96020-220 –
Pelotas (RS), Brazil – E-mail: [email protected] Conflict of interests: nothing to declare.
Abstract
Overweight and obesity are public health issues that afect an important part of the world population. his study aims at describing the trends in overweight and obesity prevalence rates from 2006 to 2009, by means of telephone surveys in 27 Brazil-ian cities, with a population aged 18 years or older. he body mass index (BMI) was calcu-lated by the reported height and weight; overweight and obesity were considered as BMI ≥25 kg/m2 and ≥30 kg/m2, respective-ly. Temporal variation in overweight and obesity prevalence is presented for men and women, according to age group, school-ing, stable relationship, and skin color. Poisson regression was used for the analy-sis. Overweight prevalence was 43.0, 42.7, 44.2 and 46.6%,for each year of the period from 2006 to 2009, respectively. For obesity, in the same period, the trend was: 11.4, 12.7, 13.2 and 13.8%. he temporal trend varied in relation to some demographic and socio-economic variables. he prevalence was higher among women and young adults. he temporal trend was independent of the relationship status of the interviewees, but the prevalence was higher among white women and those with less years of school-ing. he results in this study conirmed the urgent need for efective prevention and control measures, as the increasing trend is occurring in a short period of time, especial-ly among youngsters.
Introduction
Overweight and obesity are considered as increasing world health problems, especially in the urban areas of countries with middle and low incomes1. According
to estimates from the World Health Organization (WHO), 2.3 billion adults will be overweight and more than 700 million will become obese by 20151.
In Brazil, the prevalence of overweight and obesity in adults has increased since the studies conducted in the 1970s; never-theless, even children and adolescents have presented higher prevalence rates lately2. As
to the relation between childhood and adult obesity3,4, it is quite likely that such public
health issue will become even more serious in the next decades.
Considering the increasing overweight and obesity prevalence rates in the Brazilian population in a period of 34 years, it is observed that such trends have difer-ences as to gender, household region and income. Although both genders presented such increase, it was more prevalent among men of all income levels in the ive regions of Brazilian. Among women, the increasing trend was interrupted from 1989 to 2002-2003 in some regions, and in higher income levels, but the scenario changed from 2008 to 20092.
Since 2006, the Telephone-based
Surveillance of Risk and Protective Factors for Chronic Diseases (VIGITEL) has been annually conducted with the population aged 18 years or more. As national studies to assess nutritional status by means of the collection of anthropometric measure-ments in household interviews with a repre-sentative sample of the Brazilian population cannot be conducted in a short period, the alternative of telephone surveys conducted in the Brazilian capitals enables the analysis of the evolution of overweight and obesity. herefore, it is possible to identify the population groups with a more deined increasing trend. hus, it is also possible to propose immediate preventive and control measures. his paper aims to describe the
Resumo
Excesso de peso e obesidade são proble-mas de saúde pública que atingem parce-la importante da popuparce-lação mundial. Este estudo tem o objetivo de descrever as tendências nas prevalências do excesso de peso e da obesidade, no período de 2006 e 2009, obtidas por meio de entrevistas telefô-nicas em 27 cidades brasileiras com uma população de 18 anos ou mais. O índice de massa corporal (IMC) foi calculado a partir do peso e altura referidos; o excesso de peso e obesidade foram deinidos por
IMC ≥25 kg/m2 e ≥30 kg/m2,
respectiva-mente. A variação temporal das prevalên-cias do excesso e peso e de obesidade é apresentada para homens e mulheres, de acordo com grupo etário, escolaridade, união estável e cor da pele. A regressão de Poisson foi utilizada na análise. As preva-lências do excesso de peso foram 43,0, 42,7, 44,2 e 46,6%, para cada ano do período de 2006 a 2009, respectivamente. Para obesi-dade, no mesmo período, foram encontra-das as seguintes prevalências: 11,4, 12,7, 13,2 e 13,8%. A tendência temporal variou em relação às variáveis demográicas e econômicas. O aumento nas prevalên-cias ocorreu nas mulheres e entre os mais jovens. A tendência temporal foi indepen-dente do estado civil dos entrevistados, mas o aumento nas prevalências ocorreu em mulheres brancas e com menor escola-ridade. Os resultados do presente estudo conirmam a urgência da necessidade de medidas efetivas de prevenção e contro-le, uma vez que a tendência do aumento está ocorrendo em um curto intervalo de tempo, especialmente entre os jovens.
prevalence trends related to overweight and obesity in the period from 2006 to 2009, also assessing these trends considering some characteristics of the interviewees.
Methods
In 2006, VIGITEL was established in the 26 Brazilian state capitals and the Federal District with the objective of monitoring the frequency and distribution of the main factors related to chronic non-communi-cable diseases (CNCD). Since then, it has been conducted annually, and this study presents the evolution of overweight and obesity prevalence rates from 2006 to 2009.
he sampling procedures adopted by VIGITEL are the same for all assessed years and aim to reach representative samples of the adult population living in households with at least one telephone line. In order to estimate the prevalence of risk factors for CNCD, with a 95% conidence level and error of three percentage points, the sample was comprised of 2,000 individuals aged 18 years of more to be interviewed in each city. he irst phase of this process includes the systematic draw of 5,000 telephone lines per city. his draw is carried out from electronic registers provided by telephone companies with broad coverage in each region of the country, from residential phone lines in the capitals, which are drawn again and divided in 25 replicates of 200 lines. his phase is necessary to reach 2,000 surveys, once it is not possible to previously estimate the proportion of active residential lines. More details on the sampling process can be seen in other publications5-8.
Telephone surveys carried out by VIGITEL in 2006, 2007, 2008 and 2009 consisted of the application of a question-naire. he computer was used to read the questions and immediately register the responses. In these years, 53,882, 53,802, 53,895 and 53,908 people aged 18 years or more were interviewed, respectively. Besides demographic and economic characteristics, other information such as reported weight and height were obtained.
he outcomes of this study were deined by the body mass index (BMI), which is a result of the division of reported weight, in kilos (kg), by height, in squared meters (m2), and also reported by the interviewee.
Overweight was observed when BMI was equal or superior to 25 kg/m2, and 30 kg/
m2 was the cut of value to deine obesity
according to WHO9.
he trends in overweight and obesity prevalence rates are presented for men and women and according to age group (in six age categories: 18 to 24; 25 to 34; 35 to 44; 45 to 54; 55 to 64; and 65 years or more), years of schooling (until 8; 9 to 11 and 12 years or more), being married (stable relationship) or single (including divorced and widow) and skin color reported by the interviewee.
Overweight and obesity prevalence rates and their respective 95% conidence intervals are presented for the following categories: age group, years of schooling, stable relationship and skin color. Poisson regression was used to analyze the trends from 2006 to 2009. Overweight and obesity were considered as dependent variables, and year of the survey was considered as an explanatory variable – 2006 was used as reference. Trends are presented for each category of the studied variables. he weighting factor was considered in all analyses. Households with more than one telephone line and fewer inhabitants had a higher chance at the draw. his factor was also used to adjust the sociodemo-graphic distribution of the sample selected for VIGITEL in relation to the distribution of the adult population of the 27 cities participating in Census 2000, considering population weight of each city from the stratiication in 36 demographic character-istics, according to gender (male; female), age group (18 to 25, 30 to 39, 40 to 59, and 60 years of more), and years of schooling of 0 to 8, 9 to 11 and 12 or more years. As for the sampling procedures, the same weighting process was conducted for all assessed years.
Human Beings, of the Ministry of Health. Informed consent form was replaced by a verbal consent, obtained during telephone survey.
Results
he post-stratiication sample was comprised of 53% of women, and more than two thirds of the participants (69%) were less than 45 years old. In 2006, 35% had not inished Elementary School (eight or more years of schooling), and this proportion reached almost 32% in 2009. More than half of the interviewees were married and referred as having mixed skin throughout the period. he analysis of the latter variables, which were not considered for weighting process, shows there was a larger proportion of participants who reported having a partner in the household and
having brown skin in 2008, when compared to 2006. his shows that the samples were diferent as to marital status and skin color.
Overweight prevalence rates were 43.0, 42.7, 44.2 and 46.6% for each year, from 2006 to 2009, respectively. As to obesity, the following rates were found for the same period: 11.4, 12.7, 13.2 and 13.8%. Frequency of overweight and obesity were diferent for men and women, but the increased prevalence was observed in the whole group and women.
Temporal variation in overweight preva-lence rates for men and women and as to age group is demonstrated in Tables 1 and 2, respectively. From 2006 to 2009, overweight prevalence rates tented to increase especially for older men (65 years old or more). Among the youngest (18 to 24 years old), although such prevalence was 50% higher in 2009 than in 2006, this result was at the limit of signiicance (p=0.05). Younger women aged
Table 1. Temporal variation in the prevalence of excess weight in the set of adult men from the Brazilian State capitals and the Federal District, in the period from 2006 to 2009, according to demographic and economic* characteristics. VIGITEL 2006, 2007, 2008 and 2009
Tabela 1. Variação temporal na prevalência do excesso de peso no conjunto de homens adultos das capitais dos estados brasileiros e Distrito Federal, no período de 2006 a 2009, segundo características demográficas e econômica*. VIGITEL 2006, 2007, 2008 e 2009
Chtortocteristics 2006 2007 2008 2009 p**
% (95%CI) % (95%CI) % (95%CI) % (95%CI)
TOge (yetors)
18 to 24 24.9 (21.0–28.8) 26.4 (22.1–30.7) 25.1 (21.1–29.1) 37.3 (26.7–47.9) 0.05 25 to 34 48.1 (44.8–51.4) 48.4 (45.0–51.8) 47.9 (44.4–51.5) 48.9 (45.2–52.7) 0.83 35 to 44 56.7 (53.7–59.8) 56.9 (54.1–59.6) 57.5 (54.7–60.3) 56.9 (53.8–60.0) 0.99 45 to 54 58.8 (55.5–62.1) 61.3 (57.9–64.7) 62.3 (59.1–65.5) 59.1 (55.9–62.4) 0.37 55 to 64 55.9 (51.0–60.8) 57.4 (53.1–61.8) 60.3 (56.2–64.4) 59.6 (55.4–63.8) 0.48 65 and more 50.1 (45.7–54.5) 49.4 (45.1–53.6) 51.6 (47.1–56.1) 55.7 (51.4–60.1) 0.04
Schooling (years)
0 to 8 46.0 (43.3–48.8) 47.1 (44.5–49.7) 45.6 (42.7–48.5) 51.4 (47.4–55.5) 0.08 9 to 11 45.5 (43.2–47.7) 45.0 (43.0–47.1) 48.3 (46.2–50.3) 46.3 (44.2–48.4) 0.41 12 and more 54.6 (51.8–57.5) 57.9 (55.4–60.5) 59.2 (56.6–61.8) 58.1 (55.6–60.6) 0.95
Marital status
Married or in a stable relationship
55.9 (54.0–57.8) 56.0 (54.0–58.0) 57.4 (54.7–60.1) 59.1 (56.0–62.1) 0.10
Single/Divorced 36.2 (33.5–39.0) 38.2 (35.5–40.8) 37.6 (35.2–39.9) 40.4 (37.3–43.5) 0.27
Skin color
White 49.2 (46.7–51.7) 50.9 (48.3–53.4) 50.1 (47.6–52.5) 52.2 (49.6–54.7) 0.49 Black 45.5 (38.6–52.5) 44.9 (37.8–51.9) 49.4 (42.5–56.4) 54.5 (44.9–64.0) 0.11 Mixed 46.1 (43.7–48.4) 47.0 (44.8–49.1) 48.0 (45.4–50.5) 49.8 (46.2–53.3) 0.18 Total 47.3 (45.6–49.0) 48.3 (46.7–49.9) 48.6 (46.8–50.4) 51.0 (48.7–53.4) 0.06
* Weighed percentage to adjust sociodemographic distribution of the VIGITEL sample to the distribution of the adult population in each city, according to the Census 2000, and to consider population weight in each city. ** Linear trend test adjusted as to weighting factor.
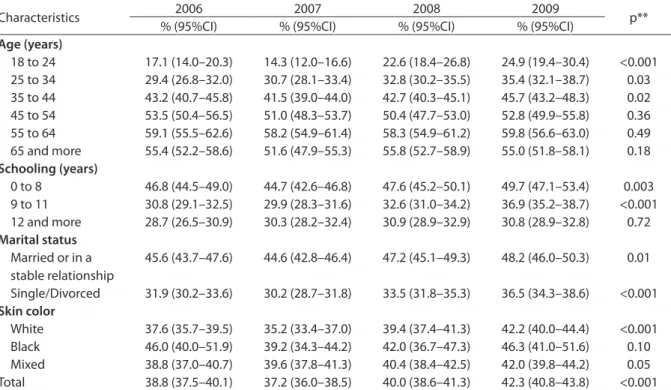
less than 45 years contributed the most for the increased overweight prevalence rates from 2006 to 2009 (Table 2).
In Table 1 it is also possible to observe there were no diferences in overweight prevalence rates among men in relation to years of schooling, marital status or skin color; this increasing trend was also not signiicant for the whole group (p=0.06).
he increasing trend in overweight preva-lence rates was observed mainly in women with fewer years of schooling (less than 12 years) and those who reported having white skin. Just as this increasing trend was observed for all women (p<0.001), and although married people or those who are in a stable relationship presented higher overweight rates, the increasing trend in women does not depend on marital status (Table 2).
In Table 2, it is demonstrated that there was no prevalence increase as to obesity
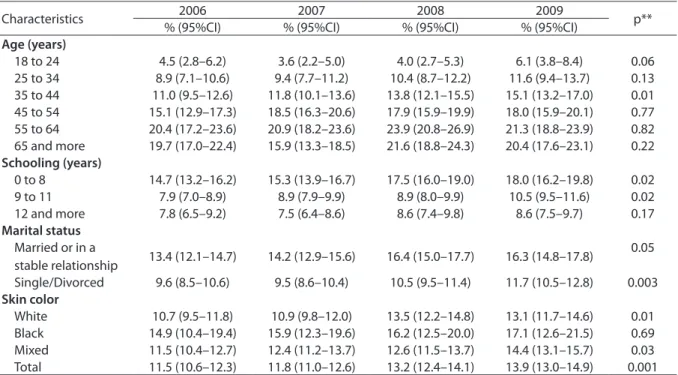
from 2006 to 2009 for men, considering the analyzed group (p=0.82). However, it is observed that obesity prevalence rates in 2009 were higher than in previous years (p=0.04) for young men (18 to 24 years old). An increasing trend in obesity preva-lence rates for all women is observed from 2006 to 2009 (p=00.001), and such increase was different according to the categories: age, schooling, marital status and skin color (Table 4). Thus, there was an increasing trend in obesity prevalence rates, especially among women aged 35 to 44 years, as well as among those with fewer years of schooling (<12 years), white or brown. In Table 4 it is also possible to see the clear increasing trend among single or divorced women. For married women or those who are in a stable relationship, this trend was at the limit of significance (p=0.05).
Table 2. Temporal variation in the prevalence of excess weight in the set of adult women from the Brazilian State capitals and the Federal District in the period from 2006 to 2009, according to demographic and economic* characteristics. VIGITEL 2006, 2007, 2008 and 2009
Tabela 2. Variação temporal na prevalência do excesso de peso no conjunto de mulheres adultas das capitais dos estados brasileiros e Distrito Federal, no período de 2006 a 2009, segundo características demográficas e econômica*. VIGITEL 2006, 2007, 2008 e 2009
Characteristics 2006 2007 2008 2009 p**
% (95%CI) % (95%CI) % (95%CI) % (95%CI)
Age (years)
18 to 24 17.1 (14.0–20.3) 14.3 (12.0–16.6) 22.6 (18.4–26.8) 24.9 (19.4–30.4) <0.001 25 to 34 29.4 (26.8–32.0) 30.7 (28.1–33.4) 32.8 (30.2–35.5) 35.4 (32.1–38.7) 0.03 35 to 44 43.2 (40.7–45.8) 41.5 (39.0–44.0) 42.7 (40.3–45.1) 45.7 (43.2–48.3) 0.02 45 to 54 53.5 (50.4–56.5) 51.0 (48.3–53.7) 50.4 (47.7–53.0) 52.8 (49.9–55.8) 0.36 55 to 64 59.1 (55.5–62.6) 58.2 (54.9–61.4) 58.3 (54.9–61.2) 59.8 (56.6–63.0) 0.49 65 and more 55.4 (52.2–58.6) 51.6 (47.9–55.3) 55.8 (52.7–58.9) 55.0 (51.8–58.1) 0.18
Schooling (years)
0 to 8 46.8 (44.5–49.0) 44.7 (42.6–46.8) 47.6 (45.2–50.1) 49.7 (47.1–53.4) 0.003 9 to 11 30.8 (29.1–32.5) 29.9 (28.3–31.6) 32.6 (31.0–34.2) 36.9 (35.2–38.7) <0.001 12 and more 28.7 (26.5–30.9) 30.3 (28.2–32.4) 30.9 (28.9–32.9) 30.8 (28.9–32.8) 0.72
Marital status
Married or in a stable relationship
45.6 (43.7–47.6) 44.6 (42.8–46.4) 47.2 (45.1–49.3) 48.2 (46.0–50.3) 0.01
Single/Divorced 31.9 (30.2–33.6) 30.2 (28.7–31.8) 33.5 (31.8–35.3) 36.5 (34.3–38.6) <0.001
Skin color
White 37.6 (35.7–39.5) 35.2 (33.4–37.0) 39.4 (37.4–41.3) 42.2 (40.0–44.4) <0.001 Black 46.0 (40.0–51.9) 39.2 (34.3–44.2) 42.0 (36.7–47.3) 46.3 (41.0–51.6) 0.10 Mixed 38.8 (37.0–40.7) 39.6 (37.8–41.3) 40.4 (38.4–42.5) 42.0 (39.8–44.2) 0.05 Total 38.8 (37.5–40.1) 37.2 (36.0–38.5) 40.0 (38.6–41.3) 42.3 (40.8–43.8) <0.001
* Weighed percentage to adjust sociodemographic distribution of the VIGITEL sample to the distribution of the adult population in each city, according to the Census 2000, and to consider population weight in each city. ** Linear trend test adjusted as to weighting factor.
Discussion
According to the results, it is possible to say that variations in overweight and obesity prevalence rates from 2006 to 2009 are diferent for men and women, especially according to characteristics such as: age, schooling, marital status and skin color of the participants of VIGITEL.
he main limitation to analyze these data is due to the fact that overweight and obesity prevalence rates were deined from reported weight and height infor-mation, since it was a telephone survey. Although some diferences are observed when anthropometric measures are self-reported by the participant than when they are measured10, obtaining this information
by telephone enables to assess annual variations in a faster, simpler and cheaper way. It is also important to observe that the results in this study, especially in relation to
men, were very similar to those found by the Consumer Expenditure Survey (Pesquisa de Orçamentos Familiares – POF) 2008-2009 with a representative sample of the urban and rural regions of the ive Brazilian regions,
aged 20 years or more2. Even though there
is a diference in age of inclusion as to this study (18 years old or more), and that only those living in state capitals and the Federal District were included, overweight preva-lence rates for women in POF 2008-009 were 50.1%, which is very similar to those found in men participating in VIGITEL, in 2009 (51%). Among women, on the other hand, overweight (48%) and obesity (17%) prevalence rates found in POF 2009-2009 are six and three percentage points higher than those found in this study in 2009, respectively, even with the increasing trend found in the period from 2006 to 2009. his result is in accordance with a study on validation of reported weight and height10, Table 3. Temporal variation in the prevalence of obesity in the set of adult men of the Brazilian State capitals and the Federal District in the period 2006-2009, according to demographic and economic* characteristics. VIGITEL 2006, 2007, 2008 and 2009 Tabela 3. Variação temporal na prevalência de obesidade no conjunto de homens adultos das capitais dos estados brasileiros e Distrito Federal, no período de 2006 a 2009, segundo características demográficas e econômica*. VIGITEL 2006, 2007, 2008 e 2009
Characteristics 2006 2007 2008 2009 p**
% (95%CI) % (95%CI) % (95%CI) % (95%CI)
Age (years)
18 to 24 4.1 (2.9–5.3) 4.5 (3.1–5.8) 5.5 (3.7–7.2) 7.6 (4.7–10.6) 0.04
25 to 34 11.8 (9.4–14.1) 13.1 (10.9–15.4) 12.7 (10.1–15.2) 13.6 (10.5–16.7) 0.79 35 to 44 13.6 (11.7–15.4) 17.9 (15.6–20.2) 16.0 (13.9–18.1) 16.0 (13.8–18.2) 0.25 45 to 54 16.7 (14.0–19.3) 19.6 (16.8–22.3) 18.5 (15.7–21.2) 16.6 (14.2–19.0) 0.11 55 to 64 13.0 (10.2–15.9) 18.5 (15.5–21.6) 18.2 (15.0–21.4) 19.9 (16.4–23.4) 0.56 65 and more 11.0 (8.0–13.9) 10.3 (8.0–12.6) 11.7 (8.7–14.7) 12.4 (9.8–15.1) 0.23
Schooling (years)
0 to 8 11.8 (10.2–13.3) 13.7 (12.1–15.3) 13.3 (11.6–15.1) 14.1 (11.9–16.3) 0.77 9 to 11 9.9 (8.8–11.1) 12.3 (11.0–13.6) 11.8 (10.6–13.1) 11.9 (10.6–13.2) 0.68 12 and more 11.7 (10.0–13.4) 15.2 (13.4–17.1) 14.7 (12.8–16.6) 15.7 (13.8–17.6) 0.73
Marital status
Married or in a
stable relationship 14.3 (13.0–15.6) 16.5 (15.2–17.9) 16.4 (14.9–18.0) 15.8 (14.1–17.6) 0.55 Single/Divorced 7.4 (6.0–8.7) 9.6 (8.1–11.0) 9.0 (7.4–10.5) 11.0 (9.0–13.0) 0.26
Skin color
White 11.1 (9.6–12.6) 13.9 (12.2–15.5) 13.8 (12.2–15.3) 14.1 (12.0–16.1) 0.89 Black 13.9 (9.7–18.1) 15.0 (10.4–19.5) 17.4 (10.9–24.0) 17.3 (11.4–23.1) 0.55 Mixed 11.2 (10.0–12.5) 13.0 (11.7–14.3) 12.3 (10.9–13.7) 13.0 (11.3–14.7) 0.98 Total 11.3 (10.3–12.2) 13.5 (12.5–14.5) 13.1 (12.0–14.2) 13.7 (12.4–15.0) 0.82
* Weighed percentage to adjust sociodemographic distribution of the VIGITEL sample to the distribution of the adult population in each city, according to the Census 2000, and to consider population weight in each city. ** Linear trend test adjusted as to weighting factor.
which suggests that BMI is underestimated in reports by women, whereas it is reliable when it comes to men.
While diferences in overweight and obesity prevalence rates for men and women are presented in Brazilian studies which measure weight and height, the same does not occur when such information is reported by the participants11. In this case,
overweight was more prevalent among men
(47%) than among women (39%), in 200611,
and this diference continued until 2009. However, the obesity prevalence rate was not diferent between men and women in 2006 (11%)11, and there was also no diference in
obesity prevalence rates for between men and women in 2009 (14%).
Concerning the trend of overweight and obesity, since data obtained in 1974 and 1975 regarding the Brazilian population until the last POF2, it is observed that such
prevalence rates increased in 34 years for both genders. While overweight preva-lence rate increased almost three times (18.5% in 1974 and 1975 and 50.1% in 2008 and 2009) for men, this prevalence almost doubled among women (28.7% in 1974 and 1975 and 48.0% in 2008 and 2009). As to obesity, the increase for men was superior to four times (2.8% in 1974 and 1975 and 12.4% in 2008 and 2009), and the double among women (8.0% in 1074 and 1975 and 16.9% in 2008 and 2009)2. On the other
hand, this study shows the clear increasing trend in relation to overweight and obesity concerning women in four years. here was no diference in overweight prevalence rates among men from 2006 to 2009 (p=0.06). he trends observed in the Brazilian population are diferent from those in the United States, shown in national studies (National Health and Nutrition Examination Survey
Tabela 4. Temporal variation in the prevalence of obesity in the set of adult women of the Brazilian State capitals and the Federal District in the period from 2006 to 2009, according to demographic and economic* characteristics. VIGITEL 2006, 2007, 2008 and 2009
Tabela 4. Variação temporal na prevalência de obesidade no conjunto de mulheres adultas das capitais dos estados brasileiros e Distrito Federal, no período de 2006 a 2009, segundo características demográficas e econômica*. VIGITEL 2006, 2007, 2008 e 2009
Characteristics 2006 2007 2008 2009 p**
% (95%CI) % (95%CI) % (95%CI) % (95%CI)
Age (years)
18 to 24 4.5 (2.8–6.2) 3.6 (2.2–5.0) 4.0 (2.7–5.3) 6.1 (3.8–8.4) 0.06
25 to 34 8.9 (7.1–10.6) 9.4 (7.7–11.2) 10.4 (8.7–12.2) 11.6 (9.4–13.7) 0.13 35 to 44 11.0 (9.5–12.6) 11.8 (10.1–13.6) 13.8 (12.1–15.5) 15.1 (13.2–17.0) 0.01 45 to 54 15.1 (12.9–17.3) 18.5 (16.3–20.6) 17.9 (15.9–19.9) 18.0 (15.9–20.1) 0.77 55 to 64 20.4 (17.2–23.6) 20.9 (18.2–23.6) 23.9 (20.8–26.9) 21.3 (18.8–23.9) 0.82 65 and more 19.7 (17.0–22.4) 15.9 (13.3–18.5) 21.6 (18.8–24.3) 20.4 (17.6–23.1) 0.22
Schooling (years)
0 to 8 14.7 (13.2–16.2) 15.3 (13.9–16.7) 17.5 (16.0–19.0) 18.0 (16.2–19.8) 0.02
9 to 11 7.9 (7.0–8.9) 8.9 (7.9–9.9) 8.9 (8.0–9.9) 10.5 (9.5–11.6) 0.02
12 and more 7.8 (6.5–9.2) 7.5 (6.4–8.6) 8.6 (7.4–9.8) 8.6 (7.5–9.7) 0.17
Marital status
Married or in a
stable relationship 13.4 (12.1–14.7) 14.2 (12.9–15.6) 16.4 (15.0–17.7) 16.3 (14.8–17.8)
0.05
Single/Divorced 9.6 (8.5–10.6) 9.5 (8.6–10.4) 10.5 (9.5–11.4) 11.7 (10.5–12.8) 0.003
Skin color
White 10.7 (9.5–11.8) 10.9 (9.8–12.0) 13.5 (12.2–14.8) 13.1 (11.7–14.6) 0.01 Black 14.9 (10.4–19.4) 15.9 (12.3–19.6) 16.2 (12.5–20.0) 17.1 (12.6–21.5) 0.69 Mixed 11.5 (10.4–12.7) 12.4 (11.2–13.7) 12.6 (11.5–13.7) 14.4 (13.1–15.7) 0.03 Total 11.5 (10.6–12.3) 11.8 (11.0–12.6) 13.2 (12.4–14.1) 13.9 (13.0–14.9) 0.001
* Weighed percentage to adjust sociodemographic distribution of the VIGITEL sample to the distribution of the adult population in each city, according to the Census 2000, and to consider population weight in each city. ** Linear trend test adjusted as to weighting factor.
– NHANES) conducted from 1999 to 2008. he analysis shows that obesity prevalence rates have been increasing among men, but not among women12,13.
Concerning the trend by age group in men, while this study showed increasing overweight in extreme age groups, the increasing obesity in the United Stated was spread to all age groups13, especially people
aged 40 years or more12. However, increasing
obesity from 2006 to 2009 among men inter-viewed by VIGITEL was observed for the group aged 18 to 24 years, and women aged 35 to 44 years.
he evolution in overweight and obesity prevalence rates according to the socio-economic situation in Brazil in a period of 34 years (1974 and 1975 to 2008 and 2009) shows that increasing trends were present in all income strata among men; as to women, the prevalence was among the ones in the irst two-ifths of income distri-bution2. A previous study with the Brazilian
population, consisting of a period of 23 years (1974-75 to 1997) showed a substantial change in obesity trends in relation to schooling14. While the risk of obesity was
increasing in all school levels from 1974 to 1975 until 1989, the obesity increase was higher in individuals with fewer years of schooling from 1989 to 1997. Obesity among women in groups with middle and high levels of schooling was stable and even decreasing14. In this study, increasing
overweight and obesity were observed for women with fewer years of schooling (less than 12 years) and, as to men, no difer-ences regarding schooling were found. his result is probably related to the temporal stability in overweight and obesity for men in the period of four years. It is important to describe that the separate analysis of each year shows that women with fewer years of schooling always present higher prevalence rates regarding overweight and obesity, but such association is not clear among men.
Higher overweight and obesity preva-lence rates among people in a stable relation have been reported in a longitu-dinal national study, conducted for ten
years with the population in the United States15, just like the Brazilians who
partici-pated in VIGITEL, in 200611. However, the
increasing trend in such prevalence rates was observed among women from 2006 to 2009, regardless of marital status.
In 2006, VIGITEL data showed that overweight and obesity prevalence rates were higher among black and brown women when compared to the white ones11, while
data from a telephone survey conducted in the United States (which was an example to studies conducted by VIGITEL) also showed such diference16. An increasing trend in
prevalence rates regarding the black and Mexican population living in the United States has also been observed from a period of six12 to ten years13. On the other hand,
results in this study show an increasing trend of overweight and obesity prevalence rates among white and brown women.
Overweight and obesity prevalence rates have been increasing in the Brazilian population, and the temporal variation of VIGITEL data, from 2006 to 2009, conirms this fact. While more than half of Brazilian men are overweight, according to data from VIGITEL, women show lower prevalence rates than those found in POF 2008-20092,
which could be related to the poorer report of increased weight by women. Classiication errors caused by the self-report of anthropo-metric measures may also have occurred as to obesity. hus, prevalence rates presented by VIGITEL are also a little lower than those recently presented by POF 2008-2009. However, even if women are not properly reporting their nutritional status, the increasing trend in these numbers in a short period of time is worrisome.
References
1. World health organization. Overweight and obesity. Fact sheet No. 311. Geneva: WHO; 2011.
2. Instituto Brasileiro de Geograia e Estatística – IBGE. Pesquisa de orçamentos familiares 2008-2009: antropometria e estado nutricional de crianças,
adolescentes e adultos no Brasil. Rio de Janeiro: IBGE; 2010.
3. Serdula MK, Ivery D, Coates RJ, Freedman DS, Williamson DF, Byers T. Do obese children become obese adults? A review of the literature. Prev Med. 1993;22:167-77.
4. Whitaker RC, Wright JA, Pepe MS, Seidel KD, Dietz WH. Predicting obesity in young adulthood from childhood and parental obesity. N Engl J Med. 1997;337:869-73.
5. Brasil. Ministério da Saúde. Secretaria de Vigilância em Saúde. Secretaria de Gestão Estratégica e Participativa. VIGITEL Brasil 2009: vigilância de fatores de risco e proteção para doenças crônicas por inquérito telefônico. Brasília: Ministério da Saúde; 2010.
6. Brasil. Ministério da Saúde. Secretaria de Vigilância em Saúde. Secretaria de Gestão Estratégica e Participativa. VIGITEL Brasil 2006: vigilância de fatores de risco e proteção para doenças crônicas por inquérito telefônico. Brasília: Ministério da Saúde; 2007.
7. Brasil. Ministério da Saúde. Secretaria de Vigilância em Saúde. Secretaria de Gestão Estratégica e Participativa. VIGITEL Brasil 2007: vigilância de fatores de risco e proteção para doenças crônicas por inquérito telefônico. Brasília: Ministério da Saúde; 2008.
8. Brasil. Ministério da Saúde. Secretaria de Vigilância em Saúde. Secretaria de Gestão Estratégica e Participativa. VIGITEL Brasil 2008: vigilância de fatores de risco e proteção para doenças crônicas por inquérito telefônico. Brasília: Ministério da Saúde; 2009.
9. World Health Organization. Obesity: preventing and managing the Global Epidemic. Report on a WHO Expert Consultation on Obesity, 3-5 June 1997. Geneva; 1997.
10. Silveira E, Araújo CL, Gigante DP, Barros, AJ, Lima MS. Validação do peso e altura referidos para o diagnóstico do estado nutricional em uma população de adultos no Sul do
Brasil.Cad Saúde Pública. 2005;21:235-45.
11. Gigante DP, Moura EC, Sardinha LMV. Prevalência de excesso de peso e obesidade e fatores associados, Brasil,
2006.Rev Saúde Pública. 2009;43:S83-9.
12. Ogden CL, Carroll MD, Curtin LR, McDowell MC, Tabak CJ, Flegal, KM. Prevalence of overweight and obesity in the United States, 1999-2004. JAMA. 2006;295:1549-55.
13. Flegal KM, Carroll MD, Ogden CL, Curtin LR. Prevalence and trends in obesity among US adults, 1999-2008. JAMA. 2010;303:235-41.
14. Monteiro CA, Conde WL, de Castro IR. he changing relationship between education and risk of obesity in Brazil (1975-1997). Cad Saude Pública. 2003;19:S67-75.
15. Sobal J, Rauschenbach B, Frongillo EA. Marital status changes and body weight changes: a US longitudinal analysis. Soc Sci Med. 2003;56:1543-55.
16. Mokdad AH, Ford ES, Bowman BA, Dietz WH, Vinicor F, Bales VS, et al. Prevalence of obesity, diabetes, and obesity-related health risk factors. JAMA. 2003;289:76-9.