Bullying among adolescents
in a Brazilian urban center –
“Health in Beagá” Study
I Faculdade de Medicina. Universidade
Federal de Minas Gerais. Belo Horizonte, MG, Brasil
II Faculdade da Saúde e Ecologia Humana.
Vespasiano, MG, Brasil Correspondence: Michelle Ralil da Costa
Rua Raul Pompéia, 64 sala 303 São Pedro 30303-080 Belo Horizonte, MG, Brasil E-mail: [email protected]
Received: 10/15/2013 Approved: 12/5/2014
ABSTRACT
OBJECTIVE: To analyze the prevalence of bullying and its associated factors in Brazilian adolescents.
METHODS: Data were used from a population-based household survey conducted by the Urban Health Observatory (OSUBH) utilizing probability sampling in three stages: census tracts, residences, and individuals. The survey included 598 adolescents (14-17 years old) who responded questions on bullying, sociodemographic characteristics, health-risk behaviors, educational well-being, family structure, physical activity, markers of nutritional habits, and subjective well-being (body image, personal satisfaction, and satisfaction with their present and future life). Univariate and multivariate analysis was done using robust Poisson regression.
RESULTS: The prevalence of bullying was 26.2% (28.0% among males, 24.0% among females). The location of most bullying cases was at or on route to school (70.5%), followed by on the streets (28.5%), at home (9.8%), while practicing sports (7.3%), at parties (4.6%), at work (1.7%), and at other locations (1.6%). Reports of bullying were associated with life dissatisfaction,
dificulty relating to parents, involvement in ights with peers and insecurity
in the neighborhood.
CONCLUSIONS: A high prevalence of bullying among participating adolescents was found, and the school serves as the main bullying location, although other sites such as home, parties and workplace were also reported. Characteristics regarding self-perception and adolescent perceptions of their environment were also associated with bullying, thus advancing the knowledge of this type of violence, especially in urban centers of developing countries.
DESCRIPTORS: Adolescent Behavior. Bullying. Risk Factors. Socioeconomic Factors. Violence. Health Surveys.
Michelle Ralil da CostaI
César Coelho XavierII
Amanda Cristina de Souza AndradeI
Fernando Augusto ProiettiII
Bullying is an aggressive behavior that can be deined
as “being the tough guy against someone”. The meaning of the term bullying, which does not have an appro-priate translation in Portuguese, can vary according to the culture. A study on the meaning of the term in 14 countries pointed to important differences between languages and even within the same language.20 It
generally refers to an afirmation of interpersonal power
in which the aggressor is referred to as the bully, which in Portuguese is translated as “tough guy”, and the target of the aggression is the victim. The dynamics of this type of violence is characterized by an imbalance of power and a lack of reciprocity.a
Although the term is used to name the practice of systematic humiliation of children and adoles-cents especially in the school environment, bullying surpasses the school walls. Homes, workplaces and even prisons are sites of bullying, despite the popular image of bullying as a school-based phenomenon.19
Bullying can be considered a health problem resulting in behavioral and emotional issues for the victims, including stress, decreased self-esteem, anxiety, depres-sion, poor academic performance, and, in severe cases, even death.3 Bullying and its consequences are directly
related to well-being and has been the subject of various studies, including a report presented by UNICEF in February 2007, addressing a global vision of child well-being in 21 developed countries.b
In a major study from 2007, 1/3 of children in the 21 European countries composing the Organization for Economic Co-operation and Development (OECD) claimed to have been bullied at least once during the two previous months, and a similar proportion of chil-dren declared to bully other chilchil-dren.b The prevalence
of students victimized varies between 8.0% and 46.0%, and of aggressors varies between 5.0% and 39.0%, with 20.0% of the children into both categories.b,c,d
The National Study on School Health (PeNSE), the most comprehensive study on the topic in Brazil, conducted in 2009, the prevalence of victimization by bullying found in Brazilian state capitals was 30.8%, with the highest frequency (35.3%) being found in INTRODUCTION
Belo Horizonte, Southeastern Brazil.e In the same
study, the prevalence of victimization by bullying was 35.4% in 2012.f
Many factors are associated to bullying (including both
proiles: aggressor and victim), such as: age,17 family
dynamics,19 interpersonal relationships,9 social context,
consumption of alcohol and tobacco, poor academic performance, feelings of despair, loneliness, and quality of life should be highlighted.1,18 Bullying can be inlu
-enced by proximal and distal factors, such as individual and family, social and neighborhood characteristics, respectively4 (Figure 1).
National and international studies have generally approached bullying using school surveys. Although factors associated with bullying have been
identi-ied, most studies have been undertaken in developed
countries, thus these factors may not coincide with the Brazilian reality. Furthermore, population-based studies can contribute to bullying research.
This study aimed to analyze the prevalence of bullying and its associated factors in Brazilian adolescents.
METHODS
In this cross-sectional study, we analyzed data from the “Beagá Health Study”,10 a household survey
under-taken in two sanitary districts of Belo Horizonte, MG, Southeastern Brazil, in 2009, representing 24.0% of the city population of 2,375,151 inhabitants,g and with
a large socioeconomic heterogeneity.
The sampling was stratiied in three stages. The strati
-ication factor was the health vulnerability index (IVS
in the Portuguese acronym), which was determined by combining social, demographic, economic, and health indicators. At each level, the following were randomly selected: census tract; household; and individual, where once in the household, an adult resident (> 18 years old) and, if existing, an adolescent (between 11 and 17 years) were selected. From a frame list provided by the munici-pality, 149 census tracts were randomly selected in the
two sanitary districts of the city. Vacant lots, institutional
and commercial buildings, vacant households or those
a Olweus D. Acoso escolar: hechos y medidas de intervenciones. Ponencia presentada en el Encuentro Europeo por la Convivencia; 2007
[cited 2010 Mar 20]. Available from: http://www.educa.madrid.org/binary/20/DAN_OLWEUS.pdf
b United Nations Children’s Fund. Child poverty in perspective: an overview of child well-being in rich countries. Florence, Italy: UNICEF
Innocenti Research Centre; 2007 [cited 2017 Sept 9]. (Report Card; 7). Available from: http://www.UNICEF-irc.org/publications/pdf/rc7_eng.pdf
c Lopes Neto AA, Saavredra LH. Diga não para o bullying – programa de redução do comportamento agressivo entre estudantes. Rio de
Janeiro (RJ): Associação Brasileira Multiprofissional de Proteção à Infância e à Adolescência; 2003.
d The Chief Public Health Officer’s. Report on the State of Public Health in Canada, 2011: Youth and Young Adults – Life in Transition. Ottawa;
2011 [cited 2012 Feb 12]. Available from: http://publichealth.gc.ca/CPHOreport
e Instituto Brasileiro de Geografia e Estatística. Pesquisa Nacional de Saúde do Escolar. Rio de Janeiro (RJ); 2009 [cited 2013 Apr 15]. Available
from: http://www.ibge.gov.br/home/estatistica/populacao/pense/pense.pdf
f Instituto Brasileiro de Geografia e Estatística. Pesquisa Nacional de Saúde do Escolar. Rio de Janeiro (RJ); 2012 [cited 2014 Oct 21]. Available
from: http://www.ibge.gov.br/home/estatistica/populacao/pense/2012/pense_2012.pdf
that were closed after three tentative visits were deleted. Within census tract, 5,171 households comprised the eligible list, deriving a study sample of 4,048 residents
≥ 18 years and 1,197 adolescents. Due to 13.3% of refusals, incomplete interviews, and lost of contact after
three attempts, the inal sample of adolescents ranging
from 11 to 17 years old consisted of 1,048 participants. Out of them, this study refers to 598 adolescents aged
from 14 to 17 years who answered the speciic risk
behavior questionnaire including bullying questions.
The questionnaire was self-applied and included questions about: physical activity; sexual initiation and risk behaviors such as consumption of alcohol, drugs, and tobacco; and involvement in violent situ-ations, including bullying. The collection instruments were prepared by OSUBH based on Brazilian,e and
internationalb,h studies. All instruments were pre-coded
and pre-tested in a pilot study.
The dependent variable (bullying) was obtained by the question “Have you suffered from repeated intimida-tion, offense, aggression or harassment that made you feel humiliated or afraid?”, which investigated bullying from the perspective of the victim. If so, “Where did this take place?”. The participant could select multiple answers to better understand the locations of bullying.
From the perspective of the theoretical model proposed by this study (Figure 1), based on the Urban Health
Model from Galea & Vlahov11 and adapted by Caiaffa et
al,4 the independent variables represented the following
proximal factors: individual variables (age, gender, student status during the study year, type of school [public; private], grade repetition, consumption of
tobacco, alcohol or illicit drugs, body image, mental well-being, and life satisfaction); and the following distal factors: family-related variables (educational attainment of the head of household, family conversa-tions, if the family eats meals together, reports of family
conlicts, adolescent perception of being loved, parental
supported, being able to share problems with parents,
reports of ighting with parents, suficient parental
attention or involvement, and if parents cause adoles-cents to feel badly about themselves); perceptions of the social environment (whether friends are helpful and fun, feelings of exclusion, feelings of awkwardness or discomfort in social settings, feelings of loneliness), and variables related to the neighborhood (measured
by the IVS, a geocoded health risk indicator based on
place of residence, and insecurity within the neighbor-hood as perceived by the adolescent).
The “Faces Scale”2 and the “Life Satisfaction Scale”6
were used to evaluate psychological well-being. Body satisfaction was evaluated by a scale developed to the Brazilian population.12
The household head’s educational level questions were answered by an adult resident and categorized by years of study (≤ 8 years and > 8 years).
Prevalence rates and corresponding 95% conidence
intervals were calculated for bullying in the categories proposed. The variable (bullying) was dichotomized (yes; no) and described according to the domains of the proposed theoretical model (individual, social, familiar, and neighborhood characteristics). Pearson’s Chi-squared test was used to evaluate the association between bullying and the variables.
h Universidade Federal de Pelotas. Centro de Pesquisas Epidemiológicas. Estudo da Coorte de nascimentos de 1993 em Pelotas/RS. Pelotas (RS):
Faculdade de Medicina, UFPel; 1993 [cited 2013 Apr 13]. Available from: http://www.epidemio-ufpel.org.br/site/content/coorte_1993/index.php
Figure 1. Theoretical model proposed for this study, based on the Urban Health Model adapted from Galea & Vlahov,11 2005,
by Caiaffa et al,4 2008.
Bullying
Gender, age, education, habits and behaviors, self-perception and life satisfaction Individual
characteristics Individuals
Family structure, parental relationships, socio economic status and family perception
Relationships with friends, romantic relationships and social perception Characteristics
of context
Family
Social
Health Vulnerability Index (SVI) and self-perception of violence in the neighborhood
Unadjusted and adjusted analyses were done using prevalence ratios (PR) estimated according to the Poisson model with robust variance. The independent variables with a p < 0.20 in the univariate analysis were candidates for multiple analysis, along with other epide-miologically relevant variables.
The inal model was controlled for gender and age to
minimize the effects of these characteristics on the other
variables included in this study. Variables with p ≤ 0.05
remained in the inal model. The appropriateness of the
model was evaluated by the deviance test.
Stata software (Stata Corp., College Station, USA) version 10.0 for complex samples was used due to the sample weight and design.i
This study was approved by the Research Ethics Committees of the Universidade Federal de Minas Gerais and the Municipal Health Department of Belo Horizonte (Process ETIC 253/03 – Extension 01/08). The informed consent form was signed by the adoles-cents and their parents.
RESULTS
The sample included 598 adolescents aged from 14 to 17 years. Most adolescents were males (53.0%) and students (92.9%), of which 82.9% studied in public schools (Table 1).
The prevalence of reported bullying was 26.4% and the proportion did not differ according to age or gender. The location with the greatest frequency of bullying was the school (55.1%) followed by on the streets (28.5%), en route between home and school (15.4%), home (9.8%), practicing sports (7.3%), at parties (4.6%), at work (1.7%), and at other locations (1.6%). Reports of bullying in the school environment (at school or en route between school and home, which together account for 70.4%), did not differ between ages, while reports at other locations were most prominent among those with 17 years old (Figure 2).
Reports of bullying were more frequent among
adoles-cents who were in ights in which someone got hurt within
the last year, who have used drugs at least once, who have been drunk at least once, and who were smokers at the time of the survey. The prevalence of bullying was higher among those who reported worse perceptions of their psychological well-being, such as psychological distress and negative levels of life satisfaction. Similar results
were found among those who reported being dissatisied
with their body image (Table 1).
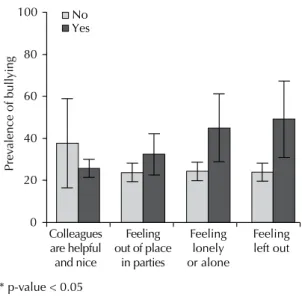
The prevalence of bullying did not differ depending on whether friends were perceived as helpful and fun
or if the participant felt awkward or uncomfortable at parties (Figure 3). However, bullying was more frequent among adolescents who felt excluded or alone. The strong association between the last two variables and bullying might be attributed to the conceptual proximity of these variables within this model. For this reason, it was decided to not include feelings of exclusion and feelings of loneliness or being alone in the adjusted analysis.
Pronounced collinearities were found between the variables bullying and risk behaviors (participating in
ights, drug-use, consumption of alcohol or tobacco,
episodes of drunkenness). It was decided to only include
“having participated in a ight in which someone got hurt within the last year” in the inal model.
Reports of bullying were more frequent among adoles-cents whose head of household had higher educational level and among adolescents with negative perceptions of their families, including: few conversations with
parents, many ights within the family, impossibility of discussing problems with parents, many ights with parents, and insuficient parental attention. Bullying
generally decreased when vulnerability increased: 32.4% of the adolescents who were victim of bullying lived in areas of low vulnerability, 26.2% in areas of moderate vulnerability, 25.3% in areas of high vulnerability, and 22.8% in areas of extreme vulnerability (Table 2).
Age and gender were used as adjustment variables in
the inal model due to their epidemiological impor -tance, although no statistical association was found in the univariate analysis. After adjustment, the variables that remained associated with bullying were: reports of
ights within the last year, life dissatisfaction, dificulty
in discussing problems with parents, educational attain-ment greater than eight years for the head of household and feelings of insecurity in the neighborhood (Table 3).
DISCUSSION
Approximately 1/4 of the adolescents reported being victims of bullying, with boys experiencing a slightly higher frequency than girls. Most adolescents reported the school environment (school or en route between home and school) as the location of bullying. Reports
of bullying were associated with involvement in ights with peers, life dissatisfaction, dificulty relating to
parents, and neighborhood insecurity.
The prevalence of bullying in this study (26.4%) was lower than that found by the National School Health Survey (PeNSE) conducted in Brazilian state capitals in the same year of this study (30.8%). Belo Horizonte was the capital with the highest frequency (35.3%).e This difference
i Chantala K, Tabor J. Strategies to perform a design-based analysis using the add health data. Chapel Hill: University of North Carolina; 1999
Table 1. Distribution of individual characteristics of adolescents (14 to 17 years) victims of bullying. Beagá Health Study, Belo Horizonte, MG, Southeastern Brazil, 2008 to 2009.
Variable Total Reports of bullying pb
n %a %a 95%CI
Individual – Individual characteristics
Gender
Feminine 285 46.6 28.0 22.1;33.9 0.393
Masculine 313 53.4 24.2 18.2;30.2
Age (years)
14 154 27.9 22.2 14.1;30.4 0.196
15 172 27.5 23.8 16.3;31.2
16 130 21.3 25.8 16.6;34.9
17 142 23.3 34.4 25.6;43.2
Currently studying (in 2008)
Yes 549 92.9 26.7 22.3;31.2 0.399
No 49 7.1 19.3 4.8;33.9
Type of school
Public 460 77.0 27.0 22.1;31.8 0.571
Private 86 15.3 26.5 15.6;37.5
Not studying/Other 52 7.7 18.0 4.3;31.7
Have you repeated a grade?
Yes 229 42.0 26.0 19.2;32.7 0.900
No 351 58.0 26.5 20.9;32.2
In the past year, have you been involved in a fight in which someone has gotten hurt?
Yes 77 14.6 45.1 31.9;58.4 0.003
No 517 85.4 23.5 19.0;27.1
Have you ever used drugs?
Yes, at least once 42 6.9 43.2 24.1;62.4 0.044
Never 553 93.1 25.0 20.8;29.3
Do you currently drink alcohol?
Yes 73 11.9 35.7 23.2;48.1 0.085
No 525 88.1 24.9 20.6;29.3
Have you been drunk?
At least once 121 19.0 40.6 30.3;51.0 0.001
Never 477 81.0 22.8 18.3;27.3
Do you currently smoke?
Yes, daily/Sometimes 20 3.4 51.3 22.9;79.7 0.045
No 578 96.6 25.3 21.2;29.5
Psychological well-being
Distress 28 4.3 43.6 21.9;65.3 0.069
Well-being 570 95.7 25.4 21.3;29.6
Life satisfaction
Dissatisfied 81 14.1 44.9 31.5;58.3 0.001
Satisfied 517 85.9 23.2 19.1;27.2
Body image
Dissatisfied 464 80.7 28.6 23.5;33.7 0.019
Satisfied 120 19.3 16.4 9.1;23.6
a Prevalence considering the sample weight and size. b Chi-square test.
could be attributed to the location of the study: PeNSE surveys were completed in the school environment, which may overestimate bullying frequency, whereas this study conducted in home could have underestimated the frequency. The time period associated with the ques-tions could be another factor. The PeNSE study investi-gated bullying within the last 30 days, whereas the Beagá Health Study asked about bullying during the participant’s lifetime. Asking about the violence suffered only in the previous month may have overestimated the prevalence of bullying because adolescents could have reported cases not considered as bullying (because of the lack of repeti-tion). In addition, the prevalence found in this study is part of the PeNSE study, suggesting that this difference might be due to differences in sample size. Moreover, PeNSE, conducted in 2012 pointed out increased prevalence in the Brazilian capitals between 2009 and 2012.15,f
The school as the principal site of bullying supports previous studies undertaken in school settings. However, due to the nature of the household setting, this study tested different locations of bullying others than school. The setting for this type of aggression differed in relation to age: younger adolescents tended to report bullying in the school environment, whereas other locations were primarily cited by older teens (17 years old). This difference could be due to lifestyle differences among age groups. Older adolescents may be inserted in other social institutions, such as the workplace. Also, Brazilian
adolescents typically inish high school at 16 years old.
A Canadian report on adolescents and adolescent health that considered many health issues facing this population, including bullying, has indicated the necessity of studying bullying beyond the school setting. Although urbanization and technological developments favor the occurrence of bullying in other locations, studies consistently show that this type of violence occurs at the school and its proximi-ties.15,22 The school is a fundamental part of adolescent life
since most of their days are spent there. For Lisboa and
Koller,13 most bullying incidents occur at school because
this is the principal microsystem for peer interactions.
Although some studies suggest that bullying occurs mostly among younger adolescentsi this study showed a
slightly higher bullying prevalence among older
adoles-cents. Large conidence intervals, due to the small sample
of older adolescents, contributed to a lack of statistical
signiicance. However, the violence experienced in child -hood and teenage years can be repeated in adult-hood and, perhaps, these data can help us understand the violence characterized as bullying at workplace in adult life, as presented in recent national5 and international studies.23
No signiicant differences between reports of bullying
among students of public versus private schools was found. These indings support the results of a compre -hensive Brazilian study,14 showing that bullying occurs
in the school setting regardless of its location, size, grade
levels or afiliation.c These results suggest that bullying
is not limited to speciic communities in today’s society.
The prevalence of bullying was higher among adolescents who reported involvement in physical aggression, drug-use, drunkenness, and current tobacco consumption. Literature describes the association between alcohol, tobacco, and bullying.16 The World Health Organization highlights the
strong association between an increase in violence and the consumption of alcohol and other drugs, which constitute a major public health challenge. The impact of this asso-ciation is relevant, leading to serious health and familial consequences, and weakening social networks.j Reports
of bullying were more frequent among adolescents who reported poor family perceptions. Smith20 states that among
Figure 2. Bullying according to age. Beagá Health Study, Belo
Horizonte, MG, Southeastern Brazil, 2008 to 2009.
(%)
Age (years)
No reports of bullying
No reports of bullying in other locations Reports of bullying the school or en route between home and school
100 80,0 60,0 40,0 20,0 0
14 15 16 17
j World Health Organization. Interpessoal violence and illicit drugs. Geneva; 2009 [cited 2011 Apr 12]. Available from: http://www.who.int/
topics/alcohol_drinking/en/
* p-value < 0.05
Figure 3. Prevalence of bullying according to social
characteristics. Beagá Health Study, Belo Horizonte, MG, Southeastern Brazil, 2008 to 2009.
Prev
alence of bullying
Colleagues are helpful and nice
Feeling out of place
in parties
Feeling lonely or alone
Feeling left out 0
20 40 60 80
Table 2. Distribution of contextual characteristics of adolescents (14 to 17 years) victims of bullying. Beagá Health Study, Belo Horizonte, MG, Southeastern Brazil, 2008 to 2009.
Variable Total Reports of bullying pb
n %a %a 95%CI
Contextual – Family characteristics
Educational attainment of head of household (years)
0 to 8 339 56.2 20.6 15.5;25.6 0.004
9 or more 251 43.8 33.2 26.5;40.0
How often do you speak with your parents?
Always 338 54.8 21.4 16.5;26.2 0.012
Never/Rarely/Sometimes 259 45.2 32.2 25.1;39.4
Do you eat your meals with your parents?
Never 54 9.8 34.6 17.7;51.5 0.242
Sometimes 542 90.2 25.2 21.1;29.4
In comparison with other families you know, are there fights in your family?
Many fights 74 26.8 43.6 30.5;56.8 0.006
Few fights 360 60.4 24.9 19.2;30.5
No fights 163 12.8 19.6 12.0;27.2
My parents make me feel loved and cared for
Yes 572 96.7 25.7 21.5;29.9 0.128
No 20 3.3 45.6 16.7;74.5
My parents are always on my side
Yes 565 95.6 26.1 21.8;30.3 0.306
No 27 4.4 37.9 13.6;62.1
I can discuss problems with my parents
Yes 477 79.4 21.8 17.5;26.1 < 0.001
No 114 20.6 44.1 33.4;54.8
My parents and I fight a lot
Yes 84 13.6 39.5 27.9;51.0 0.008
No 506 86.4 24.4 20.0;28.7
My parents give me sufficient attention
Yes 530 90.0 24.6 20.4;28.9 0.022
No 63 10.0 40.8 25.9;55.7
My parents make me feel badly about myself
Yes 43 6.8 40.1 22.6;57.6 0.063
No 548 93.2 25.4 21.3;29.5
Type of family
Traditional/Nuclear 397 68.5 25.7 20.6;30.7 0.877
Blended/Others 71 12.2 25.9 13.9;37.8
Single parent 130 19.1 28.3 19.6;37.0
Contextual – Neighborhood characteristics Health Vulnerability Index
Low 69 11.1 32.4 20.7;44.2 0.668
Medium 220 40.7 26.2 19.3;33.1
High 238 37.9 25.3 18.6;32.0
Very high 71 10.3 22.8 12.9;32.7
Do you feel insecure in your neighborhood?
Yes 275 46.6 31.2 24.1;38.3 0.044
No 322 53.4 21.9 16.8;27.1
a Prevalence considering the sample weight and size. b Chi-square test.
the risk factors for bullying are family issues, especially those resulting in violence and related to an environment lacking in affection. According to Debarbieux and Blaya,8
the home environment and the relationships established in this context can favor aggressive behaviors that charac-terize bullying. The home environment is generally labeled
as “dificult” or “disturbing” in most cases, and frequently
children who exhibit aggressive behaviors at school have been subjected to domestic violence.8
Bullying was also related to poor social perceptions. The victim is typically unsociable, insecure, passive, with-drawn, and has low self-esteem.7 Maybe these
partic-ular characteristics can inluence the victim’s choice.
The absence of reciprocity, a vital characteristic of bullying, can explain the preference of the aggressor for the most fragile victims. According to Debarbieux and Blaya,8 victim dificulties in interacting with peers,
physical disability and differences in physical appear-ance are factors that predispose the victim to intimida-tion. Furthermore, bullying can cause loss of interest in school, poor academic performance, and damaged social relationships.8 However, due to the similarity between risk
factors for and consequences of bullying, the characteris-tics of social interactions were not included in the adjusted analysis, although associated with bullying in univariate analysis and interrelated in exploratory analysis.
The prevalence of bullying was higher among those reporting life dissatisfaction and poor psychological well-being. In a study with 16,210 children between eight and 18 years, and their parents in 11 European countries, psychological problems were associated with bullying in almost all of them.1 Studies suggest that bullying may
lead to both behavioral and emotional problems.3
Bullying was most frequent among adolescents whose household heads were more educated. As educational attainment of the household head can be considered a marker of socioeconomic status, and these adolescents may have a greater awareness of bullying and more contact with technologies that facilitate other forms
of bullying, such as cyberbullying, not speciically
addressed in this study.
Geographic areas with less vulnerability, as measured
by the IVS, had a higher prevalence of bullying, which
was also seen among adolescents who were afraid of walking around their neighborhood. These character-istics could also serve as indicators of socioeconomic status. Bullying was reported more among adolescents with higher socioeconomic status. The higher
preva-lence among the more afluent could be attributed to
greater knowledge of the issue and access to media, which encourages reporting violence, contributes to the culture of fear, and even trivializes bullying by
Table 3. Adjusted and unadjusted prevalence ratios for the association between bullying and individual and contextual
characteristics. Beagá Health Study, Belo Horizonte, MG, Southeastern Brazil, 2008 to 2009.
Variable Unadjusted analysis Adjusted analysis
a,b
PR 95%CI p PR 95%CI p
Individual – Individual characteristics
In the past year, have you been involved in a fight in which someone has gotten hurt?
Yes 1.95 1.41;2.71 < 0.001 1.49 1.05;2.12 0.027
No 1.00 1.00
Life satisfaction
Dissatisfied 1.94 1.38;2.71 < 0.001 1.77 1.27;2.47 0.001
Satisfied 1.00 1.00
Contextual – Family and neighborhood characteristics I can discuss problems with my parents
No 2.02 1.49;2.75 < 0.001 1.85 1.37;2.50 < 0.001
Yes 1.00 1.00
Educational attainment of head of household (years)
> 8 1.62 1.17;2.22 0.003 1.71 1.26;2.31 0.001
≤ 8 1.00 1.00
Do you feel insecure in your neighborhood?
Yes 1.42 1.01;1.99 0.041 1.41 1.02;1.94 0.038
No 1.00 1.00
PR: prevalence ratio
a Adjusted for gender and age.
excessively exposing the adolescent to the theme; on the other hand, other manifestations of violence may interfere with the perception of bullying, making it seem less important in comparison for those adolescents with lower socioeconomic status.
The cross-sectional design of this study does not allow causal inference. Other limitations include: possible underreporting information bias because of household application of the questionnaire; cross-cultural differ-ences, varying interpretations of bullying; no temporal
speciications for the question used and, focus on the
object of study (victim, aggressor, or both). The greatest limitation could be the lack of a qualitative approach for deeper exploration of bullying motives. However, the adolescents had great ease with the questionnaires, the self-application was meant to provide privacy and
the sample size was suficient, with a power of 85.0% assuming a 95% conidence interval.
Despite these limitations, the study showed a high prev-alence of bullying and unveiled self-perception, family and home environment risk factors associated with this contemporary type of violence among adolescents. It allows advancing knowledge on bullying, especially in urban centers of developing countries.
Studies on bullying are relatively recent and present challenges. The finding that approximately 1/4 of adolescents in an urban center reported being victims
of bullying suggests that many children and adoles-cents are at risk of suffering from regular violence from peers. Individual and contextual characteristics found to be risk factors for bullying were obtained by
ques-tions that relected the percepques-tions of the participant.
Studies are needed to further explore gender differences and to explore bullying with a qualitative perspective.
Our indings support national and international studies
pointing to individual characteristics, peer relations,
and familial inluences as risk factors of bullying.17
Our study highlights, in an unprecedented manner, the importance of within and between household variables such parents’ relationship, self perceptions of neigh-borhood violence, and contextual neighneigh-borhood
vari-able based on the IVS. Territory can be understood as
a result of historical, environmental, and social factors that promote the production of health-related events. Under the urban health perspective, context indicators in epidemiological studies contribute to the under-standing of neighborhood factors and possible social determinants of health, such as violence.
This theme requires dialogue between the family and school, in addition to policies focusing on multidisci-plinary interventions for the reduction of bullying. Peer
bullying relects society’s tolerance to urban violence.
Studies to better understand bullying become important for supporting effective public health measures for the reduction of bullying and its consequences.
1. Analitis F, Velderman MK, Ravens-Sieberer U, Detmar S, Erhart M, Herdman M, et al. Being bullied: associated factors in children and adolescents 8 to 18 years old in 11 European countries. Pediatrics. 2009;123(2):569-77. DOI:10.1542/peds.2008-0323
2. Andrews FM, Whitey SB. Social Indicators of well-being: America’s perception of quality of life. New York: Plenum Press; 1976.
3. Boynton-Jarrett R, Ryan LM, Berkman LF, Wright RJ. Cumulative violence exposure and self-rated health: longitudinal study of adolescents in the United States. Pediatrics. 2008;122(5):961-70. DOI:10.1542/peds.2007-3063
4. Caiaffa WT, Ferreira AD, Oliveira CL, Camargos VP, Proietti FA. Saúde urbana: “a cidade é uma estranha senhora, que hoje sorri e amanhã te devora”. Cienc Saude Coletiva. 2008;13(6):1785-96. DOI:10.1590/S1413-81232008000600013
5. Câmara RA, Maciel RH, Gonçalves RC. Prevenção e combate ao assédio moral entre servidores públicos do estado do Ceará. Rev Bras Saude Ocup. 2012;37(126):243-55. DOI:10.1590/S0303-76572012000200006
6. Cantril H. The pattern of human concerns. New Brunswick: Rutgers University Press; 1967.
7. Cleave J, Davis MM. Bullying and peer victimization among children with special health care needs. Pediatrics. 2006;118(4):1212-9. DOI:10.1542/peds.2005-3034
8. Debarbieux E, Blaya C. Violência nas escolas e políticas públicas. Brasília (DF): UNESCO; 2002.
9. Duffy AL, Nesdale D. Peer groups, social identity, and children’s bullying behaviour. Soc Develop. 2009;18(1):121-39. DOI:10.1111/j.1467-9507.2008.00484.x
10. Friche AAL, Diez-Roux AV, César CC, Xavier CC, Proietti FA, Caiaffa WT. Assessing the Psychometric and Ecometric Properties of Neighborhood Scales in Developing Countries: Saúde em Beagá Study, Belo Horizonte, Brazil, 2008 2009. J Urban Health. 2012;90(2):246-61.
11. Galea S, Vlahov D. Handbook of urban health: population, methods, and practice. New York: Springer; 2005.
12. Kakeshita IS, Silva ANP, Zanatta DP, Almeida SS. Construção e fidedignidade teste-reteste de escalas de silhuetas brasileiras para adultos e crianças. Psicologia: Teoria e Pesquisa. 2009;25(2):263-70.
13. Lisboa C, Koller SH. Interações na escola e processos de aprendizagem: fatores de risco e proteção. In: Boruchovitch E, Bzuneck JA, editores. Aprendizagem: processos psicológicos e o contexto social na escola. Petrópolis: Vozes; 2004. p. 201-24.
Research supported by the Fundação de Amparo à Pesquisa do Estado de Minas (FAPEMIG – Process CDS-APQ-02669-10, CDS-APQ-02126-11 and CDS-APQ-00975-08), and by the Conselho Nacional de Desenvolvimento Científico e
Tecnológico (CNPq – Process 481113/2010-0).
Based on the master’s dissertation of Michelle Ralil da Costa, titled: “Bullying em adolescentes de um centro urbano brasileiro – Estudo ‘Saúde em Beagá’”, presented at Universidade Federal de Minas Gerais in 2012.
The authors declare no conflict of interest. 14. Malta DC, MAI Silva, FCM Mello. Bullying
nas escolas brasileiras: resultados da Pesquisa Nacional de Saúde do Escolar (PeNSE), 2009. Cienc Saude Coletiva. 2010;15(Suppl 2):3065-76. DOI:10.1590/S1413-81232010000800011
15. Malta DC, Porto DL, Crespo CD, Silva MMA, Andrade SSC, Mello FCM, et al. Bullying in Brazilian school children: analysis of the National Adolescent School-based Health Survey (PeNSE 2012). Rev Bras Epidemiol. 2014;17(Suppl 1):92-105. DOI:10.1590/1809-4503201400050008
16. Malta DC,Prado RR, Dias AJR, Mello FC, Silva MAI, Costa MR, et al. Bullying and associated factors among Brazilian adolescents: analysis of the National Adolescent School-based Health Survey (PeNSE 2012). Rev Bras Epidemiol. 2014;17(Suppl1):131-45. DOI:10.1590/1809-4503201400050011
17. Nansel TR, Overpeck M, Pilla RS, Ruan WJ,
Simons-Morton B, Scheidt P. Bullying behaviors among US youth: prevalence and association with psychosocial adjustment. JAMA. 2001;285(16):2094-100.
DOI:10.1001/jama.285.16.2094
18. Pepler D, Jiang D, Craig W, Connolly J.
Developmental trajectories of bullying and associated factors. Child Develop. 2008;79(2):325-38.
DOI:10.1111/j.1467-8624.2007.01128.x
19. Povedano A, Hendry LB, Ramos MJ, Varela R. Victimización escolar: clima familiar, autoestima y satisfacción con la vida desde una perspectiva de género. Psychosoc Interv. 2011;20(1):5-12. DOI:10.5093/in2011v20n1a1
20. Smith MK, Wood WB, Adams WK, Wieman C, Knight JK, Gulid N, et al. Why peer discussion improves student performance on in-class concept questions. Science. 2009;323(5910):122-4. DOI:10.1126/science.1165919
21. Smith PK, Cowie H, Olafsson RF, Liefooghe APD. Definitions of bullying: a comparison of terms used, and age and gender differences in a fourteen-country international
comparison. Child Dev. 2002;73(4):1119-33. DOI:10.1111/1467-8624.00461
22. Smokowski PR, Kopasz KH. Bullying in school: an overview of types, effects, family characteristics, and intervention strategies. Child Sch. 2005;27(2):101-11. DOI:10.1093/cs/27.2.101