Population-based study of the
epidemiology of diagnostic
test ordering
ABSTRACT
OBJECTIVE: To identify type of service, frequency, and individual patient determinants associated with diagnostic test ordering in medical appointments.
METHODS: A population-based study included 3,100 adults aged 20 years or older, living in the city of Pelotas, Southern Brazil. Sampling was carried out in multiple stages. Information were collected by means of a questionnaire, administered between October and December 2003. Multivariate analyses were carried out using Poisson Regression, based on a conceptual model. A sub-study was also conducted based on the test requests received during one workday in all laboratories in the city processing requests from both the public and private sectors.
RESULTS: Fifty-five percent of subjects reported having had medical appointments during the three-month period investigated. Of these, 60% reported more than one appointment, generating a total of 4,167 appointments, most of which were paid for by health plans (38%). Diagnostic test were requested in 55% of appointments. Women and diabetic patients were more likely to have tests ordered. The greater the age (p<0.001) the higher the socioeconomic level (p=0.04), and the number of medical appointments (p<0.001), the greater the proportion of appointments leading to test requests. Mean waiting time between test request and sample collection was six days for the private sector and 21 days for the public sector (p<0.001). The mean number of tests per request was 4.4.
CONCLUSIONS: The proportion of appointments leading to the request for some type of diagnostic test was in accordance with Brazilian recommendations. The waiting time before sample collection indicates an excessive number of tests per request and/ or insufficient financial resources to fulfill the demand for tests.
KEYWORDS: Diagnostics services. Diagnostics tests, routine, statistics and numerical data. Health services. Medical examination.
Marcelo F Capilheira
Iná S Santos
Programa de Pós-Graduação em Epidemiologia. Universidade Federal de Pelotas. Pelotas, RS, Brasil
Correspondence: Marcelo F. Capilheira
Av. Duque de Caxias, 250 3º andar 96030-002 Pelotas, RS, Brasil E-mail: [email protected]
INTRODUCTION
Diagnostic tests are intended to confirm the informa-tion obtained through anamnesis and physical ex-amination during the medical appointment. Test or-dering is influenced by factors related to characteris-tics of health care organization, physician, and pa-tient,1,14 and by the interaction between these groups.
Current health care technology offers an array of di-agnostic tests, which have become very popular
among patients and physicians.11 Even though these
tests have proven to be of great use, one must to con-sider certain risks, related not only to the procedure itself (e.g., allergic reaction to contrast media), but also to the practice of exaggerating in the number and indication of diagnostic tests. The latter include the financial cost to both patient and system; the anxiety generated by the possibility of an unfavora-ble outcome; the undervaluation of clinical exami-nation; the crowding of laboratories and other diag-nostic services due to excessive demand; delays in diagnosis in cases where clinical evidence would suf-fice; and finally, misdiagnosis, since diagnostic tests show varying proportions of positive and false-negative results.
This subject has been investigated by research groups from several countries, 3,4,8,15,16 and studies have focused on the reasons for test ordering, the conducts based on test results, and strategies for the reduction of unneces-sary testing. In Brazil, few studies address the subject directly. The extant data are either restricted to a very select population,9 or are concerned essentially with financial aspects.6 Data from the Brazilian Ministry of Health are also available, but these are restricted to the public network, and do not represent the universe of medical appointments and test orders.13
According to data from the Secretariat of Health of the municipality of Pelotas, Southern Brazil, the municipality’s primary network, comprising 50 healthcare units, provides in average 120 thousand appointments per month. The network’s referral out-patient facilities register a monthly average of 14 thou-sand appointments. Diagnostic tests are requested in about 50% of medical appointments. In one month, 55 thousand laboratory tests are performed, a propor-tion within the upper limit defined by the parameters of the Ministry of Health’s Sistema Único de Saúde (Unified Health System - SUS). According to these parameters, 30 to 50% of outpatient appointments should lead to laboratory test ordering.13
The above scenario indicates the need that health-care managers reflect about the issue and further
ac-quaint themselves with the factors involved in the apparently simple act of requesting diagnostic tests. Such acquaintance may be helpful for making deci-sions regarding the allocation of resources. The present study aims at clarifying some of these aspects, espe-cially those concerning patients.
METHODS
The municipality of Pelotas, located in the extreme South of Brazil, has 320 thousand inhabitants, 93% of which live in the urban area.10
We carried out a cross-sectional, population-based study of subjects aged 20 years or older. We excluded institutionalized persons or those incapable of re-sponding to the questionnaire used. Fieldwork took place between October and December 2003.
The following parameters were used to calculate sam-ple size: 10% prevalence of medical appointments and diagnostic test ordering; 95% confidence inter-val; and an acceptable error of 2 percentage points. A further 10% were added to cover potential losses. The sample size obtained was multiplied by 1.5 due to the design effect of using a cluster sample. Thus, the sample would require 1,425 subjects with medical appointments and test requests in the three-month period. Since the present study was conducted as a consortium involving other researchers, the final sam-ple exceeded the calculated samsam-ple size, leading to a sample with 95% power to detect prevalence ratios equal to or greater than 1.03.
Sampling was carried out in multiple stages, based on data from the 2000 Brazilian Population Census, con-ducted by the Instituto Brasileiro de Geografia e Estatística (Brazilian Institute for Geography and Sta-tistics).10 All 404 urban census sectors in the munici-pality were listed in decreasing order of mean income (head of household), and 144 sectors were systemati-cally drawn. In the following stage, all households of each selected sector were visited, and residential and commercial buildings were identified. Based on the list of households, we carried out a systematic random selection proportional to sector size, selecting about 10 households from each sector (n=1,530 households). The selected households were visited, and household members, after receiving information about the nature of the investigation, responded to questionnaires pre-viously tested in a pilot study carried out in a census sector excluded from the final sample.
qual-ity control purposes, about 10% of interviews were repeated by supervisors using a shorter version of the questionnaire for. Data were entered twice, and in-consistencies and amplitudes were checked using Epi Info v. 6.04 software.
Dependent variables were self-referred by subjects. Variables investigated were presence of medical ap-pointments in the three months preceding the inter-view, diagnostic test orders, and information on the types of tests requested in the last three places of appointment.
Independent variables included sex, age (complete years), schooling (complete years), skin color (classi-fied as white and nonwhite by the interviewer), mari-tal status (married or with partner; single or without partner; separated; partner deceased), and economic class. The latter was based on the classification pro-posed by the Associação Brasileira de Empresas de Pesquisa (Brazilian Association of Research Compa-nies - ABEP),* which divides subjects into classes A, B, C, D, and E, in decreasing order of wealth. For analysis purposes, this variable was recoded into classes AB, C, and DE, due to the small number of subjects in the extreme classes.
We also obtained information on health-related inde-pendent variables, including place and number of ap-pointments in the last three months, hospital admis-sions in the last year, physician-diagnosed Diabetes Mellitus (DM) or systemic arterial hypertension (SAH), smoking (smokers defined as those that smoked at least one cigarette a day for more than one month, and former smokers defined as those that had quit smoking for at least one month), and Body Mass Index (BMI) in kg/ m2. We also included self-perceived health status, di-vided into three categories: (1) excellent or very good; (2) good; and (3) regular or poor.
The following places of appointment were consid-ered: among public services, the Centro de Atenção Psicossocial (Centers for Psychosocial Care - CAPS), health centers, emergency rooms, hospital outpatient facilities, and university outpatient facilities. The CAPS are specific secondary health care facilities for patients with psychosocial diseases, and include psy-chiatrists, psychologists, social workers, and nurses. Services considered as private were divided into health plans, private appointments, and company or union outpatient facilities. The category “other places of appointment” included chemotherapy and radiotherapy clinics, emergency services of private clinics, and home visits. These places were not
in-cluded into the remaining categories due to the limi-tations of the questionnaire regarding the identifica-tion of the type of care provided (emergency care, chemotherapy or radiotherapy follow-up appoint-ments) or the nature of the service (public or private).
In the analysis of the types of tests ordered, patients with multiple tests were considered as a different group. The category “other types of test” included nuclear medicine, Pap smears, electroencephalo-grams, and electromyographies, among others.
Data on laboratory tests were obtained by means of a sub-study conducted in the municipality’s nine clini-cal analysis laboratories that receive requests from both the private and public sectors. The aim of this sub-study was to identify the laboratory tests most frequently ordered, the mean number of tests per re-quest, and the waiting time between the request and sample collection. Information were obtained from all test requests collected during a single workday between November 2003 and January 2004, after obtaining authorization from the laboratory manager.
The analysis model was constructed using the hierar-chical approach. Thus, the effect of each variable was controlled only for variables in the same or higher hierarchical levels. The first level of determination (most distal) comprised variables ‘sex, age, skin color, and number of appointments’. The latter was included in this level to avoid confounding, since subjects with more appointments would have greater prob-ability of having had a diagnostic test requested. The level immediately below (second level) comprised variables ‘schooling, marital status, and economic class’. The third level comprised variables ‘SAH, DM, BMI, and smoking’. The fourth level (most proximal) comprised variables ‘hospital admission in last year, and self-perceived health status’.
Since ours was a frequent outcome, we used Poisson regression for multivariate analysis,1 performed us-ing Stata v. 8.0 software. All analysis considered the clustered sampling design.
RESULTS
Losses and refusals amounted to 3.5%, leading to a total 3,100 interviewed subjects, of which 1,707 had had at least one medical appointment in the three months preceding the interview. This generated a to-tal 4,167 appointments. Of the appointments, 55.1% (95% CI: 53.6%-56.6%) led to the ordering of at least one diagnostic test. Regardless of the number of
pointments, tests were ordered for 67.6% of subjects with medical appointments.
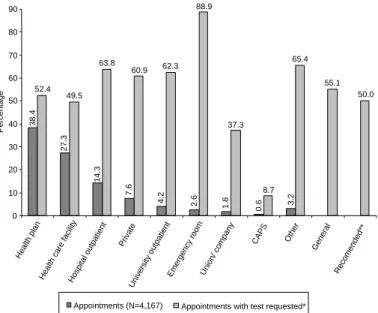
The most frequent places of appointment and the pro-portion of diagnostic test ordering are shown in Fig-ure 1. Regarding the type of service, 50.6% of ap-pointments took place in the public network. The pro-portion of appointments in the public and private networks resulting in test ordering were 56.4% and 53.2%, respectively (p=0.04).
Of the patients with more than one medical appoint-ment, 25.6% sought health care in more than one place. This proportion equaled 16.3% for patients with two appointments, 23.1% for patients with three appointments, and 41.7% for patients with four or more appointments. Patients with two or more ap-pointments and who had sought more than one health care provider showed a 13% higher crude probability of having had diagnostic tests requested (PR=1.13; 95% CI: 1.11-1.16).
Figure 2 shows the proportion of subjects reporting each or the diagnostic tests investigated. Irrespective of the number of appointments, most subjects (71.8%) reported the collection of blood samples.
Table 1 presents the results of the analysis of the asso-ciation between sociodemographic factors and diag-nostic test ordering. Women showed 3% higher
prob-ability of having tests ordered. Older age was also associated with greater number of test requests, showing a direct linear relationship with the outcome (p<0.001). There was also a linear association with economic class, with the probability of having tests requested in-creasing from poorer to wealthier classes. This relationship was very strong in crude analy-sis, but became weaker after adjustment, ap-proaching borderline significance. Marital status and skin color did not show associa-tions with test ordering. However, the latter was on the threshold for statistical significance (p=0.05) in crude and adjusted analyses.
Regarding health care aspects (Table 2), test ordering was significantly associated only with the number of appointments (p<0.001) and with DM diagnosis (p<0.001). Hospitali-zation in the last year or hypertension did not lead to greater test ordering. BMI and self-perceived health status showed linear as-sociations with the outcome only in crude analysis, the number of requests increasing as BMI increased and self-perceived health status worsened.
The results of the sub-study involving the city’s clini-cal analysis laboratories are presented in Table 3. Over one-half of test requests received by the laboratories included hemogram and fasting glucose. The major-ity of requests were from women (68.6%), and mean age was 42 years. The mean number of tests per re-quest was 4.4 (SD: 3.1). Rere-quests from the public network accounted for 59.7% of all orders (p<0.001). Mean number of tests per requisition was 4.9 in the public sector and 3.7 in the private sector (p<0.001). Mean waiting time between request and sample col-lection was six days for requests originating from the private sector and 21 days for those originating from the public sector (p<0.001).
DISCUSSION
Medical appointments have been the subject of study of many different authors, under various approaches related to financial aspects, demand, or usage.5,14 The present study, unlike those of other authors,3,8 pro-vides population-based data on the demand for diag-nostic tests generated by medical appointments, al-lowing for the identification of user-related factors.
The limitations of the present study include a poten-tial lack of precision due to poor recall, given that the inquired information was related to a three-month period; reverse causality, which is inherent to
cross-38.4
27.3
14.3
7.6
4.2 2.6
1.8 0.6 3.2
52.4 49.5
62.3
37.3
8.7 65.4
55.1 88.9
50.0 63.8
60.9
0 10 20 30 40 50 60 70 80 90
Health plan
Health care facilityHospital outpatient Private
University outpatient
Emergency room Union/ company
CAPS Other General
Recomended**
Percentage
Appointments (N=4,167) Appointments with test requested*
Ministério da Saúde. Portaria 1101/GM, de 12 de junho de 2002: parâmetros assis-tenciais do SUS. Available on-line from: http://dtr2001.saude.gov.br/sas/PORTARI-AS/Port2002/Gm-1101.htm [25 ago 2003].
Public sector includes health care facility, hospital outpatient, university outpatient, emergency room, and CAPS (Center for Psychosocial Care).
*Proportions considering the total number of appointments in each place of appointment **Recommendations of the Brazilian Ministry of Health for clinical pathology tests
sectional design; and the absence of an in-vestigation of the reasons for the appoint-ments, although the study was not designed to obtain such information.
The major limitation of the sub-study is the fact that information was collected during a single workday. Moreover, requests may vary according to the scheduling routine of each laboratory and to seasonal variation (vaca-tion periods, in which a percentage of physi-cians and patients may have been away from home). However, the proportion of women in the sub-study (69%) and in the population-based sample (66.4%) were similar (p=0.3), indicating consistency of information. The same is observed with the proportion of tests generated by the public sector: 59.7% in the sub-study and 55.1% in the population-based sample (p=0.06). Another limitation was the failure to cover all of the city’s labo-ratories (only those providing services to both
the public and private sectors were included), which gave us only a partial view of the municipal scenario.
The prevalence of medical appointments found in the present study was similar to that reported by Dias da Costa & Facchini5 (1997) for the same city in 1992
(56.5%). A study conducted in Spain8 using
second-ary data estimated a frequency 54.5 medical
appoint-ments per 100 inhabitants/year, and a rate of 5.6 test requests/100 appointments/year. Comparatively, the present results indicate a higher percentage (55.1% in three months) although study design and the level of healthcare differed between the two studies.
In Pelotas, about one-half of appointments led to re-quests for some sort of diagnostic test. This is similar 71.8
44.0
33.7
20.3
5.2 4.0 2.4 2.0 1.6 13.8
0 10 20 30 40 50 60 70 80
Blood Urine X-ray ECG
Biopsy UDE NMR
Colonoscopy Others
Percentage
Subjects with tests requested (N=1,154)* CAT
ECG: Electrocardiogram; UDG: Upper Digestive Endoscopy; CAT: Computer aided tomography; NMR: Nuclear Magnetic Resonance.
*Patients for which more than one type of test was ordered, or for which the same test was ordered in different places were considered as different subjects for the calculation of proportions
Figure 2 - Types of tests requested for subjects with at least one medical appointment in the three months preceding the interview and whose appointment(s) generated at leas one diagnostic test request. Pelotas, Brazil, 2003.
Table 1 - Socioeconomic and demographic description of subjects with medical appointments (%), according to prevalence of diagnostic test requests (P) and crude and adjusted prevalence rations (N=1,707). Pelotas, Brazil, 2003.
Variable Crude analysis Adjusted analysis*
% P (%) PR (95% CI) p PR (95% CI) p
Sex 0.001** 0.03****
Male 33.6 62.1 1.00 1.00
Female 66.4 70.4 1.05 (1.02-1.08) 1.03 (1.00-1.06)
Age (complete years) <0.001*** <0.001***
20-29 21.9 54.3 1.00 1.00
30-39 18.4 63.4 1.06 (1.01-1.11) 1.06 (1.02-1.11)
40-49 23.2 70.7 1.11 (1.06-1.15) 1.10 (1.06-1.15)
50-59 16.7 78.7 1.16 (1.11-1.21) 1.14 (1.10-1.19)
60 + 19.8 73.3 1.12 (1.07-1.18) 1.10 (1.05-1.15)
Schooling (years) 0.5*** 0.2***
0 7.4 66.1 1.00 1.00
1-4 18.2 72.8 1.04 (0.98-1.11) 1.06 (1.00-1.12)
5-8 32.3 64.3 0.99 (0.93-1.05) 1.03 (0.97-1.09)
9-11 25.8 62.6 0.98 (0.92-1.04) 1.04 (0.98-1.11)
12 + 16.3 77.0 1.07 (1.00-1.13) 1.08 (1.01-1.15)
Economic class (ABEP) <0.001*** 0.04***
D/E 39.7 64.4 1.00 1.00
C 32.3 66.1 1.01 (0.98-1.04) 1.01 (0.98-1.05)
A/B 28.1 73.8 1.14 (1.06-1.23) 1.04 (1.00-1.08)
Skin color 0.05** 0.05****
White 81.7 68.8 1.00 1.00
Nonwhite 18.3 62.5 0.96 (0.93-1.00) 0.96 (0.93-1.00)
Marital status 0.004**** 0.6****
Married 64.2 68.6 1.00 1.00
Single 18.6 59.9 0.95 (0.91;0.99) 0.99 (0.95;1.03)
Separated/ partner
deceased 17.2 72.4 1.02 (0.99;1.06) 0.99 (0.95;1.02)
*Analysis adjusted for variable in the same and higher levels **Chi-square test
*Ministério da Saúde. Portaria 1101/GM, de 12 de junho de 2002:Parâmetros Assistenciais do SUS. Available online from http:// dtr2001.saude.gov.br/sas/PORTARIAS/Port2002/Gm-1101.htm [25 Aug 2003]
to the proportion of appointments that should gener-ate laboratory tests according to Ministry of Health
recommendations,*(p=0.3), although these
recom-mendations include other types of tests. Nationwide data generated by SUS13 show that, in Brazil, between 52% and 76% of appointments lead to test ordering.
Regarding the place of appointment, emergency rooms showed the greatest proportion of test order-ing, possibly due to tests performed on location. These were followed by hospital outpatient facilities, university outpatient facilities, private clinics, and “others”, which did not differ significantly among themselves. The proportion of appointments gener-ating test requests was similar regardless of whether the appointment took place in public primary health centers or if it was covered by health plans (p=0.1), both values being within the parameters recommended by the Ministry of Health. The prevalence of test or-dering observed in hospital and university outpatient facilities may be related to the greater complexity of the health care provided at these facilities.
The greater proportion of test requests in the public system (56.4%) when compared to the private sector is possibly due to tests requested during emergency care. Moreover, even though the difference between the two sectors is significant, from the perspective of service management and planning this difference is to small to be of any practical relevance.
The types of tests most frequently requested were clinical analyses (blood and urine), in proportions similar to those reported in the public healthcare sys-tem’s official database.13
The high proportion of requests by health service users may be related to the exaggerated use of medi-cal appointments, or to the fact that physicians may be evaluating patients by means of serial tests (one type of test per appointment). It should be noted, how-ever, that the process of medical care often involves long periods of follow-up. In this case, one appoint-ment would generate the test request, and the next appointment would be dedicated to evaluating the results obtained, incorporating findings into the
di-Table 2 - Description of health-related variables for subjects with medical appointments, prevalence of diagnostic test requests (%), and crude and adjusted prevalence ratios (N=1,707). Pelotas, Brazil, 2003.
Variable Crude analysis Adjusted analysis*
% P (%) PR (95% CI) p PR (95% CI) p
Hospital admission in previous year 0.01** 0.6****
No 86.4 66.6 1.00 1.00
Yes 13.6 74.1 1.05 (1.01;1.08) 0.99 (0.96;1.02)
BMI (kg/m2)***** 0.04*** 0.9***
<18.5 2.3 74.3 1.00 1.00
18.5-24.9 49.0 65.5 0.95 (0.87;1.03) 0.91 (0.84;0.99)
25-29.9 32.5 69.8 0.97 (0.90;1.06) 0.92 (0.85;1.01)
≥30 16.2 72.8 0.99 (0.91;1.08) 0.92 (0.84;1.01)
Smoking 0.1**** 0.3****
Never 51.9 67.3 1.00 1.00
Smoker 23.8 64.5 0.98 (0.95;1.02) 0.99 (0.96;1.02)
Former smoker 24.3 71.3 1.02 (0.99;1.06) 1.02 (0.99;1.05)
Health perception <0.001*** 0.2***
Excellent/ very good 24.4 62.7 1.00 1.00
Good 43.0 63.0 1.00 (0.97;1.04) 0.99 (0.96;1.02)
Regular/poor 32.6 77.4 1.09 (1.05;1.13) 1.03 (0.99;1.07)
Self-reported DM <0.001** <0.001****
No 91.9 65.9 1.00 1.00
Yes 8.1 87.0 1.13 (1.09;1.17) 1.08 (1.04;1.12)
Self-reported SAH <0.001** 0.5****
No 71.2 64.5 1.00 1.00
Yes 28.8 75.4 1.07 (1.04;1.09) 1.01 (0.98;1.04)
No. of medical appointments <0.001*** <0.001***
1 40.5 50.7 1.00 1.00
2 24.8 70.1 1.13 (1.09;1.17) 1.12 (1.08;1.16)
3 17.8 82.5 1.21 (1.17;1.26) 1.19 (1.15;1.24)
4 + 16.9 88.9 1.25 (1.21;1.30) 1.24 (1.20;1.29)
DM: Diabetes Mellitus; SAH: Systemic Arterial Hypertension; BMI: Body Mass Index
*****BMI was not calculated for 207 subjects due to lack of information on weight and/or height
Table 3 - Types of laboratory tests most frequently performed in a sample of test requests (N=529) from one workday of clinical analysis laboratories. Pelotas, Brazil, 2003.
Type of test %
Hemogram 59.2
Fasting blood glucose 52.9
Common urine test 42.7
Total cholesterol or total cholesterol and fractions 38.6
Triglycerides 37.2
Total cholesterol and fractions 24.4
Creatinine 23.3
Total cholesterol 14.2
Thyroid-stimulating hormone 12.7 Urine culture + antibiogram 12.5 Erythrocyte sedimentation rate 11.9 Common urine test + urine culture + antibiogram 11.5
Uric acid 11.3
agnosis process, and to defining the treatment regime to be adopted.
A third hypothesis is that a fair share of these tests may actually be for the same patients, but requested from different laboratories. The importance of test repetition has been emphasized a North American study,2 which found 28% prevalence of tests repeated before the recommended time interval in
hospital-ized patients. A Dutch study3 found 38% prevalence
of test repetition in an eight-month period among outpatients. Approximately 35% of repeated tests were requested by a different physician than that which requested the initial test.
A fourth possibility is that some patients may have needed appointments in more than one place in order to obtain a request for a given test. This hypothesis is supported by the fact that number of appointments was the independent variable most strongly associ-ated to the outcome.
Given the strong association between test ordering and the number of medical appointments, the entire analysis was controlled for the latter variable. The sociodemographic factors that remained associated with the outcome after adjusted analysis were female gender, older age, and higher socioeconomic status. The results of a Spanish study8 showed that test re-quests for women accounted for 60.1% of the sample.
Another study3 indicated greater test ordering for
older subjects.
Of the health-related characteristics investigated, only diagnosed DM showed a significant association with the outcome. This is probably related to the greater number of appointments required for diabetes patients. Furthermore, current Ministry of Health guidelines rec-ommend laboratory control every three months for patients with stable diabetes and at shorter intervals for those with uncontrolled disease.* This hypothesis is supported by the results of the sub-study, which in-dicated fasting blood glucose as the second most re-quested test. Another study reported fasting blood glu-cose as the most commonly requested test in a sample of about 40 thousand test requests.3 Similar results were not found for SAH, possibly because laboratory con-trol is recommended on a yearly basis.7
The types of tests most frequently requested were those recommended for the diagnosis and/or
follow-up of patients with DM and/or SAH.8 However, most
requests included a hemogram, which is unusual, since hemograms are not included in any of the test protocols. A Dutch study4 showed no requests for
com-plete hemograms, only for its separate fractions. This leads to the question of whether physicians would be ordering tests based on evidence or only following a “routine test ritual”.
The findings of our sub-study were similar to those reported in the literature. Women accounted for most
of the requests (60.1% in the Spanish study8 and
68.6% in the present study). The mean number of tests per request was eight in the Spanish study and four in the present study.
The difference in mean waiting time between test re-quest and sample collection between the private and public sectors (six and 21 days, respectively) may be explained by the logistics of the financing system. The allocation of public resources for diagnostic tests to laboratories associated to SUS is based on a monthly limit (information obtained from the man-agers of each of the laboratories visited). In this sys-tem, when a laboratory meets the upper limit defined by the government, i.e., when the demand for tests is greater than the available resources, patients are ori-ented to schedule their tests for the following month. The excess tests may be a consequence either of ex-aggerated test ordering or of an exceedingly low fi-nancial limit.
Another possibility is that the period between hav-ing the appointment and seekhav-ing a laboratory for the test may differ between patients of the private and public sectors. Public sector users may be financially restricted with respect to transportation, even within the urban area.
Since the proportion appointments leading to test requests is within the parameters recommended by the Brazilian Ministry of Health, we can only con-clude that the number of tests incon-cluded in each re-quest is likely to be excessive. The Ministry of Health does not establish a limit for the number of test per request, which may a be desirable measure.
The data in the present study do not allow for an evaluation of the number of tests per request, but given the excessive waiting time for sample collection, we question the financial limit defined for fulfilling the demand generated by the public sector.
Finally, we indicate the need for further investigation aimed at evaluating the different factors involved in the complex causal network behind diagnostic test ordering. This is important for both the patient, who is exposed to risk and suffers the adverse effects of testing,11,12 and for the healthcare system. The
tative adequacy of test ordering in Pelotas is at odds with the long waiting time for the actual performance of tests within the public sector. The definition of a limit for the number of tests per request by health authorities would be desirable. This limit should be supported by strong evidence regarding its adequacy.
REFERENCES
1. Barros AJ, Hirakata VN. Alternatives for logistic regression in cross-sectional studies: an empirical comparison of models that directly estimate the preference ratio. BMC Med Res Methodol. 2003;3(1):21-34.
2. Bates DW, Boyle DL, Rittenberg E, Kuperman GJ, Ma’Luf N, Menkin V, et al. What proportion of common diagnostic tests appear redundant. Am J Med. 1998;104(4):361-8.
3. Branger PJ, Van Oers RJ, Van der Wouden JC, Van der Lei J. Laboratory services utilization: a survey of repeat in investigations in ambulatory care. Neth J Med. 1995;47(5):208-13.
4. Cohen O, Hahan E, Zalewski S, Kitai E. Medical investigations requested by patients: how do primary care physicians react? Fam Med. 1999;31(6):426-31. 5. Costa JSD, Facchini LA. Utilização de serviços
ambulatoriais em Pelotas: onde a população consulta e com que freqüência. Rev Saúde Pública.
1997;31(4):360-9.
6. Costa JSD, Fuchs SC, Olinto MTA, Gigante DP, Menezes AMB, Macedo S, et al. Cost-effectiveness of hypertension treatment: a population-based study. Rev Paul Med. 2002;120(4):100-4.
7. Duncan BB, Schmidt MI, Giugliani ERJ. Medicina ambulatorial: condutas clínicas em atenção primária. Porto Alegre: Artes Médicas; 1996.
8. Gracia Gomis MC, Pérez Royo A, Hernández Aguado I, Berbegal J, Arrese R. Análisis de la deman-da de pruebas de laboratorio desde atención primaria en un área de salud. Aten Primaria. 1999;23(1):26-31. 9. Halal IS, Sparrenberger F, Bertoni AM, Ciacomet C,
Seibel CE; Lahude FM, et al. Avaliação da qualidade de assistência primária à saúde em localidade urbana da região sul do Brasil. Rev Saúde Pública.
1994;28(2):131-6.
10. Instituto Brasileiro de Geografia e Estatística – IBGE. Censo Demográfico 2000. Rio de Janeiro; 2001. 11. Kloetzel K. Usos e abusos de exame complementar.
Diagn Tratamento. 2001;6(4):19-27.
12. McDonald IG, Daly J, Jelinek VM, Panetta F, Gutman JM. opening Pandora’s box: the unpredictability of reassuranke by a normal test result. BMJ. 1996;313(7053):329-32.
13. Rede Interagencial de Informações para a Saúde -RIPSA. Indicadores básicos de saúde no Brasil: conceitos e aplicações. Brasília (DF): Organização Pan-Americana de Saúde; 2002.
14. Sackett D, Haynes RB, Guyatt GH, Tugwell P. Clinical epidemiology: a basic science for clinical medicine. Ontario: Little, Brown; 1991.
15. Sherwood P, Lyburn I, Brown S, Ryder S. How are abnormal results for liver function tests dealt with in primary care?: audit of yield and impact. BMJ. 2001;322(7281):276-8.
16. Van der Weijden T, Van Velsen M, Dinant GJ, Van Hasselt CM, Grol R. Unexplained complaints in general practice: prevalence, patients’ expectations, and professionals’ test-ordering behavior. Med Decis Making. 2003;23(3):226-31.
∗Ministério da Saúde. Programa Saúde da Família. Brasília (DF); 2001.
*MFC received a fellowship grant from Coordenação de Aperfeiçoamento de Pessoal de Nível Superior (CAPES). Based on the Master’s dissertation presented at the Universidade Federal de Pelotas in 2004.
We therefore reinforce the need for studies to further investigate this issue and for the rapid adoption of health policies aimed as making it easier for patients to use a single facility. The Programa de Saúde da
Família (Family Health Program),∗ may provide an