RBCDH
Licence Creative Commom
CC
Self-reported physical activity and food
intake patterns in schoolchildren aged 7-10
from public and private schools
Peril de atividade física e consumo alimentar
autorrelatado de escolares de 7 a 10 anos da rede
pública e privada
Filipe Ferreira da Costa1
Maria Alice Altenburg de Assis1,2
Abstract– Physical activity and diet are related to several health outcomes. he aim of this study was to analyze physical activity (PA) and diet patterns among Brazilian schoolchildren attending private or public schools. A cross-sectional, school-based study of elementary schoolchildren aged 7-10 years old (n = 2,936) was carried out in Florianopolis (southern Brazil). Self-reported food consumption and PA patterns were assessed by means of a questionnaire. A higher percentage of girls than boys met the rec-ommendations for consumption of fruits and vegetables and limited their consumption of sweets and sot drinks. Boys reported higher PA levels than girls (P < 0.001). Children attending private schools were more likely to be in the highest tertile of PA (odds ratio = 1.53, 1.14-2.05) and 80% less likely to be active in commuting to school compared to public school students. Private schoolchildren were more likely to meet recommendations for fruits and vegetables, limit sweet consumption, report adequate meal frequency and no consumption of fast food or sot drinks. In summary, girls and private schoolchildren reported better eating patterns, while boys and private schoolchildren reported higher PA levels. Such results highlight the public school setting as a target for health promotion initiatives, along with other strategies, in developing countries.
Key words: Child; Diet; Health behavior; Health promotion; Physical activity.
Resumo– A atividade física e o consumo alimentar estão associados a vários desfechos de saúde. O objetivo do presente estudo foi investigar as diferenças no comportamento alimentar e na atividade física de escolares brasileiros da rede pública e privada. Um estudo trans-versal de base escolar, com crianças entre 7 e 10 anos, foi realizado em Florianópolis, SC, Brasil (n = 2.936). As informações foram obtidas por meio de um questionário respondido pelas próprias crianças. Maior proporção de meninas alcançaram as recomendações para o consumo de frutas e vegetais e limitaram o consumo de doces e refrigerantes. Os meninos relataram maiores níveis de atividade física (P < 0,001). Escolares da rede privada tiveram maior chance de serem mais ativos (Odds Ratio = 1,53, 1,14-2,05) e 80% menos chance de serem ativos no deslocamento para a escola; além disso, tiveram maior chance de atender as recomendações para o consumo de frutas e verduras, limitar o consumo de doces, apresen-tar número adequado de refeições e não consumir fast food e refrigerantes. Resumindo, as meninas e os escolares da rede privada relataram melhores padrões de consumo alimentar, enquanto os meninos e os escolares da rede privada foram mais ativos. Tais resultados
1 Universidade Federal de Santa Catarina. Programa de Pós--graduação em Educação Física. Florianópolis, SC. Brazil
2 Universidade Federal de Santa Catarina. Programa de Pós-gradu-ação em Nutrição. Florianópolis, SC, Brazil
Food intake and physical activity in schoolchildren Costa & de Assis
INTRODUCTION
Physical activity (PA) and eating behaviors are of particular public and research interest because they encompass common daily activities. In addi-tion, these behaviors have the potential to be modiied, thereby decreasing health care costs, improving health and well-being, and reducing the risk of chronic diseases such as obesity and related metabolic disorders. Although obesity has a multifactorial origin, physical inactivity and unhealthy diet have been postulated as important determinants of obesity in both adults and youths1, given that its increased prevalence has paralleled the rapid
lifestyle changes of the population in the modern world. Furthermore, they are considered target behaviors for youth health promotion aimed at preventing obesity, diabetes and other cardiovascular risk factors2,3.
Several studies have examined children’s and adolescents’ compliance with recommended patterns of food intake and PA4,5. Correlates of diet and
PA patterns (e.g. age, gender, socioeconomic status) have been investigated to support public health policies5-9. here is evidence that higher PA levels
and better eating patterns are related to higher socioeconomic and edu-cational levels in adults10,11; however, this subject has not been extensively
addressed in pediatric populations in developing countries. Further, few studies have assessed diferences in food habits and PA levels according to type of school12-14. his topic is of utmost interest, given that type of
school (private vs. public) is related to socioeconomic level in developing countries and that government policies primarily target economically disadvantaged individuals.
he aim of this study was to present data on PA and eating patterns in a representative sample of 7 to 10-year-old children attending public or private schools, in order to improve knowledge about diferences in chil-dren’s health behaviors according to type of school, and to discuss health policies to tackle obesity-related behaviors.
METHODS
Subjects were participants in the study entitled “Prevalence of overweight and lifestyle factors associated with nutritional status in schoolchildren”, a cross-sectional survey conducted in Florianopolis (southern Brazil). Details of the study design have been described elsewhere15. In brief, a
committee of the Federal University of Santa Catarina (Protocol 037/02). Physical activity and food intake habits were assessed by a structured and illustrated tool designed for children aged between seven and ten16. he
questionnaire was previously validated with a sample of Brazilian children and can be used for ranking participants on usual PA, as well as food and meal patterns16. Test-retest analysis showed moderate agreement among
children from other Brazilian region17. In the present study, the
question-naire was administered as a classroom activity. Two researchers, with the assistance of the classroom teacher, asked the children to provide infor-mation on physical activity and food choices on a typical day of the week. Instructions were read aloud to the entire class and cues (e.g. deinition of a typical day of the week) were given to prepare children for the assignment.
In the physical activity section of the questionnaire16, children were
asked to report how they commuted to school, based on ive options (on foot, by bicycle, motorcycle, car or bus), and their physical activities, accord-ing to 11 predeined drawaccord-ings of common daily activities (walkaccord-ing/runnaccord-ing, playing with a dog, cycling, swimming, playing ball games, jumping rope, athletics, climbing stairs, roller skating/blading, dancing and helping with household chores), displayed in three categories of intensity (low, moder-ate or intense). Commuting to school was dichotomized into active (on foot and/or by bicycle) or passive (by car and/or bus and/or motorcycle). Weights were assigned to obtain an overall PA score, as follows: one for light, three for moderate and nine for vigorous activities (maximum score = 143 points), similar to another study conducted with 4th grade children18.
In the food intake section of the questionnaire16, children were asked
to detail their habitual food consumption at ive daily eating occasions that were chronologically ordered (breakfast, mid-morning snack, lunch, aternoon snack, and dinner), based on 21 drawings of selected foods or food groups. he 21 selected foods or food groups consisted of dried beans, rice, milk, chocolate milk, yoghurt, cheese, beef, poultry, pasta, crackers, bread, French fries, pizza, hamburger, eggs, fruits, fruit juices, vegetables, sweets, ish/sea foods, and sot drinks.
For each food, food group, and beverage, the frequency of consumption (times per day) was calculated by adding reported consumption over ive daily eating occasions. he foods and beverages illustrated in the question-naire were categorized into eight groups in order to assess compliance with Brazilian Food Guidelines (BFG)19 for the recommended daily consumption
Food intake and physical activity in schoolchildren Costa & de Assis
of a healthy diet: fast food (French fries, hamburger/pizza) and sot drinks: = 0 time/day. Since food recommendation guidelines are stated in servings per day, it was assumed that each food reported consisted of one serving.
Additionally, food patterns were assessed in terms of meal composition. Frequency of consumption of a healthy and structured meal at the main eating occasions (breakfast, lunch and dinner) was classiied into three categories (none, once, and two or more times per day). Healthy meals were considered to contain three diferent food groups with high nutrient density [starchy food (rice, dry beans, bread or crackers, pasta), fruits/ vegetables, and animal protein (beef/poultry, ish/sea foods, eggs, milk, chocolate lavoured milk, cheese, yoghurt)] but could include other food items. Healthy snacks at mid-morning and mid-aternoon were those that included at least one food group with high nutrient density. his approach is based on the Food-based classiication of eating episodes20, adapted to
the Brazilian context21. With regard to meal frequency, compliance with
BFG was achieved when the child reported three healthy meals and two healthy snacks.
Parents reported family monthly income, which was classiied in six levels of minimum wage ranges for analysis purposes. Since about 20% of the data were missing, we opted to use type of school (public or private) as a proxy of socioeconomic status. Furthermore, this approach can relect both the socioeconomic status of the family and social and environmental aspects inherent to schools.
he proportion of children meeting the minimum recommendation for a speciic food group and the number of healthy meals and snacks was compared between boys and girls and between public and private schools using Pearson’s chi-square test. Similarly, active commuting to school and tertiles of the PA score were compared between genders and types of school. Multiple logistic regression analysis was applied to evaluate the extent to which dietary pattern (compliance of eight food groups with BFG – yes/ no), the best PA level (highest tertile of PA score vs. lowest plus middle), and active commuting to school (yes/no) – as dependent variables – were associated with type of school (private vs. public), as independent variable. Since the majority of such associations were mediated by gender, PA score, age, and body mass index, models were adjusted for these variables. All esti-mates took into account the clustering sample design in the complex sample function of SPSS version 15.0. he signiicance level was set at P < 0.05.
RESULTS
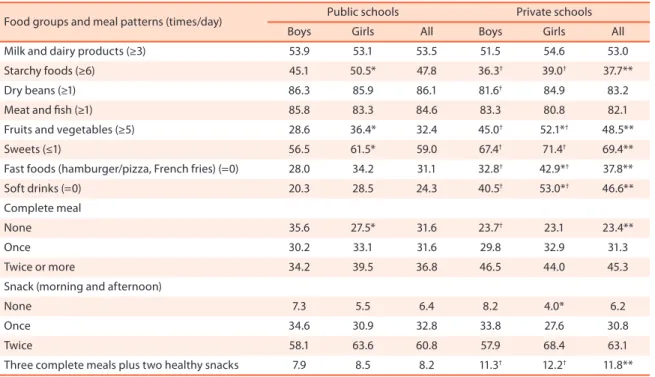
Table 1 shows food choices and meal patterns of the schoolchildren according to type of school and gender. As a rule, girls and children from private schools reported healthier eating habits. A signiicantly higher percentage of private schoolchildren met recommendations for fruits/veg-etables and limited consumption of sweets, whereas public schoolchildren reported a higher frequency of eating starchy foods six or more times a day. Fewer public schoolchildren reported no fast food or sot drink consump-tion compared to children from private schools.
About a quarter of public and 46% of private schoolchildren reported no sot drink consumption. A greater proportion of schoolchildren from private schools reported eating healthy and structured meals twice or more a day compared to public schoolchildren; however, the proportion of children eating a meal lacking one of the basic food groups ranged from 23.1 to 35.6% across all groups. A slightly greater proportion of children from private schools reported eating three healthy and structured meals and two healthy snacks, but overall the frequency was quite low (about 10%). All diferences found between types of school were also found when comparing children from the same sex across the diferent types of schools.
Diferences between genders within the same type of school were higher for the consumption of fruits and vegetables, fast foods, and sot drinks (P < 0.05). Compared to boys, girls (especially those from public schools) reported more frequent consumption of fruits and vegetables at least ive times a day. Further, a higher proportion of girls reported the absence of fast food or sot drink consumption compared to boys.
Table 1. Frequencies (%) of food choices and meals patterns reported by children, according to type of school and gender
Food groups and meal patterns (times/day) Public schools Private schools Boys Girls All Boys Girls All Milk and dairy products (≥3) 53.9 53.1 53.5 51.5 54.6 53.0 Starchy foods (≥6) 45.1 50.5* 47.8 36.3† 39.0† 37.7**
Dry beans (≥1) 86.3 85.9 86.1 81.6† 84.9 83.2
Meat and ish (≥1) 85.8 83.3 84.6 83.3 80.8 82.1
Fruits and vegetables (≥5) 28.6 36.4* 32.4 45.0† 52.1*† 48.5**
Sweets (≤1) 56.5 61.5* 59.0 67.4† 71.4† 69.4**
Fast foods (hamburger/pizza, French fries) (=0) 28.0 34.2 31.1 32.8† 42.9*† 37.8**
Soft drinks (=0) 20.3 28.5 24.3 40.5† 53.0*† 46.6**
Complete meal
None 35.6 27.5* 31.6 23.7† 23.1 23.4**
Once 30.2 33.1 31.6 29.8 32.9 31.3
Twice or more 34.2 39.5 36.8 46.5 44.0 45.3
Snack (morning and afternoon)
None 7.3 5.5 6.4 8.2 4.0* 6.2
Once 34.6 30.9 32.8 33.8 27.6 30.8
Twice 58.1 63.6 60.8 57.9 68.4 63.1
Three complete meals plus two healthy snacks 7.9 8.5 8.2 11.3† 12.2† 11.8**
Food intake and physical activity in schoolchildren Costa & de Assis
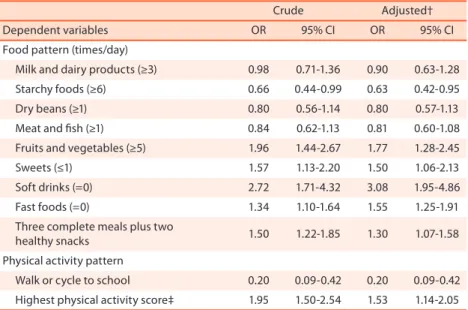
Children attending private schools were associated with a signiicantly decreased likelihood of eating starchy food ≥ 6 times per day compared to public schoolchildren. Reported intake of fruits and vegetables ≥ 5 times per day, sweets ≤ 1 time per day, and absence of fast food and sot drinks were more common among schoolchildren from private schools. Students attending private schools were three times more likely to report no sot drink consumption. (Table 2).
Table 2. Efect of attending private school* on recommended food and physical activity patterns
Crude Adjusted† Dependent variables OR 95% CI OR 95% CI Food pattern (times/day)
Milk and dairy products (≥3) 0.98 0.71-1.36 0.90 0.63-1.28 Starchy foods (≥6) 0.66 0.44-0.99 0.63 0.42-0.95 Dry beans (≥1) 0.80 0.56-1.14 0.80 0.57-1.13 Meat and ish (≥1) 0.84 0.62-1.13 0.81 0.60-1.08 Fruits and vegetables (≥5) 1.96 1.44-2.67 1.77 1.28-2.45 Sweets (≤1) 1.57 1.13-2.20 1.50 1.06-2.13 Soft drinks (=0) 2.72 1.71-4.32 3.08 1.95-4.86 Fast foods (=0) 1.34 1.10-1.64 1.55 1.25-1.91 Three complete meals plus two
healthy snacks 1.50 1.22-1.85 1.30 1.07-1.58 Physical activity pattern
Walk or cycle to school 0.20 0.09-0.42 0.20 0.09-0.42 Highest physical activity score‡ 1.95 1.50-2.54 1.53 1.14-2.05
*Reference category: public school. †Food pattern: adjusted for gender, physical activity score, age and body mass index (BMI) as covariates; Physical activity pattern: adjusted for gender, age and BMI as covariates. ‡Reference category: lowest plus middle tertile of physical activity score
Active commuting to school was more common among children from public than from private schools. However, about 40% of children from private schools were in the highest tertile of PA compared to 30.3% of those from public schools. Boys were more active than girls in both types of school, with greater diferences in public schools. Over half of the girls from public schools were categorized in the lowest tertile of the PA score compared to only 23.8% of boys (Table 3). Children attending private schools were 80% less likely to be active in commuting to school compared to children from public schools, but they were 53% more likely to be in the highest tertile of the PA score compared to public schoolchildren (Table 2).
Table 3. Physical activity patterns reported by children according to type of school and gender
Public schools Private schools Physical activity patterns Boys Girls* All Boys Girls* All† Active commuting (%) 62.4 62.0 62.2 22.9 26.0 24.4‡ Physical activity score (%)
Lowest 23.8 53.8‡ 38.6 19.1 28.7‡ 23.8‡
Middle 34.0 28.2 31.1 32.6 40.9 36.7
Highest 42.2 18.0 30.3 48.3 30.4 39.5
In the present study, we compared data on food consumption, meal pat-terns, and PA levels between schoolchildren from public and private schools. Children from private schools had better overall eating habits and higher PA levels than public schoolchildren, whereas public schoolchildren were more active in commuting to school. Although not directly compara-ble to other studies, due to the nature of assessment and categorization of PA and eating behavior, our results corroborate previous studies carried out with Brazilian adults10,11 and the few investigations that compared health
behavior across type of school4,5,13.
In developing countries such as Brazil, attending private schools is a privilege of the wealthy rather than a choice made by parents. It is therefore not surprising that most food guideline recommendations were met more frequently among private schoolchildren. Both parents’ education levels and the availability of wholesome foods at home are important correlates of healthy eating habits, and could therefore explain the better eating pat-tern among this group6,7. Since interventions in the family setting would
be more costly and require a broad strategy, several Brazilian government initiatives have targeted the school environment in order to promote healthy eating among youths.
he present study showed that boys reported lower habitual consump-tion of healthy foods such as fruits and vegetables and higher consumpconsump-tion of ‘unhealthy’ food items such as sweets, fast foods, and sot drinks in comparison with girls. here is no Brazilian data available for the age range of our study, and the only national survey of adolescent (13 to 15 yr-old) health showed contrasting results, since girls reported worse eating habits than boys22. Similarly, Olivares et al.23 found that 8-9-yr-old Chilean girls
reported higher intake of fruits and vegetables compared to boys, while boys consumed higher levels of dairy products and fruits and vegetables at older ages. On the other hand, studies based on the Health Behavior in
School Aged Children (HBSC) survey have consistently found that
adoles-cent girls (11, 13 and 15 yrs old) exhibit better eating habits than boys24.
Diferences in food choices among young adults are partially explained by dieting status and health beliefs25.
Food intake and physical activity in schoolchildren Costa & de Assis
these results are in line with a large study involving adolescents from 32 countries in the HBSC survey, in which lower socioeconomic levels, based on family resources, were associated with not meeting 60 minutes of moderate-to-vigorous PA at least ive days per week5. A study among
young Brazilian adolescents found that leisure-time physical activities and in-school and out-of-school activities were associated with higher socioeconomic levels13.
On the other hand, children from public schools were twice as active in commuting to school compared to private school children. Rather than a choice based on health concerns, it is believed that active commuting at lower socioeconomic levels is related to the lower access to motorized vehicles in these families. Furthermore, parental concerns regarding crime and traic safety in Brazil could partially explain the higher rates of passive motorized commuting among private schoolchildren. Other studies using the school type as a proxy of socioeconomic level showed higher active commuting to school among public students and higher participation in leisure-time PA among private schoolchildren13,23. We hypothesize that
Brazilian children with higher socioeconomic levels have more facilities and opportunities to be physically active either in school-based activities or out-of-school leisure activities.
he strengths of the present study include its representative and large sample size and the use of a validated questionnaire to obtain data on food consumption and PA. Some limitations can be pointed out in our study. Because food intake frequency was estimated as times per day rather than by number of servings, as stated in BFG, the questionnaire may underestimate or overestimate the proportion of children meeting the guidelines, since we cannot know if items were eaten more than once at each eating episode. In other words, the instrument assumes that only one serving is consumed on each eating occasion for all food items. Although the instrument illustrates 21 foods or food groups commonly present in the diet of 7-10-year-old children, predeined options for food items may also underestimate the proportion of children meeting the guidelines. In addition, it was not pos-sible to determine the extent to which active commuting adds to the total PA level of public schoolchildren. his question would be addressed with the use of an accelerometer in future investigations.
CONCLUSION
To conclude, the results of the present study revealed better eating patterns, such as higher fruit and vegetable consumption and limited consumption of unhealthy foods, among girls and private schoolchildren. PA levels were higher among boys and children attending private schools. Data collection took place in a city with better overall social indicators than some other Brazilian state capitals27, suggesting that health behavior diferences
REFERENCES
1. Katzmarzyk PT, Baur LA, Blair SN, Lambert EV, Oppert JM, Riddoch C, et al. International conference on physical activity and obesity in children: summary statement and recommendations. Int J Pediatr Obes 2008;3(1):3-21.
2. Wang Y, Lobstein T. Worldwide trends in childhood overweight and obesity. Int J Pediatr Obes 2006;1(1):11-25.
3. WHO. Global strategy on diet and physical activity. World Health Assembly. Geneva: WHO, 2004.
4. Al Sabbah H, Vereecken C, Kolsteren P, Abdeen Z, Maes L. Food habits and physical activity patterns among Palestinian adolescents: indings from the na-tional study of Palestinian schoolchildren (HBSC-WBG2004). Public Health Nutr 2007;10(7):739-46.
5. Borraccino A, Lemma P, Iannotti RJ, Zambon A, Dalmasso P, Lazzeri G, et al. So-cioeconomic efects on meeting physical activity guidelines: comparisons among 32 countries. Med Sci Sports Exerc 2009;41(4):749-56.
6. Neumark-Sztainer D, Wall M, Perry C, Story M. Correlates of fruit and vegetable in-take among adolescents - Findings from Project EAT. Prev Med 2003;37(3):198-208. 7. Pearson N, Timperio A, Salmon J, Crawford D, Biddle S. Family inluences on
children’s physical activity and fruit and vegetable consumption. Int J Behav Nutr Phys Act 2009;6(1):34.
8. van Sluijs EMF, Skidmore PML, Mwanza K, Jones AP, Callaghan AM, Ekelund U, et al. Physical activity and dietary behaviour in a population-based sample of British 10-year old children: the SPEEDY study (Sport, Physical activity and Eating behav-iour: Environmental Determinants in Young people). BMC Public Health 2008;8. 9. Vasques DG, Lopes AS. Fatores associados à atividade física e aos comportamen-tos sedentários em adolescentes. Rev Bras Cineantropom Desempenho Hum 2009;11(1):59-66.
10. Florindo AA, Guimarães VV, Cesar CLG, Barros MBA, Alves M, Goldbaum M. Epidemiology of leisure, transportation, occupational, and household physical activity: prevalence and associated factors. J Phys Act Health 2009;6:625-32. 11. Martins TG, Assis MAA, Nahas MV, Gauche H, Moura EC. Inatividade física no
lazer de adultos e fatores associados. Rev Saúde Pública 2009;43:814-24.
12. Lozada M, Sanchez-Castillo CP, Cabrera GA, Mata, II, Pichardo-Ontiveros E, Villa AR, et al. School food in Mexican children. Public Health Nutr 2008;11(9):924-33. 13. Hallal PC, Bertoldi AD, Gonçalves H, Victora CG. Prevalência de sedentarismo
e fatores associados em adolescentes de 10-12 anos de idade. Cad Saúde Pública 2006;22(6):1277-87.
14. Vossenaar M, Montenegro-Bethancourt G, Kuijper LD, Doak CM, Solomons NW. Distribution of macro- and micronutrient intakes in relation to the meal pattern of third- and fourth-grade schoolchildren in the city of Quetzaltenango, Guatemala. Public Health Nutr 2009;12(9):1330-42.
15. de Assis MAA, Rolland-Cachera MF, Grosseman S, de Vasconcelos FAG, Luna MEP, Calvo MCM, et al. Obesity, overweight and thinness in schoolchildren of the city of Florianopolis, Southern Brazil. Eur J Clin Nutr 2005;59(9):1015-21.
16. Barros MVG, Assis MAA, Pires MC, Grossemann S, Vasconcelos FAG, Luna MEP, et al. Validity of physical activity and food consumption questionnaire for children aged seven to ten years old. Rev Bras Saude Matern Infant 2007;7:437-48. 17. Costa FF, Liparotti JR. Reliability of a new questionnaire for the evaluation of
Food intake and physical activity in schoolchildren Costa & de Assis
Corresponding author
Filipe F. da Costa
Antônio Francisco da Silveira, 140, apartamento 303
88040-160 – Florianópolis, SC, Brasil E-mail: [email protected]
18. Sallis JF, Condon SA, Goggin KJ, Roby JJ, Kolody B, Alcaraz JE. he development of self-administered physical activity surveys for 4th grade students. Res Q Exerc Sport 1993;64(1):25-31.
19. Brasil. Guia alimentar para a população brasileira: promovendo a alimentação saudável. Brasília: Ministério da Saúde; 2005.
20. Lennernas M, Andersson I. Food-based classiication of eating episodes (FBCE). Appetite 1999;32(1):53-65.
21. Assis MAA, Nahas MV, Bellisle F, Kupek E. Meals, snacks and food choices in Brazil-ian shit workers with high energy expenditure. J Hum Nutr Diet 2003;16(4):283-9. 22. Instituto Brasileiro de Geograia e Estatística (2009) Diretoria de Pesquisa, Coorde-nação de População e Indicadores Sociais. Pesquisa Nacional de Saúde do Escolar 2009. Rio de Janeiro: IBGE.
23. Olivares S, Kain J, Lera L, Pizarro F, Vio F, Moron C. Nutritional status, food consumption and physical activity among Chilean school children: a descriptive study. Eur J Clin Nutr 2004; 58(9):1278-85.
24. Vereecken C, Ojala K, Delgrande-Jordan M. Eating habits. In: Currie C, Roberts C, Morgan A, Smith R, Settertobulte W, et al. editors. Young People’s Healthy in Context Health Behaviour in School-aged Children (HBSC) Study: International Report from the 2001/2002 Survey WHO Policy Series: Health Policy for Children and Adolescents Issue 4, Copenhagen: WHO Regional Oice for Europe, 2004, pp. 110-119.
25. Wardle J, Haase AM, Steptoe A, Nillapun M, Jonwutiwes K, Bellisle F. Gender dif-ferences in food choice: the contribution of health beliefs and dieting. Ann Behav Med 2004; 27(2):107-16.
26. Sallis JF, Prochaska JJ, Taylor WC. A review of correlates of physical activity of children and adolescents. Med Sci Sports Exerc 2000; 32(5):963-75.