Ana Carolina R VieiraI Marlene M AlvarezI Salim KanaanII Rosely SichieriIII Gloria V VeigaIV
I Programa de Pós-Graduação em Nutrição. Instituto de Nutrição Josué de Castro (INJC). Universidade Federal do Rio de Janeiro (UFRJ). Rio de Janeiro, RJ, Brasil II Faculdade de Medicina. Universidade
Federal Fluminense. Niterói, RJ, Brasil
III Instituto de Medicina Social, Universidade do Estado do Rio de Janeiro. Rio de Janeiro, RJ, Brasil
IV Departamento de Nutrição Social Aplicada. INJC-UFRJ. Rio de Janeiro, RJ, Brasil
Correspondence: Ana Carolina Reiff e Vieira Instituto de Nutrição Josué de Castro Universidade Federal do Rio de Janeiro Av. Brigadeiro Trompowisky, s/n°
Centro de Ciências da Saúde, Bloco J, 2° andar Ilha do Fundão
21941-590 Rio de Janeiro, RJ, Brasil E-mail: [email protected] Received: 5/14/2008 Approved: 6/11/2008
Body mass index for predicting
hyperglycemia and serum
lipid changes in Brazilian
adolescents
Índice de massa corporal para
predizer hiperglicemia e alterações
lipídicas em adolescentes brasileiros
ABSTRACT
OBJECTIVE: To determine the best cut-offs of body mass index for identifying alterations of blood lipids and glucose in adolescents.
METHODS: A probabilistic sample including 577 adolescent students aged 12-19 years in 2003 (210 males and 367 females) from state public schools in the city of Niterói, Southeastern Brazil, was studied. The Receiver Operating Characteristic curve was used to identify the best age-adjusted BMI cut-off for predicting high levels of serum total cholesterol (≥150mg/dL), LDL-C (≥ 100mg/dL), serum triglycerides (≥100mg/dL), plasma glucose (>100mg/dL) and low levels of HDL-C (< 45mg/dL). Four references were used to calculate sensitivity and specifi city of BMI cut-offs: one Brazilian, one international and two American.
RESULTS: The most prevalent metabolic alterations (>50%) were: high total cholesterol and low HDL-C. BMI predicted high levels of triglycerides in males, high LDL-C in females, and high total cholesterol and the occurrence of three or more metabolic alterations in both males and females (areas under the curve range: 0.59 to 0.67), with low sensitivity (57%–66%) and low specifi city (58%–66%). The best BMI cut-offs for this sample (20.3 kg/m² to 21.0 kg/m²) were lower than those proposed in the references studied.
CONCLUSIONS: Although BMI values lower than the International cut-offs were better predictor of some metabolic abnormalities in Brazilian adolescents, overall BMI is not a good predictor of these abnormalities in this population.
DESCRIPTORS: Adolescent. Body Mass Index. Risk Factors.
In Brazil, overweight prevalence in adolescents tripled over a period of 20 years23 with increased risk for cardiovascular diseases resulting from metabolic ab-normalities.19 Since obese adolescents tend to remain obese in adulthood,13 early identifi cation of youths at risk is of most interest to public health policies as they have a higher risk for mortality and morbidity.7,11
Body mass index (BMI) is used to evaluate overweight and obesity. It is correlated with body fat, it is easily measured and can be used for both adolescent and adult evaluation.14,25 The cut-offs used for defi nition of overweight and obesity, generally in the 85th and 95th percentiles of the distribution based on American population data,17,20 were statistically defi ned, and they are not associated to morbidity or mortality.
BMI accuracy for predicting body fat in adolescents has been widely investigated and it has shown better specifi city than sensitivity.4,24 However, BMI valida-tion depends on its ability of predicting body fat and mostly future risks to health, associated with metabolic changes, such as hyperglycemia, and dyslipidemias.
RESUMO
OBJETIVO: Determinar os melhores pontos de corte do índice de massa corporal (IMC) para identifi car alterações no perfi l lipêmico e glicêmico em adolescentes.
MÉTODOS: Foram avaliados 577 adolescentes de 12 a 19 anos (210 meninos e 367 meninas) em uma amostra probabilística de estudantes de escolas estaduais da cidade de Niterói (RJ), em 2003. Foi utilizada a curva Receiver Operating Characteristic para identifi car o melhor ponto de corte, ajustado para idade, para predizer valores elevados de colesterol total sérico (≥150mg/dL), LDL-C (≥100mg/dL), triglicérides (≥100mg/dL), glicose plasmática (>100mg/dL) e baixos valores de HDL-C (<45mg/dL). Quatro referências foram utilizadas para verifi car a sensibilidade e especifi cidade dos pontos de corte: uma nacional, uma internacional e duas americanas.
RESULTADOS: As alterações metabólicas de maior prevalência (>50%) foram: colesterol total elevado e HDL-C baixa. O IMC foi capaz de predizer valores elevados de triglicérides nos meninos, LDL-C nas meninas e colesterol total e presença de três ou mais alterações metabólicas em ambos os sexos (área sob a curva: 0,59 a 0,67), embora com baixa sensibilidade (57% a 66%) e especifi cidade (58% a 66%). Os melhores pontos de corte na amostra estudada (20,3 kg/m² a 21,0 kg/m²) foram inferiores aos propostos pelas outras referências.
CONCLUSÕES: Embora valores de IMC menores do que os das referências internacionais tenham sido preditores de algumas alterações metabólicas em adolescentes brasileiros, o IMC não foi um bom índice para identifi car estas anormalidades na amostra estudada.
DESCRITORES: Adolescente. Índice de Massa Corporal. Sensibilidade e Especifi cidade. Fatores de Risco. Hiperglicemia. Hiperlipidemias. Técnicas de Diagnóstico e Procedimentos.
INTRODUCTION
Recently the International Obesity Task Force (IOTF5 2000) established BMI cut-offs for children and ado-lescents, corresponding to 25 kg/m2 for overweight and 30 kg/m2 for obesity, based on BMI data collected in six different regions.5 This criterion is known as “interna-tional reference” although two studies have evaluated its association with morbidity in adolescents.3,16
The present study aimed to determine the best cut-offs of body mass index for identifying alterations of blood lipids and glucose in adolescents.
METHODS
The sample size was based on a 25% prevalence of hypercholesterolemia,10 at 95% confi dence level, with 5% precision. Due to cluster sampling by random class selection, the sample size was increased by 20%, mak-ing a total of 600 students.18 As 30% non-response was anticipated according to a pilot study, the total sample should comprise 780 adolescents (26 classes with 30 students each). Twenty-eight classes were sampled, because 13 out of the 33 schools had classes with less than 30 students.
This sample can adequately evaluate sensitivity and specifi city, according to the sample size formula for di-agnostic tests,1 N = Z x Z (P(1-P))/(D*D), applying the highest sensitivity (P=83.7%), described in Katzmarzyk et al’s study15 (2004), and the semi-amplitude for 95% confi dence interval (D=5%), with Z=1.96. In the se-lected classes, 757 students met the eligibility criteria; i.e., not having physical disability that might prevent the anthropometric evaluation, not being pregnant, or breastfeeding. Anthropometric data was obtained from 610 adolescents (43 did not have their parents’ consent; 85 refused to participate; and 19 were no-show). Also, 33 adolescents did not give blood samples, remaining 577 adolescents (23.8% non-response rate).
Data was collected by a trained team composed by three nutritionists and eight college nutrition students, under the supervision of the project’s main investigator, from June to December 2003.
Weight was measured using an electronic scale with maximum capacity of 150 kg and precision of 50 g. Height was measured in duplicate using a portable anthropometer with 0.1 cm precision (0.5 cm maximum variation was allowed between the two measures, and then a mean value was calculated). The adolescents were barefoot, wore light clothes, and remained in the orthostatic position.12
Overweight and obese adolescents were those who were above the specifi c BMI cut-offs for age and gen-der, according to IOTF criterion.5 In the analyses, the categories of overweight and obesity were combined due to the low prevalence of obesity (2.7%).
Blood samples were taken from adolescents who had fasted for 12 hours to measure serum glucose, total cho-lesterol, high-density lipoprotein cholesterol (HDL-C) and triglycerides. Blood sample were analyzed using the automated Express Plus enzymatic method in a clinical analysis laboratory certifi ed by the Brazilian Society of Clinical Pathology. Low-density lipoprotein cholesterol (LDL-C) was calculated.9
The cut-offs for metabolic abnormalities were: total cholesterol ≥150 mg/dL, LDL-C ≥100 mg/dL, HDL-C <45 mg/dL, triglycerides >100 mg/dL,22 and glucose ≥100 mg/dL.8 Risk for cardiovascular disease was eval-uated using two approaches. First, it was categorized
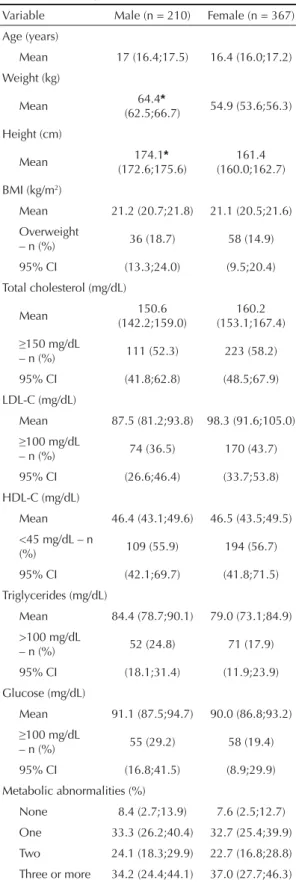
Table 1. Weighted means and prevalences (95% confi dence interval) of anthropometric, body composition and biochemical variables in adolescents, by gender. Niterói, Southeastern Brazil, 2003.
Variable Male (n = 210) Female (n = 367)
Age (years)
Mean 17 (16.4;17.5) 16.4 (16.0;17.2)
Weight (kg)
Mean 64.4*
(62.5;66.7) 54.9 (53.6;56.3)
Height (cm)
Mean 174.1* (172.6;175.6)
161.4 (160.0;162.7)
BMI (kg/m2)
Mean 21.2 (20.7;21.8) 21.1 (20.5;21.6)
Overweight
– n (%) 36 (18.7) 58 (14.9)
95% CI (13.3;24.0) (9.5;20.4)
Total cholesterol (mg/dL)
Mean 150.6
(142.2;159.0)
160.2 (153.1;167.4)
≥150 mg/dL
– n (%) 111 (52.3) 223 (58.2)
95% CI (41.8;62.8) (48.5;67.9)
LDL-C (mg/dL)
Mean 87.5 (81.2;93.8) 98.3 (91.6;105.0)
≥100 mg/dL
– n (%) 74 (36.5) 170 (43.7)
95% CI (26.6;46.4) (33.7;53.8)
HDL-C (mg/dL)
Mean 46.4 (43.1;49.6) 46.5 (43.5;49.5) <45 mg/dL – n
(%) 109 (55.9) 194 (56.7)
95% CI (42.1;69.7) (41.8;71.5)
Triglycerides (mg/dL)
Mean 84.4 (78.7;90.1) 79.0 (73.1;84.9)
>100 mg/dL
– n (%) 52 (24.8) 71 (17.9)
95% CI (18.1;31.4) (11.9;23.9)
Glucose (mg/dL)
Mean 91.1 (87.5;94.7) 90.0 (86.8;93.2)
≥100 mg/dL
– n (%) 55 (29.2) 58 (19.4)
95% CI (16.8;41.5) (8.9;29.9)
Metabolic abnormalities (%)
None 8.4 (2.7;13.9) 7.6 (2.5;12.7)
One 33.3 (26.2;40.4) 32.7 (25.4;39.9)
Two 24.1 (18.3;29.9) 22.7 (16.8;28.8) Three or more 34.2 (24.4;44.1) 37.0 (27.7;46.3)
* When 95% confi dence interval does not intersect while comparing female and male adolescents.
as no abnormality, one abnormality, two abnormalities, and cluster of three or more abnormalities. Second, it was considered a dichotomous variable: at least one abnormality and no abnormalities.
Weighted mean values, prevalence and their respective 95% CI were calculated taking into account the effect of the cluster study design using “Proc Surveymeans” of the SAS 8.2 (Institute Inc, Cary, NC, USA).
The Receiver Operating Characteristic (ROC) curve was used for identifying the best BMI cut-offs (which maximize sensitivity and specifi city), stratifi ed by gender, to predict metabolic abnormalities. The SPSS 11.0 (Chicago, IL, USA) was used in this analysis. Due to the importance of age in BMI variation, BMI values
were age-adjusted by residual analysis (BMI variation independent of the linear age effect).
Areas under the ROC curve (AUC) and their 95% CI were calculated. For those statistically signifi cant the best BMI cut-offs were identifi ed and their sensitivity and specifi city for weight classifi cation were estimated based on four different references,2,5,17,20 adjusted for age. To estimate the sensitivity, specifi city and AUC as for international criterion,5 as we conducted the analysis adjusted for age, the mean values of BMI for those aged 12-19 years were calculated, corresponding to a BMI of 25 kg/m² for 18 years old. For the American curves and for Brazilian reference,17,20 the mean BMI values in the 85th percentile was calculated.
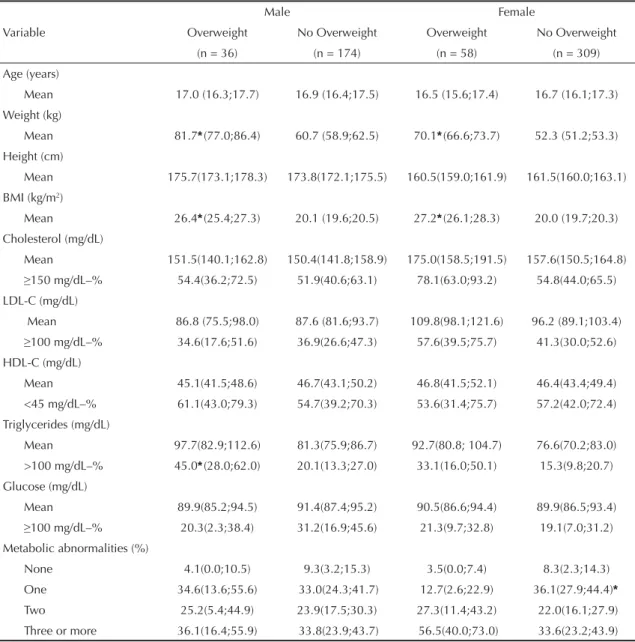
Table 2. Weighted means and prevalences (95% confi dence interval) of anthropometric and biochemical variables in adolescents, by gender and nutritional status. Niterói, Southeastern Brazil, 2003.
Variable
Male Female
Overweight No Overweight Overweight No Overweight
(n = 36) (n = 174) (n = 58) (n = 309)
Age (years)
Mean 17.0 (16.3;17.7) 16.9 (16.4;17.5) 16.5 (15.6;17.4) 16.7 (16.1;17.3)
Weight (kg)
Mean 81.7*(77.0;86.4) 60.7 (58.9;62.5) 70.1*(66.6;73.7) 52.3 (51.2;53.3) Height (cm)
Mean 175.7(173.1;178.3) 173.8(172.1;175.5) 160.5(159.0;161.9) 161.5(160.0;163.1)
BMI (kg/m2)
Mean 26.4*(25.4;27.3) 20.1 (19.6;20.5) 27.2*(26.1;28.3) 20.0 (19.7;20.3)
Cholesterol (mg/dL)
Mean 151.5(140.1;162.8) 150.4(141.8;158.9) 175.0(158.5;191.5) 157.6(150.5;164.8)
≥150 mg/dL–% 54.4(36.2;72.5) 51.9(40.6;63.1) 78.1(63.0;93.2) 54.8(44.0;65.5) LDL-C (mg/dL)
Mean 86.8 (75.5;98.0) 87.6 (81.6;93.7) 109.8(98.1;121.6) 96.2 (89.1;103.4)
≥100 mg/dL–% 34.6(17.6;51.6) 36.9(26.6;47.3) 57.6(39.5;75.7) 41.3(30.0;52.6) HDL-C (mg/dL)
Mean 45.1(41.5;48.6) 46.7(43.1;50.2) 46.8(41.5;52.1) 46.4(43.4;49.4)
<45 mg/dL–% 61.1(43.0;79.3) 54.7(39.2;70.3) 53.6(31.4;75.7) 57.2(42.0;72.4)
Triglycerides (mg/dL)
Mean 97.7(82.9;112.6) 81.3(75.9;86.7) 92.7(80.8; 104.7) 76.6(70.2;83.0)
>100 mg/dL–% 45.0*(28.0;62.0) 20.1(13.3;27.0) 33.1(16.0;50.1) 15.3(9.8;20.7)
Glucose (mg/dL)
Mean 89.9(85.2;94.5) 91.4(87.4;95.2) 90.5(86.6;94.4) 89.9(86.5;93.4)
≥100 mg/dL–% 20.3(2.3;38.4) 31.2(16.9;45.6) 21.3(9.7;32.8) 19.1(7.0;31.2) Metabolic abnormalities (%)
None 4.1(0.0;10.5) 9.3(3.2;15.3) 3.5(0.0;7.4) 8.3(2.3;14.3)
One 34.6(13.6;55.6) 33.0(24.3;41.7) 12.7(2.6;22.9) 36.1(27.9;44.4)*
Two 25.2(5.4;44.9) 23.9(17.5;30.3) 27.3(11.4;43.2) 22.0(16.1;27.9) Three or more 36.1(16.4;55.9) 33.8(23.9;43.7) 56.5(40.0;73.0) 33.6(23.2;43.9)
The study protocol was approved by the Research Eth-ics Committee of “Clementino Fraga Filho Hospital” at Universidade Federal do Rio de Janeiro. Consent forms were signed by adolescents over 18 or their parents or guardians.
RESULTS
Adolescents who did not participate in the study (n=180; 23.8%) did not differ from those participating as for the prevalence of overweight according to the IOTF crite-rion (16.3% and 13.7%, respectively; χ2 = 0.43 p=0.51) and gender (36.4% and 41.1% males, respectively;
χ2=1.30, p=0.25). But the proportion of older adolescents (15–18.9 years) was higher (χ2=8.62, p=0.003) among non-participants (38.9% and 27.4%, respectively).
Except for weight and height, which were greater among boys, there were no statistically signifi cant differences for metabolic abnormalities between males and females. In both, overweight prevalence was less than 20% and prevalence of high total cholesterol (≥150 mg/dL) and low HDL-C (<45 mg/dL) was greater than 50% (Table 1).
A comparison of overweight adolescents with all other adolescents (Table 2) showed that overweight males had signifi cantly increased prevalence of high triglycerides (45.0% and 20.1%, respectively). Despite the non-statistically signifi cant difference, the preva-lence of this metabolic abnormality was twice as high among overweight females (33.1%) compared to others (15.3%). Among females, AUC predicting metabolic abnormalities ranged between 0.46 and 0.65 and was statistically signifi cant for total cholesterol, LDL-C, and presence of three or more abnormalities. Among males, AUC ranged between 0.44 and 0.67 and was statisti-cally signifi cant for total cholesterol, triglycerides, and
the presence of three and more abnormalities (Table 3). Graphic representations of signifi cant AUCs are shown in the Figure.
The best BMI cut-offs for the population studied ranged between 20.3 kg/m² and 21.0 kg/m². These cut-offs were lower but showed higher sensitivity (range: 57% to 66%) and lower specifi city (range: 58% to 66%) than cut-offs from the other four references evaluated (Table 4). BMI had better specifi city than sensitivity for predicting metabolic abnormalities. For three or more abnormalities the sensitivity was higher than 60% (Table 4).
DISCUSSION
The prevalences of overweight of 18.7% for males and 14.9% for females found in the present study were close to those reported (17.0% in both sexes) in adolescents living in another urban area in Southeastern Brazil.23
The magnitude of metabolic abnormalities indicating cardiovascular risk was considerable and greater than those found in other studies with Brazilian adoles-cents.19 The new cut-offs used in this study, established by the Brazilian Society of Cardiology as risk indicators for adolescents, are lower than the previous ones, which may in part explain the high prevalence. Prevalence of overweight is rapidly increasing in Brazil23 and this increase in adolescents may require a more sensitive criterion to identify metabolic abnormalities which have been associated with overweight.
The present study is pioneering in identifying BMI cut-offs associated with cardiovascular risk factors in adolescents, although previous Brazilian studies have shown a correlation between cardiovascular risk fac-tors and BMI.6,21 We found that BMI predicted high levels of total cholesterol and the presence of three or
Table 3. Area under the ROC curve of BMI adjusted for age for predicting metabolic abnormalities in adolescents. Niteróis, Southeastern, 2003.
Variable Male Female
AUC 95% CI p-value AUC 95% CI p-value Total cholesterol 0.59 (0.51;0.66) 0.03* 0.61 (0.55;0.67) <0.001*
LDL-C 0.52 (0.44;0.60) 0.62 0.61 (0.55;0.67) <0.001*
HDL-C 0.49 (0.41;0.57) 0.86 0.46 (0.41;0.52) 0.31
Triglycerides 0.62 (0.53;0.71) 0.01* 0.53 (0.45;0.61) 0.46
Plasma glucose 0.44 (0.35;0.53) 0.18 0.51 (0.43;0.59) 0.74 Metabolic abnormalities
One 0.63 (0.48;0.78) 0.10 0.53 (0.41;0.65) 0.61
Two 0.61 (0.46;0.76) 0.16 0.60 (0.48;0.72) 0.10
Three or more 0.67 (0.52;0.81) 0.03* 0.65 (0.53;0.76) 0.02*
At least one 0.64 (0.48;0.77) 0.06 0.59 (0.48;0.71) 0.09
more metabolic abnormalities in both sexes. In males prediction was greater for increased triglyceride lev-els, and in females for increased LDL-C levels. The best BMI cut-offs for the population studied ranged between 20.3 kg/m2 and 21.0 kg/m2 and identifi ed
approximately 60% of adolescents who had (sensitiv-ity) and who did not have (specifi city) metabolic ab-normalities. These proportions were relatively low as well as the AUC (≈0.60) indicating poor performance of BMI for predicting metabolic abnormalities.
Female
Sensitivity
Cholesterol
1 - Specificity
1,0 0,8 0,5 0,3 0,0 1,0
0,8
0,5
0,3
0,0
Sensitivity
LDL- Cholesterol
1 - Specificity
1,0 0,8 0,5
0,3 0,0
1,0
0,8
0,5
0,3
0,0
Sensitivity
1 - Specificity Three or more
1,0 0,8 0,5 0,3 0,0 1,0
0,8
0,5
0,3
0,0
AUC = 0.61 (0.55;0.67) Best BMI cut-off = 20.3 kg/m2
Sensitivity = 59% Specificity = 59%
AUC = 0.61 (0.55;0.67) Best BMI cut-off = 20.5 kg/m2
Sensitivity = 59% Specificity = 59%
AUC = 0.65 (0.53;0.76) Best BMI cut-off = 20.3 kg/m2
Sensitivity = 66% Specificity = 66%
Sensitivity
Sensitivity
Sensitivity
Male Cholesterol
1 - Specificity
1,0 0,8 0,5
0,3 0,0
1,0
0,8
0,5
0,3
0,0
Triglyceride
1 - Specificity
1,0 0,8 0,5
0,3 0,0
1,0
0,8
0,5
0,3
0,0
Three or more
1 - Specificity
1,0 0,8
0,5 0,3
0,0 1,0
0,8
0,5
0,3
0,0
AUC = 0.59 (0.51;0.66) Best BMI cut-off = 20.8 kg/m2
Sensitivity = 57% Specificity = 58%
AUC = 0.62 (0.53;0.71) Best BMI cut-off = 21.0 kg/m2
Sensitivity = 58% Specificity = 58%
AUC = 0.67(0.52;0.81) Best BMI cut-off = 20.4 kg/m2
Sensitivity = 62% Specificity = 61%
Similar results were reported in a Chilean study,3 which did not found an association between the magnitude of obesity and risk of dyslipidemia in obese children and adolescents, when testing BMI cut-offs for obesity based on the international reference5 and on values above the 95th percentile of the CDC reference.
On the other hand, our fi ndings differ from those found in young Americans in the Bogalusa Heart Study.15 They found BMI had good accuracy for identifying adolescents with three or more metabolic risks, AUC values were between 0.73 and 0.82, the best BMI cut-offs ranged between 19.1 and 24.1 kg/m2 and sensitivity and specifi city were between 67% and 75%.
The BMI cut-offs for classifi cation of overweight of the four references studied had low sensitivity and high specifi city. The Brazilian reference showed better sensitivity than the American and the international ones. Similar results were found in American adolescents,15 although the proportion of false negatives were much higher in our study, nearly 82% in females compared to about 35% in the American study.
The best BMI cut-offs for the population studied were lower than those found in the American and the inter-national references, and consequently more sensitive. The choice of cut-offs with higher sensitivity or
speci-fi city has some important implications. If the goal is to
Table 4. Sensitivity and specifi city of the best BMI cut-offs of adolescents, adjusted for age, and of the mean cut-offs based on Brazilian and international references for predicting metabolic abnormalities. Niterói, Southeastern Brazil, 2003.
Variable Reference Cut-off (kg/m2) Sensitivity Specifi city
Male
Total cholesterol Best cut-off 20.8 57 58
Anjos et al2 21.7 44 68
Cole et al5 23.6 29 80
Kuczmarski et al17 23.8 29 80
Must et al20 23.9 24 80
Triglycerides Best cut-off 21.0 58 58
Anjos et al2 21.7 39 60
Cole et al5 23.6 22 72
Kuczmarski et al17 23.8 22 72
Must et al20 23.9 19 74
Three or more metabolic abnormalities Best cut-off 20.4 62 61
Anjos et al2 21.7 47 79
Cole et al5 23.6 30 89
Kuczmarski et al17 23.8 30 89
Must et al20 23.9 24 89
Female
Total cholesterol Best cut-off 20.3 59 59
Anjos et al2 23.6 24 88
Cole et al5 23.9 23 88
Kuczmarski et al17 24.2 21 88
Must et al20 24.4 18 89
LDL-C Best cut-off 20.5 59 59
Anjos et al2 23.6 26 89
Cole et al5 23.9 25 86
Kuczmarski et al17 24.2 22 86
Must et al20 24.4 19 86
Three or more metabolic abnormalities Best cut-off 20.3 66 66
Anjos et al2 23.6 27 86
Cole et al5 23.9 26 86
Kuczmarski et al17 24.2 23 86
prevent body fat gain and its consequences to health, using more sensitive, lower BMI cut-offs, as found in our study, would be more effective at identifying those youths at risk. However, the low specifi city of these cut-offs requires additional health care actions for controlling metabolic abnormalities. This emphasis on excess weight might make many adolescents unneces-sarily seek care as they do not have any health risks and place a signifi cant burden on health services.
The study sample size did not allow to test and defi ne specifi c cut-offs for each age, which would be ideal, due to greater BMI variation with growth. Yet we minimized this limitation by adjusting BMI for age. This procedure may also reduce the probability of bias that the higher proportion of missing between older adolescents could introduce in the study. The study fi ndings indicate that BMI cut-off can detect
adolescents with three or more metabolic abnormalities – a more advanced risk status, besides predicting iso-lated alterations in total cholesterol and triglycerides in males, and total cholesterol and LDL in females. Nonetheless, even for these alterations, approximately 40% of them may still be misclassifi ed (false negatives or false positives), suggesting that BMI is not a good predictor for these abnormalities. The international criterion proved to be less sensitive for detecting adolescents with metabolic abnormalities than the national cut-offs.
1. Andrade ALS, Zicker E. Métodos de investigação epidemiológica em doenças transmissíveis. Brasília: Organização Pan-Americana da Saúde; 2003.
2. Anjos LA, Veiga GV, Castro IR. Distribuição dos valores do índice de massa corporal da população brasileira até 25 anos de idade. Rev Panam Salud Publica. 1998;3(3):164-73. DOI: 10.1590/S1020-49891998000300004
3. Burrows RA, Burgueno MA, Leiva LB. Sensibilidad de diferentes estándares para metabólicos en niños con exceso de peso. Rev Chil Nutr. 2003;30(1):28-35.
4. Chiara V, Sichieri R, Martins PD. Sensibilidade e especifi cidade de classifi cação de sobrepeso em adolescentes, Rio de Janeiro. Rev Saude Publica. 2003;37(2):226-31. DOI: 10.1590/S0034-89102003000200010
5. Cole TJ, Bellizzi MC, Flegal KM, Dietz WD.
Establishing a standard defi nition for child overweight and obesity worldwide: international survey.
BMJ. 2000;320(7244):1240-5. DOI: 10.1136/ bmj.320.7244.1240
6. Costa RS, Sichieri R. Relação entre sobrepeso, adiposidade e distribuição de gordura com a pressão arterial de adolescentes do município do Rio de Janeiro. Rev Bras Epidemiol. 1998;1(3):268-79. DOI: 10.1590/S1415-790X1998000300006
7. Engeland A, Bjorge T, Sogaard AJ, Tverdal A. Body mass index in adolescence in relation to total mortality: 32 year follow up of 227,000 Norwegian boys and girls. Am J Epidemiol. 2003;157(6):517-23. DOI: 10.1093/aje/kwf219
8. Report of the Expert Committee on the Diagnosis and Classifi cation of Diabetes Mellitus. Diabetes Care.
2003;20(7):1183-97.
9. Friedewald WT, Levy RI, Fredrickson DS. Estimation of the concentration of low-density lipoprotein cholesterol in plasma, without use of the preparative ultracentrifuge. Clin Chem. 1972;18(6):499-502.
10. Gerber ZR, Zielinsky P. Fatores de risco de
aterosclerose na infância, um estudo epidemiológico.
Arq Bras Cardiol. 1997;69(4):231-6. DOI: 10.1590/ S0066-782X1997001000002
11. Gidding SS, Bao W, Srinivasan SR, Berenson GS. Effects of secular trends in obesity on coronary risk factors in children: the Bogalusa Heart Study. J Pediatr. 1995;127(6):868-74. DOI: 10.1016/S0022-3476(95)70020-X
12. Gordon CC, Chumlea WC, Roche AF. Stature recumbent length and weight. In: Lohman TG, Roche AF, Martorell R, editors. Anthropometric standardization reference manual. Champaign: Human Kinetics Books; 1988. p.3-8.
13. Guo SS, Wu W, Chumlea WC, Roche AF. Predicting overweight and obesity in adulthood from body mass index values in childhood and adolescence. Am J Clin Nutr. 2002;76(3):653-8.
14. Himes JH, Dietz, WH. Guidelines for overweight in adolescent preventive services: recommendation from an expert committee. The Expert Committee on Clinical Guidelines for Overweight in Adolescent Preventive Services. Am J Clin Nutr. 1994;59(2):307-16.
15. Katzmarzyk PT, Srinivasan SR, Chen W, Malina RM, Bouchard C, Berenson GS. Body mass index, waist circumference, and clustering of cardiovascular disease risk factors in a biracial sample of children and adolescents. Pediatrics. 2004;114(2):198-205. DOI: 10.1542/peds.114.2.e198
16. Katzmarzyk PT, Tremblay A, Pérusse L, Després JP, Bouchard C. The utility of the international child and adolescent overweight guidelines for predicting coronary heart disease risk factors. J Clin Epidemiol. 2003;56(5):456-62. DOI: 10.1016/S0895-4356(02)00595-4
17. Kuczmarski RJ, Ogden CL, Grummer-Strawn LM, Flegal KM, Guo SS, Mei Z, et al. CDC growth charts: United States advance data from vital and health statistics. Hyattsville: National Centers for Health Statistics; 2000.
18. Lwanga SK, Lemeshow S, editors. Sample size determination in health studies: a practical manual. Geneva: World Health Organization; 1999.
19. Moura EC, Castro CM, Mellin AS, Figueiredo DB. Perfi l lipídico em escolares de Campinas, SP, Brasil. Rev Saude Publica. 2000;34(5):499-505. DOI: 10.1590/ S0034-89102000000500010
20. Must A, Dallal GE, Dietz WH. Reference data for obesity: 85th and 95th percentiles of body mass index (wt/ht2) and triceps skinfold thickness. Am J Clin Nutr. 1991;53(4):839-46.
21. Oliveira CL, Veiga GV, Sichieri R. Anthropometric markers for cardiovascular disease among overweight adolescents. Nutr Res. 2001;21(10):1335-45. DOI: 10.1016/S0271-5317(01)00325-6
22. Sociedade Brasileira de Cardiologia. I Diretriz de Prevenção da Aterosclerose na Infância e na Adolescência. Arq Bras Cardiol. 2005;85(Supl 6):3-36. DOI: 10.1590/S0066-782X2005002500001
23. Veiga GV, Cunha AS, Sichieri R. Trends in overweight among adolescents living in the poorest and richest regions of Brazil. Am J Public Health.
2004;94(9):1544-8.
24. Veiga GV, Dias PC, Anjos LA. A comparison of distribution curves of body mass index from Brazil and United States for assessing overweight and obesity in Brazilian adolescents. Rev Panam Salud Publica. 2001;10(2):79-85. DOI: 10.1590/S1020-49892001000800002
25. World Health Organization. Physical status: the use and interpretation of anthropometry. Geneva; 1995. (WHO Technical Report Series, 854).
REFERENCES