INTRODUCTION
Address to: Dr. Edson Zangiacomi Martinez. Depto. de Medicina Social/FMRP/USP. Av. Bandeirantes 3900, 14049-900 Ribeirão Preto, SP, Brasil.
Phone: 55 16 3602-3070; Fax 55 16 3602-1526
e-mail: [email protected]
Received in 23/08/2011
Accepted in 07/02/2012
Spaio-temporal paterns of tuberculosis incidence in Ribeirão Preto,
State of São Paulo, southeast Brazil, and their relaionship with
social vulnerability: a Bayesian analysis
Daiane Leite da Roza
[1], Maria do Carmo Gullaci Guimarães Caccia-Bava
[1]and Edson Zangiacomi Marinez
[1][1]. Departamento de Medicina Social, Faculdade de Medicina de Ribeirão Preto, Universidade de São Paulo, Ribeirão Preto, SP.
ABSTRACT
Introducion: The purpose of this ecological study was to evaluate the urban spaial and temporal distribuion of tuberculosis (TB) in Ribeirão Preto, State of São Paulo, southeast Brazil, between 2006 and 2009 and to evaluate its relaionship with factors of social vulnerability such as income and educaion level. Methods: We evaluated data from TBWeb, an electronic noiicaion system for TB cases.Measures of social vulnerability were obtained from the SEADE Foundaion, and informaion about the number of inhabitants, educaion and income of the households were obtained from Brazilian Insitute of Geography and Staisics. Staisical analyses were conducted by a Bayesian regression model assuming a Poisson distribuion for the observed new cases of TB in each area. A condiional autoregressive structure was used for the spaial covariance structure. Results: The Bayesian model conirmed the spaial heterogeneity of TB distribuion in Ribeirão Preto, idenifying areas with elevated risk and the efects of social vulnerability on the disease. We demonstrated that the rate of TB was correlated with the measures of income, educaion and social vulnerability. However, we observed areas with low vulnerability and high educaion and income, but with high esimated TB rates. Conclusions: The study ideniied areas with diferent risks for TB, given that the public health system deals with the characterisics of each region individually and prioriizes those that present a higher propensity to risk of TB. Complex relaionships may exist between TB incidence and a wide range of environmental and intrinsic factors, which need to be studied in future research.
Keywords: Tuberculosis. Ecological study. Social vulnerability. Bayesian method.
Many authors1-3 have stated that tuberculosis (TB) remains the
world’s leading cause of death due to a single infectious agent,
Mycobacterium tuberculosis, with an esimated 3 million deaths and 10 million new cases each year1. It is esimated that 1 in every 3 people
worldwide is skin test-posiive for the infecion and is thus believed to harbor the bacterium4. Tuberculosis is strongly associated with
poverty5 and related socioeconomic determinants such as malnutriion
and micronutrient deiciencies6. The environmental and insituional
factors associated with TB are climate, indoor air polluion, poor-quality care, treatment delays, and increased drug resistance7-8.
Tuberculosis is an important public health problem in Brazil, with approximately 90,000 cases reported annually9.
In 2004, the coefficient of TB incidence was 41 per 100,000 inhabitants10, and TB incidence was higher in urban areas such
as the States of Rio de Janeiro (120/100,000 inhabitants) and São Paulo (80/100,000 inhabitants)10, with important diferences
among intra-urban clusters. For instance, in the City of Rio de Janeiro, the Rocinha favela (the largest Brazilian slum) is considered an area with the highest rate of TB, with an incidence approximately 3.5 imes that of the general populaion of the city11.
In 1995, Ribeirão Preto (southeast Brazil) was included among the 25 priority municipaliies targeted for TB control in the State of
Major Article
São Paulo12. In that year, the annual mean coeicient of TB incidence
was 57.19 per 100,000 persons13. Ater the implementaion of acions
such as the DOT strategy14 (Direct Observed Treatment, a supervised
treatment regimen), the coeicients of TB incidence in Ribeirão Preto decreased to 39.68, 35.73, 30.32, and 28.73 cases per 100,000 inhabitants for the years 2001, 2002, 2003, and 2004, respecively (data from SINAN, the Brazilian Informaion System and Disease Noiicaion). However, the incidence coeicients for the years 2007, 2008, and 2009 were 33.61, 34.94, and 39.78 cases per 100,000 inhabitants, respecively (esimated using data from SINAN and data on populaion projecions described by the Brazilian Insitute of Geography and Staisics, IBGE). These values suggest a recent increase in the number of TB cases, demanding new invesigaions into the epidemiology of TB in Ribeirão Preto. This observed increase in the number of TB cases suggests that new studies should be undertaken to elucidate the dynamic of the disease and to idenify the areas that need improvement or atenion.
The use of spaial analysis techniques15 for mapping the geographic
distribuion of TB cases has been considered by many authors16-19. By
modeling the spaial nature of TB incidence data, these works found that TB is not randomly distributed among diferent geographical regions, with disease cases tending to congregate at particular locations18. Thus, the identification of areas with different risks
for TB takes into account that the public health system deals with the characterisics of each region speciically and prioriizes those that present higher incidences of the disease20. In this context, the
METHODS Roza DL et al - Spaio-temporal paterns of TB incidence
Study design
This ecological study analyzed relaionships between the number of annually registered TB cases in Ribeirão Preto, Brazil, and variables related to social vulnerability, income, and educaion. For this study, a map was constructed based on the areas of coverage of the municipality’s 44 health units. The study period spanned the years 2006-2010.
Study locale
Ribeirão Preto is a municipality in the northeastern region of the State of São Paulo (21° 10’ 42’’ South and 47° 48’ 24’’ West) that has an agribusiness-based economy. In 2006, the populaion of Ribeirão Preto was esimated at 559,650 inhabitants in a 650-km2 area.
Source of data
Data concerning to the reported cases of TB in Ribeirão Preto were obtained from TBWeb21, an electronic noiicaion system for TB cases.
The Municipal Health Secretary of Ribeirão Preto authorized the access to TBWeb. A case of TB is deined as a radiologically or bacteriologically conirmed paient (smear- or culture-posiive) and/or with clinical conirmaion of the disease. The system does not report suspected TB cases that do not meet these criteria. Individuals without a ixed address or who live in a prison or peniteniary were not considered in this study. Measures of social vulnerability were obtained from the SEADE Foundaion (htp://www.seade.gov.br/projetos/ipvs/), and informaion about the number of inhabitants, educaion, and income of the households was obtained from the IBGE.
Construcion of the map
Although many Brazilian ecological studies have used IBGE-deined census tracts as the unit of analysis for neighborhoods20,22, the use of
health administraive areas for this purpose may be more appropriate when the objecive is to describe the regions that require priority TB control acions from the municipal health system. In Ribeirão Preto, the municipal health system is organized into regions called Health Districts. There are 5 Health Districts, located in the north, south, east, west, and central regions of the city. Each Health District has a Basic and District Health Unit (UBDS, Unidades Básicas e Distritais de Saúde) that is the reference point for some medical specialies for the respecive region. In addiion, the Health Districts are composed of various Basic Health Units (Unidades Básicas de Saúde, UBS) or Family Health Strategies (Unidades de Saúde da Família, USF) that provide primary care to the populaion in its area of coverage.
Thus, the construcion of the map was based in the areas of coverage of each UBS, UBDS, or USF. The boundaries of the areas were drawn manually on a large printout of a map of the streets and regions of Ribeirão Preto in accordance with the informaion on the areas of coverage of each health unit obtained from the website of the Municipal Health Secretary. However, a descripion of the areas of coverage of the newest health units was not available on the home page. Therefore, it was necessary to schedule visits to the coordinators of these health units to obtain the required detailed informaion. The geographic limits of these units’ areas of coverage were then covered by car to derive a more accurate transposiion of the boundaries to
the map. Finally, these geographic limits were transferred to digital format using a graphics editor that allowed manual drawing of such municipal street boundaries on a digital map. We ideniied 44 areas, shown in Figure 1. The denominaion of the areas and the numeric labels used to idenify them are also shown in Figure 1, and the UBDS, UBS, or USF responsible for each area is stated in parentheses. Due to their extension, the University of São Paulo campus area (USP, area 19) and the Moura Lacerda University Center campus area (area 30) were considered separately.
Variables
Vulnerability is a construct that refers to a dynamic context in which someone is at risk for the development of health problems resulting from inadequate economic, social, family, cognitive, psychological, or physical resources23. In this study, the São Paulo Social
Vulnerability Index (IPVS)24 was used to establish the degree of social
vulnerability prevalent among individuals residing in each area. The IPVS is composed of socioeconomic variables related to the income and educaion level of household members, and family life cycle, such as the type of family arrangement and age of the household members. This index has been used to classify the level of social vulnerability of people in each census tract State of São Paulo, considering 6 classiicaion levels: 1) no vulnerability, 2) very low vulnerability, 3) low vulnerability, 4) medium vulnerability, 5) high vulnerability, and 6) very high vulnerability. In the present study, levels 5 and 6 were combined to form 1 category for highest vulnerability. The map based in each health unit’s area of coverage was superimposed on a map on the same scale containing the IPVS for each census tract (available from http://www.seade.gov.br/projetos/ipvs/mapas/Municipio/ ribeirao_preto.pdf), and the observed predominant IPVS for each area of coverage was considered.
The distribuion of predominant incomes in households by the number of minimum salaries was also deined by superimposing the map based on each health unit’s area of coverage on a map on the same scale containing the income for each census tract, obtained from IBGE. The predominant household income in each area was classiied as 0-3 minimum salaries, >3-10 minimum salaries, and 10 or more minimum salaries (in 2011, 1 Brazilian minimum salary was equivalent to approximately US$345 per month). Analogously, the predominant educaion level of households in each of the 44 areas was also deined by map superimposiion. This variable was classiied as elementary, middle, and higher educaion (including post-graduate levels). Areas with a predominant number of household members without educaion were not found.
Staisical analysis
Let Yit be the observed number of new TB cases in area i and in year t (let t = 1 if year 2006, t = 2 if year 2007, and so on). It was assumed that the random variable Yit followed a Poisson distribuion with parameter µit, or for example, Yit|µit ~ Poisson(µit), i = 1, …, 44,
t = 1, ..., 4, where µit = Nitθit, Nit being the number of inhabitants in area i in year t and θit being the coeicient of TB incidence in area
i in year t. The coeicient θit is related to a vector of p covariates,
Xi (or p dummies variables related to a single qualitaive covariate with p + 1 classes), in the following manner: log θit = α + ωi + βit +
FIGURE 1 - Map of the municipality of Ribeirão Preto idenifying the 44 areas, their respecive numeric labels, denominaions, Health Districts (North, West, Central, South, and East) and the UBDS, UBS, or USF responsible for them (in parentheses).
UBS: Unidade Básica de Saúde; USF: Unidade de Saúde da Família; UBDS: Unidade Básica Distrital de Saúde; USP: Universidade de São Paulo.
of parameters associated to the covariates X1i, …, Xpi. In the Bayesian analysis, non-informaive prior knowledge was considered with a lat distribuion for the intercept α. Considering each area i, we assigned a mulivariate normal prior distribuion for the parameter βit, with vector of means zero and a covariance matrix for which an inverse Wishart prior distribuion was speciied. The prior distribuion for the random efects ωi was assumed to have a condiional autoregressive structure that required an adjacency matrix and a weight matrix25. Thus, it was
assumed that, ωi{ωi , i ≠ j , j ∈ A* (i ) }, σ 2
ω ∼ N η i , σ
2
,
i = 1, …, 44, where A*(i) denotes the set of neighbors of area i, η
i
is the mean of the random efects corresponding to areas in the neighborhood of area i, ni is the number of regions forming this neighborhood, σ 2 is a precision parameter, and N (a, b) generically
denotes a normal distribuion with mean a and variance b. Thus, we adopted the nearest neighbor criteria, where the prior spaial distribuion for the random efects ωi allowed coniguous areas to
ω η i
(
(
ω
North District
1. Heitor Rigon (UBS Heitor Rigon)
2. Geraldo Correia de Carvalho (USF G. C. Carvalho) 3. Marincek (UBS Marincek)
4. Valenina Figueiredo (UBS Valenina Figueiredo) 5. Adelino Simioni (UBS Adelino Simioni) 6. Estação do Alto (USF Estação do Alto)
7. Quinino II (UBDS Quinino II)
8. Avelino Palma (UBS Avelino Palma) 9. Quinino I (UBS Quinino I) 10. Vila Mariana (UBS Vila Mariana) 11. Jardim Aeroporto (UBS Jardim Aeroporto) 12. RIbeirão Verde (UBS RIbeirão Verde)
West District
13. Dom Mielle (UBS Dom Mielle) 14. José Sampaio (UBS José Sampaio) 15. Maria Casagrande (UBS Maria Casagrande) 16. Eugênio Mendes Lopes (USF Eugênio M. Lopes) 17. Portal do Alto (USF Portal do Alto)
18. Jardim Paiva (UBS Jardim Paiva) 19. Campus da USP (UBDS Sumarezinho) 20. Vila Lobato (UBS Vila Lobato)
21. Sumarezinho (UBDS Sumarezinho)
22. Ipiranga (UBS Ipiranga)
23. Vila Recreio (UBS Vila Recreio) 24. Dutra (UBS Dutra)
25. Vila Alberina (UBS Vila Alberina)
Central District
26. Vila Tibério I (UBS Vila Tibério I) 27. Vila Tibério II (UBS Vila Tibério II)
28. Central (UBDS Central)
29. Campos Elíseos (UBS Campos Elíseos) 30. Campus Moura Lacerda (UBS Campos Elíseos) 31. João Rossi (UBS João Rossi)
South District
32. Jardim Recreio (UBDS Vila Virgínia) 33. Jardim Itaú (UBDS Vila Virgínia) 34. Adão do Carmo (UBS Adão do Carmo)
35. Vila Virgínia (UBDS Vila Virgínia)
36. Maria das Graças (UBS Maria das Graças) 37. Parque Ribeirão (UBS Parque Ribeirão)
East District
38. Santa Cruz (UBS Santa Cruz)
39. Castelo Branco (UBDS Castelo Branco)
40. Jardim Zara (USF Jardim Zara) 41. Vila Abranches (UBS Vila Abranches) 42. Jardim Juliana (UBS Jardim Juliana) 43. São José (UBS São José)
44. Bonim Paulista (UBS Bonim Paulista)
Rural area
N
W E
RESULTS
Between 2006 and 2009, 705 cases of TB were reported in Ribeirão Preto, with an average age of 41 years. Among these cases, 68.8% were men and 60.7% had 1-7 years of schooling. In addiion, 22.5% of these cases were HIV posiive, and 14.9% were alcoholic.
As speciied in the previous secion, a Bayesian model was ited to the data in the irst step, but without considering covariates. To examine the sensiivity of the results to model esimaion methods, a series of Bayesian alternaive models was ited to the data. This included models using other prior structures for the efect βit related to area i and year t as a mean zero Gaussian process with an exponenial covariance funcion, where the covariance between βit and βit* for each area i is a funcion of the number of years separaing t and t*. However, the model described in the previous secion had the lowest DIC value (DIC = 733.8).
Figure 2 illustrates maps of urban areas of Ribeirão Preto, displaying the adjusted mean number of reported new TB cases in the years 2006 to 2009. In all the 4 years, the highest incidence rates of TB were observed in areas 33 (Jardim Itaú), 18 (Jardim Paiva), 36 (Maria das Graças), and 16 (Eugênio Mendes Lopes). Geographically, the new annual cases of TB in Ribeirão Preto tended to be more concentrated in the west and south regions. The east region (areas 38-44) tended to have the lowest TB incidence rates in the studied period. The Bayesian esimates and posterior 95% credible intervals (95% CI) for the annual number of new TB cases per 100,000 inhabitants for the 44 areas are
ploted in Figure 3, where a heterogeneous patern among the TB longitudinal trends across the areas is visible. Some areas experienced approximately constant TB occurrence over the 4-year period (for example, areas 7, 11, 14, and 39), while the annual incidence of TB in other areas luctuated (for example, areas 1, 9, 21, and 40). The lines in Figure 3 suggest an increase of the annual incidence of TB in 2009 in areas 1 (Heitor Rigon), 5 (Adelino Simioni), 6 (Estação do Alto), 16 (Eugênio Mendes Lopes), 18 (Jardim Paiva), 21 (Sumarezinho), 23 (Vila Recreio), 30 (Campus Moura Lacerda), 32 (Jardim Recreio), 33 (Jardim Itaú), 34 (Adão do Carmo), 36 (Maria das Graças), and 40 (Jardim Zara). There were areas with high social vulnerability among these areas, such as areas 33 and 36; however, others were classiied as being without vulnerability (such as areas 1 and 32) or with predominantly low vulnerability (such as areas 6 and 21).
In the second step, 1 covariate was added to this model at a ime. A muliple model containing more than 1 covariate was not ited to the data due to collinearity problems that are commonly found in ecological studies. The model containing only the predominant social vulnerability level as a covariate generated a DIC value of 730.6, while the model containing only predominant household income level as a covariate generated a DIC value of 732.5, and the model containing only the predominant household education level as covariate generated a DIC value of 733.7. Considering only the goodness-of-it as esimated by the DIC, the model that included the social vulnerability level was beter ited, suggesing that of the 3 covariates, this covariate is most closely related to TB incidence. In addiion, the models that included the spaial structure, even the model without an independent covariate, were beter ited. This proves that the spaial distribuion of TB is heterogeneous and clustered.
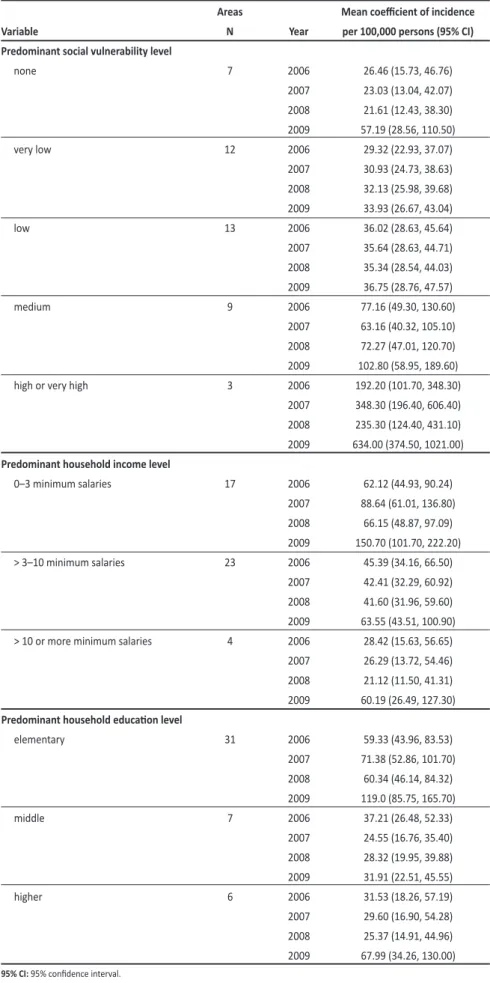
Table 1 provides the esimated mean coeicient of incidence per 100,000 persons with its respecive 95% CI, obtained by the Bayesian model and considering each year and class of the covariates predominant social vulnerability level, predominant household income level, and predominant household education level. In
Table 1, an expressive increase in the incidence coeicients of TB in 2009 can be observed, even in areas with an absence of social vulnerability, highest income level, and highest education level. Generally, it can be noted in Table 1 that the incidence coeicients of TB grow as the social vulnerability levels of the areas increase and as the predominant household income level decreases.
Roza DL et al - Spaio-temporal paterns of TB incidence
have similar weights. The prior distribuion for the parameter σ 2
was chosen as an inverse gamma density, denoted by σ -2 ~ Gamma
(0.5,0.0005), as recommended in the literature26.
For the Bayesian esimaion of the parameters of the model, we considered the use of Markov chain Monte Carlo methods27. A
major simpliicaion in the sample simulaion for the joint posterior distribuion of interest was obtained using the GeoBUGS module28
in WinBUGS, a sotware package for Bayesian analysis of complex staisical models using Monte Carlo methods29. Currently, all versions
of WinBUGS are free and available from the BUGS Project website (htp://www.mrc-bsu.cam.ac.uk/bugs). Using the GeoBUGS notaion, we obtained ωi ~ car.normal (adj[], weights[], num[], σ 2
), where num[]
denotes the number of neighbors, ni, for each area, adj[] denotes the speciicaion of all neighboring areas, and weights[] are speciied weights (equal to 1 if areas i and j are neighbors, and 0 otherwise). The convergence of the chains was assessed using visual examinaion of trace, density, and autocorrelaion plots, and by the Geweke30 criteria.
In the it of all models, 150,000 samples for each parameter of interest were generated, with a burn-in of 5,000 iteraions aimed at avoiding the inluence of the iniial values and a thinning interval of 50 aimed at avoiding correlaion between successive samples.
The deviance informaion criterion (DIC)31 was used to assess the
goodness-of-it of the diferent models. Models with a lower DIC value are usually selected as providing the best representaion of the data.
Ethical consideraions
The Commitee for Ethics in Research at HCFMRP-USP, University of São Paulo, reviewed and approved this study under process 11304/2009.
ω ω
ω
DISCUSSION
In the present study, the rate of TB was correlated with the measures of income, educaion, and social vulnerability. These results are compaible with previous ecological analyses from the literature32-34,
conirming that TB coninues to be a disease strongly related to the social characterisics of a populaion. Marais et al.35 cite 3 primary
causes that deter-mine the role of poverty in the transmission of
M. tuberculosis: I) its inluence on living condiions, such as people living in overcrowded and poorly venilated homes, II) prolonged diagnosic delay, and III) increased vulnerability due to malnutriion and/or HIV infecion. Ecological studies provide a means of examining TB within its social context34 as the relaionship between the disease
FIGURE 2 - Esimated mean number of new cases of tuberculosis (TB) in urban areas of Ribeirão Preto, State of São Paulo, in (a) 2006, (b) 2007, (c) 2008, and (d) 2009
The values in the legend denote the number of cases per 100,000 inhabitants. 0-20 0-40 0-60 0-80 0-100 0-500 0-2500
2006 (a)
2007 (a)
2008
Roza DL et al - Spaio-temporal paterns of TB incidence
FIGURE 3 -The observed and esimated mean number of new tuberculosis (TB) cases (cases per 100,000 inhabitants) from 2006 to 2009 for each area in Ribeirão Preto, Brazil, considering the Bayesian model
The solid lines and open circles correspond to the esimated number of cases and the dashed lines to 95% credible intervals. The observed number of TB cases in each year is ploted as full circles.
1. Heitor Rigon UBS Heitor Rigon (N)
0 20 40 60 80 100
2006 2007 2008 2009
2. Geraldo Correia de Carvalho USF Geraldo C. de Carvalho (N)
0 20 40 60 80 100
2006 2007 2008 2009
3. Marincek UBS Marincek (N)
0 20 40 60 80 100
2006 2007 2008 2009
4. Valentina Figueiredo UBS Valentina Figueiredo (N)
0 20 40 60 80 100
2006 2007 2008 2009
5. Adelino Simioni UBS Adelino Simioni (N)
0 20 40 60 80 100
2006 2007 2008 2009
6. Estação do Alto USF Estação do Alto (N)
0 20 40 60 80 100
2006 2007 2008 2009
7. Quintino II UBDS Quintino II (N)
0 20 40 60 80 100
2006 2007 2008 2009
8. Avelino Palma
UBS Avelino Palma (N)
0 20 40 60 80 100
2006 2007 2008 2009
9. Quintino I UBS Quintino I (N)
0 20 40 60 80 100
2006 2007 2008 2009
10. Vila Mariana UBS Vila Mariana (N)
0 20 40 60 80 100
2006 2007 2008 2009
11. Jardim Aeroporto UBS Jardim Aeroporto (N)
0 20 40 60 80 100
2006 2007 2008 2009
12. Ribeirão Verde UBS Ribeirão Verde (N)
0 20 40 60 80 100
2006 2007 2008 2009
13. Dom Mielle UBS Dom Mielle (W)
0 20 40 60 80 100
2006 2007 2008 2009
14. José Sampaio UBS José Sampaio (W)
0 20 40 60 80 100
2006 2007 2008 2009
15. Maria Casagrande UBS Maria Casagrande (W)
0 20 40 60 80 100
2006 2007 2008 2009
16. Eugênio Mendes Lopes USF Eugênio M. Lopes (W)
0 100 200 300 400 500 600
2006 2007 2008 2009
17. Portal do Alto USF Portal do Alto (W)
0 50 100 150 200
2006 2007 2008 2009
18. Jardim Paiva UBS Jardim Paiva (W)
0 200 400 600 800 1000
2006 2007 2008 2009
19. Campus da USP UBDS Sumarezinho (W)
0 20 40 60 80 100
2006 2007 2008 2009
20. Vila Lobato UBS Vila Lobato (W)
0 20 40 60 80 100
2006 2007 2008 2009
21. Sumarezinho UBDS Sumarezinho (W)
0 20 40 60 80 100
2006 2007 2008 2009
22. Ipiranga
UBS Ipiranga (W)
0 20 40 60 80 100
2006 2007 2008 2009
23. Vila Recreio
UBS Vila Recreio (W)
0 20 40 60 80 100
2006 2007 2008 2009
24. Dutra
UBS Dutra (W)
0 20 40 60 80 100
2006 2007 2008 2009
25. Vila Albertina
UBS Vila Albertina (W)
0 20 40 60 80 100
2006 2007 2008 2009
26. Vila Tibério I
UBS Vila Tibério I (C)
0 20 40 60 80 100
2006 2007 2008 2009
27. Vila Tibério II
UBS Vila Tibério II (C)
0 20 40 60 80 100
2006 2007 2008 2009
28. Central
UBDS Central (C)
0 20 40 60 80 100
2006 2007 2008 2009
29. Campos Elíseos
UBS Campos Elíseos (C)
0 20 40 60 80 100
2006 2007 2008 2009
30. Campus Moura Lacerda
UBS Campos Elíseos (C)
0 100 200 300 400 500
2006 2007 2008 2009
31. João Rossi
UBS João Rossi (C)
0 20 40 60 80 100
2006 2007 2008 2009
32. Jardim Recreio
UBDS Vila Virgínia (S)
0 100 200 300 400 500
2006 2007 2008 2009 33. Jardim Itaú
UBDS Vila Virgínia (S)
0 500 1000 1500 2000 2500 3000
2006 2007 2008 2009
34. Adão do Carmo UBS Adão do Carmo (S)
0 100 200 300 400 500
2006 2007 2008 2009
35. Vila Virgínia UBDS Vila Virgínia (S)
0 20 40 60 80 100
2006 2007 2008 2009
36. Maria das Graças
UBS Maria das Graças (S)
0 100 200 300 400 500
2006 2007 2008 2009
37. Parque Ribeirão
UBS Parque Ribeirão (S)
0 20 40 60 80 100
2006 2007 2008 2009
38. Santa Cruz
UBS Santa Cruz (E)
0 20 40 60 80 100
2006 2007 2008 2009
39. Castelo Branco
UBDS Castelo Branco (E)
0 20 40 60 80 100
2006 2007 2008 2009
40. Jardim Zara
USF Jardim Zara (E)
0 20 40 60 80 100
2006 2007 2008 2009
41. Vila Abranches
UBS Vila Abranches (E)
0 20 40 60 80 100
2006 2007 2008 2009
42. Jardim Juliana
UBS Jardim Juliana (E)
0 50 100 150 200
2006 2007 2008 2009
43. São José
UBS São José (E)
0 20 40 60 80 100
2006 2007 2008 2009
44. Bonfim Paulista
UBS Bonfim Paulista (E)
0 20 40 60 80 100
TABLE 1 - Esimated mean coeicient of tuberculosis (TB) incidence per 100,000 persons by Bayesian model in different social vulnerability, income level, and education level groups, Ribeirão Preto, São Paulo State, Brazil, 2006-2009.
Areas Mean coeicient of incidence
Variable N Year per 100,000 persons (95% CI)
Predominant social vulnerability level
none 7 2006 26.46 (15.73, 46.76)
2007 23.03 (13.04, 42.07) 2008 21.61 (12.43, 38.30) 2009 57.19 (28.56, 110.50)
very low 12 2006 29.32 (22.93, 37.07)
2007 30.93 (24.73, 38.63) 2008 32.13 (25.98, 39.68) 2009 33.93 (26.67, 43.04)
low 13 2006 36.02 (28.63, 45.64)
2007 35.64 (28.63, 44.71) 2008 35.34 (28.54, 44.03) 2009 36.75 (28.76, 47.57)
medium 9 2006 77.16 (49.30, 130.60)
2007 63.16 (40.32, 105.10) 2008 72.27 (47.01, 120.70) 2009 102.80 (58.95, 189.60) high or very high 3 2006 192.20 (101.70, 348.30)
2007 348.30 (196.40, 606.40) 2008 235.30 (124.40, 431.10) 2009 634.00 (374.50, 1021.00)
Predominant household income level
0–3 minimum salaries 17 2006 62.12 (44.93, 90.24) 2007 88.64 (61.01, 136.80) 2008 66.15 (48.87, 97.09) 2009 150.70 (101.70, 222.20) > 3–10 minimum salaries 23 2006 45.39 (34.16, 66.50)
2007 42.41 (32.29, 60.92) 2008 41.60 (31.96, 59.60) 2009 63.55 (43.51, 100.90) > 10 or more minimum salaries 4 2006 28.42 (15.63, 56.65)
2007 26.29 (13.72, 54.46) 2008 21.12 (11.50, 41.31) 2009 60.19 (26.49, 127.30)
Predominant household educaion level
elementary 31 2006 59.33 (43.96, 83.53)
2007 71.38 (52.86, 101.70) 2008 60.34 (46.14, 84.32) 2009 119.0 (85.75, 165.70)
middle 7 2006 37.21 (26.48, 52.33)
2007 24.55 (16.76, 35.40) 2008 28.32 (19.95, 39.88) 2009 31.91 (22.51, 45.55)
higher 6 2006 31.53 (18.26, 57.19)
2007 29.60 (16.90, 54.28) 2008 25.37 (14.91, 44.96) 2009 67.99 (34.26, 130.00) 95% CI: 95% conidence interval.
Several studies have already addressed the spaio-temporal paterns of TB in Ribeirão Preto36,37, but these studies are limited because
they only describe the place of residence of the individuals who developed TB and the regions with the largest concentraion of cases of the disease without the use of regression models that formally link vulnerability and socioeconomic factors to the disease from a spaial perspecive. In this context, Bayesian spatial models are useful tools to understand spatial variation in disease risk and to provide important informaion for assessing and quanifying the amount of true spaial heterogeneity and the associated paterns38. In addiion, these models
are able to idenify the areas of elevated risk and propensity of the disease, and they allow exploraion of the relaions of the disease and environmental exposures. Bayesian models similar to the one proposed here have been applied to investigate the spatial pattern of TB in diferent populaions39,40. In the present
study, the Bayesian model conirmed the spaial heterogeneity of TB distribution in Ribeirão Preto, idenifying areas with elevated risk and the efects of social vulnerability on the disease.
Despite the well-known associaion between TB and poverty5, the present study demonstrated
that the TB rates in Ribeirão Preto were also increased in areas with low social vulnerability and high income and educaion levels (Table 1). This suggests that more complex relaionships may exist between TB incidence and a wide range of environmental and intrinsic factors such as the individuals’ occupations, work conditions, poor nutrition, access to quality healthcare, living conditions, crowding, and social behavior. Occupaional exposures should be further explored in individual-level studies, given that areas such as Jardim Recreio (area 32 on the map), in which many people who work in healthcare live due to its proximity to the Hospital of Clinics of the University of São Paulo, have a low vulnerability level and high educaion and income levels, but high esimated TB rates.
This study has limitaions that are intrinsic to its ecological design, such as the possibility of migration across the areas, temporal ambiguity (the disease can influence the social vulnerability), and ecologic biases41,42.
quite high in some strata of social vulnerability levels (Table 1), and it can be an efect associated with an underesimated number of inhabitants in some areas with a high number of new TB cases. The TBWeb information system was implemented in 2006, covering municipaliies in the State of São Paulo. It is believed that the quality and completeness of the informaion on TBWeb are superior when compared with the previous EPI-TB system (used unil 2006) due to the establishment of training programs for healthcare professionals43.
However, the system is not free of deiciencies such as the possibility of cases being underreported due to caregivers’ lack of awareness and delay in seeking health services. In addiion, individuals without a ixed address or living in country houses within the urban area could not be georeferenced because no locaion informaion was available. However, these losses were small, represening only 3.5% of all registers.
Finally, several ecological studies have already invesigated risk factors for TB in a spaial context18,34,36,44,45, but there is a need for new
studies dealing simultaneously with the impacts of socio-economic status and health services. This would allow beter understanding of the impact of the applicaion of DOT strategy regimens and other strategies for health care provision in the incidence of TB. Since prolonged diagnosic delay is also a factor to be considered, the care model adopted by each health unit could be explored in further invesigaions, considering that the health teams are responsible for having in-depth knowledge of their ascribed territory in order to address singular measures to the most vulnerable social groups concerning TB control.
The authors declare that there is no conlict of interest. CONFLICT OF INTEREST
FINANCIAL SUPPORT
REFERENCES
This work was supported by Fundação de Apoio, Ensino, Pesquisa e Assistência (FAEPA), Hospital das Clínicas,and Faculdade de Medicina de Ribeirão Preto, Universidade de São Paulo. Edson Zangiacomi Marinez received invesigator grants from Conselho Nacional de Desenvolvimento Cieníico e Tecnológico (CNPq).
1. Pethe K, Alonso S, Biet F, Delogu G, Brennan MJ, Locht C, et al. The heparin-binding haemaggluinin of M. tuberculosis is required for extrapulmonary disseminaion. Nature 2001; 412:190-194.
2. Gandy M, Zumla A. The resurgence of disease: social and historical perspecives on the ‘new’ tuberculosis. Soc Sci Med 2002; 55:385-401.
3. Burgos MV, Pym AS. Molecular epidemiology of tuberculosis. Eur Respir J 2002; 36:S54-S65.
4. Russell DG, Barry CE, Flynn JL. Tuberculosis: what we don’t know can, and does, hurt us. 3rd Science 2010; 328 (suppl): 852-856.
5. Spence DP, Hotchkiss J, Williams CS, Davies PD. Tuberculosis and poverty. BMJ 1993; 307:759-761.
6. Koyanagi A, Kufó D, Gresely L, Shenkin A, Cuevas LE. Relaionships between serum concentraions of C-reacive protein and micronutrients, in paients with tuberculosis. Ann Trop Med Parasitol 2004; 98:391-399.
7. Bates I, Fenton C, Gruber J, Lalloo D, Lara AM, Squire SB, et al. Vulnerability to malaria, tuberculosis, and HIV/AIDS infection and disease. Part II: Determinants operating at environmental and institutional level. Lancet Infect Dis 2004; 4:368-375.
8. Hopewell PC, Pai M. Tuberculosis, vulnerability, and access to quality care. JAMA 2005; 293:2790-2793.
9. Dalcolmo M. Tuberculosis and HIV infecion in Brazil - update and overview. TB HIV 1996; 11:26.
10. Bierrenbach AL, Gomes AB, Noronha EF, Souza MF. Tuberculosis incidence and cure rates, Brazil, 2000-2004. Rev Saude Publica 2007; 41(supl I):24-33. 11. Cavalcante SC, Soares EC, Pacheco AG, Chaisson RE, Durovni B. DOTS Expansion
Team. Community DOT for tuberculosis in a Brazilian favela: comparison with a clinic model. Int J Tuberc Lung Dis 2007; 11:544-549.
12. Spindola-de-Miranda S, Kritski A, Filliol I, Mabilat C, Panteix G, Drouet E. Mutaions in the rpoB gene of rifampicin-resistant Mycobacterium tuberculosis strains isolated in Brazil and France. Mem Inst Oswaldo Cruz 2001; 96:247-250.
13. Muniz JN, Villa TCS. O impacto epidemiológico do tratamento supervisionado no controle da tuberculose em Ribeirão Preto 1998-2000. Bol Pneumol Sanit 2002; 10:49-54.
14. Vendramini SHF, Villa TCS, Palha PFP, Monroe AA. Tratamento supervisionado no controle da tuberculose em uma unidade de saúde de Ribeirão Preto: a percepção do doente. Bol Pneumol Sanit 2002; 10:5-12.
15. Gesler W. The uses of spaial analysis in medical geography: a review. Soc Sci Med 1986; 23:963-973.
16. Alvarez-Hernández G, Lara-Valencia F, Reyes-Castro PA, Rascón-Pacheco RA. An analysis of spatial and socio-economic determinants of tuberculosis in Hermosillo, Mexico, 2000-2006. Int J Tuberc Lung Dis 2010; 14:708-713. 17. Touray K, Adeifa IM, Jallow A, Rigby J, Jefries D, Cheung YB, et al. Spaial analysis
of tuberculosis in an urban West African seing: is there evidence of clustering? Trop Med Int Health 2010; 15:664-672.
18. Maciel EL, Pan W, Dietze R, Peres RL, Vinhas SA, Ribeiro FK, et al. Spaial paterns of pulmonary tuberculosis incidence and their relaionship to socio-economic status in Vitoria, Brazil. Int J Tuberc Lung Dis 2010; 14:1395-1402.
Roza DL et al - Spaio-temporal paterns of TB incidence
ABSTRACT IN PORTUgUESE
Padrões espaço-temporais da incidência de tuberculose em Ribeirão Preto, Estado de São Paulo, Sudeste do Brasil, e suas relações com
a vulnerabilidade social: uma análise bayesiana
Introdução: O objeivo deste estudo ecológico é avaliar a distribuição espacial e temporal da tuberculose (TB) na área urbana de Ribeirão Preto, São Paulo, entre os anos de 2006 e 2009, e estudar as suas relações com fatores de vulnerabilidade social como renda e educação. Métodos: Foram uilizados dados do TBWeb, um sistema de noiicação de dados de TB. As medidas de vulnerabilidade social foram obidas da Fundação SEADE (Sistema Estadual de Análise de Dados) e informações sobre o número de habitantes, educação e renda dos chefes dos domicílios foram obidas do Insituto Brasileiro de Geograia e Estaísica. A análise estaísica uilizou um modelo bayesiano de regressão assumindo que os novos casos de TB observados em cada área assumem uma distribuição de Poisson.
Resultados: O modelo bayesiano confirmou a heterogeneidade
especial da distribuição da TB em Ribeirão Preto, ideniicando áreas com elevado risco de TB e os efeitos da vulnerabilidade social sobre a doença. Foi evidenciado que a taxa de TB associa-se com as medidas de renda, educação e vulnerabilidade social. Entretanto, são observadas áreas com baixa vulnerabilidade social e alto nível educacional, mas altas taxas de TB. Conclusões: O estudo ideniicou áreas com diferentes riscos de TB, permiindo que o sistema público de saúde lide com as diferentes caracterísicas de cada região e priorize aquelas que apresentem maior propensão de risco de TB. São evidentes relações complexas entre a incidência de TB e um amplo número de fatores ambientais e intrínsecos, o que mostra a necessidade destes serem estudados em trabalhos futuros.
19. Munch Z, Van Lill SW, Booysen CN, Zietsman HL, Enarson DA, Beyers N. Tuberculosis transmission paterns in a high-incidence area: a spaial analysis. Int J Tuberc Lung Dis 2003; 7:271-277.
20. Vendramini SHF, Gazeta CE, Chiaravaloi Neto F, Cury MR, Meirelles EB, Kuyumjian FG, et al. Tuberculosis in a medium-sized city in the Southeast of Brazil: morbidity and mortality rates (1985-2003). J Bras Pneumol 2005; 31:237-243.
21. Galesi VMN. Dados de tuberculose do Estado de São Paulo. Rev Saude Publica 2007; 41 (supl I): 121.
22. Souza WV, Albuquerque MFM, Barcellos CC, Ximenes RAA, Carvalho MS. Tuberculose no Brasil: construção de um sistema de vigilância de base territorial. Rev Saude Publica 2005; 39:82-89.
23. Pavarini SCI, Barha EJ, Mendiondo MSZ, Filizola CLA, Petrilli Filho JF, Santos AA. Family and social vulnerability: a study with octogenarians. Rev Laino-Am Enfermagem 2009; 17:374-379.
24. Ferreira MP, Dini NP, Ferreira SP. Espaços e dimensões da pobreza nos municípios do Estado de São Paulo: Índice Paulista de Vulnerabilidade Social-IPVS. São Paulo Perspect 2006; 20:5-17.
25. Besag J, Kooperberg CL. On condiional and intrinsic autoregressions. Biometrika 1995; 82:733-746.
26. Kelsall JE, Wakeield JC. Discussion of ‘Bayesian models for spaially correlated disease and exposure data’. In: Bernardo JM, Berger JO, Dawid AP, Smith AFM, editors. Bayesian Staisics 6. Oxford: Oxford University Press; 1996. p. 131-156. 27. Gelfand AE, Smith AFM. Sampling-based approaches to calculaing marginal
densiies. J Am Stat Ass1990; 85:398-409.
28. Thomas A, Best N, Lunn D, Arnold R, Spiegelhalter D. GeoBUGS User Manual. Cambridge: Medical Research Council Biostaisics Unit; 2004.
29. Lunn DJ, Thomas A, Best N, Spiegelhalter D. WinBUGS - a Bayesian modelling framework: concepts, structure, and extensibility. Stat Comput 2000; 10:325-337. 30. Geweke J. Evaluaing the accuracy of sampling-based approaches to the calculaion of posterior moments (with discussion). In: Bernardo JM, Berger J, Dawid AP, Smith AFM, editors. Bayesian staisics 4. Oxford: Oxford University Press; 1992. p. 169-193.
31. Spiegelhalter DJ, Best NG, Carlin BP, Van der Linde A. Bayesian measures of model complexity and it (with discussion). JR Stat Soc Series B Stat Methodol 2002; 64:583-639.
32. Hawker JI, Bakhshi SS, Ali S, Farrington CP. Ecological analysis of ethnic diferences in relation between tuberculosis and poverty. BMJ 1999; 319:1031-1034. 33. Leung CC, Yew WW, Tam CM, Chan CK, Chang KC, Law WS, et al. Socio-economic factors and tuberculosis: a district-based ecological analysis in Hong Kong. Int J Tuberc Lung Dis 2004; 8:958-964.
34. Myers WP, Westenhouse JL, Flood J, Riley LW. An ecological study of tuberculosis transmission in California. Am J Public Health 2006; 96:685-690.
35. Marais BJ, Hesseling AC, Coton MF. Poverty and tuberculosis: is it truly a simple inverse linear correlaion? Eur Respir J 2009; 33:943-944.
36. Hino P, Santos CB, Villa TCS. Evolução espaço-temporal dos casos de tuberculose em Ribeirão Preto (SP), nos anos de 1998 a 2002. J Bras Pneumol 2005; 31:523-527. 37. Santos CB, Hino P, Cunha TN, Villa TCS, Muniz JN. Uilização de um Sistema de
Informação Geográica para descrição dos casos de tuberculose. Bol Pneumol Sanit 2004; 12:7-12.
38. Best N, Richardson S, Thomson A. A comparison of Bayesian spaial models for disease mapping. Stat Methods Med Res 2005; 14:35-59.
39. Randremanana RV, Richard V, Rakotomanana F, Sabaier P, Bicout DJ. Bayesian mapping of pulmonary tuberculosis in Antananarivo, Madagascar. BMC Infect Dis 2010; 10:21.
40. Souza WV, Carvalho MS, Albuquerque MF, Barcellos CC, Ximenes RA. Tuberculosis in intra-urban seings: a Bayesian approach. Trop Med Int Health 2007; 12:323-330. 41. Morgenstern H. Ecologic studies in epidemiology: concepts, principles, and
methods. Annu Rev Public Health 1995; 16:61
42. Piantadosi S. Invited commentary: ecologic biases. Am J Epidemiol 1994; 139: 761-764.
43. Pinto VS, Paula RAC, Parron Jr M. Ações da Força Tarefa no monitoramento do sistema de informações de tuberculose no Estado de São Paulo. Bol Pneumol Sanit 2006; 14:85-89.
44. Mota FF, Vieira-da-Silva LM, Paim JS, Costa MC. Spaial distribuion of tuberculosis mortality in Salvador, Bahia, Brazil. Cad Saude Publica 2003; 19:915-922. 45. Vieira RC, Prado TN, Siqueira MG, Dietze R, Maciel EL. Spaial distribuion of new