Cross-sectional Evaluation of Clinical Parameters to
Select High Prevalence Populations for Periodontal
Disease. The Site Comparative Severity Methodology
Sérgio Luís Scombatti de SOUZA Mario TABA Jr.
Department of Bucco-Maxillo-Facial Surgery and Traumatology and Periodontology, Faculty of Dentistry of Ribeirão Preto, University of São Paulo, Ribeirão Preto, SP, Brazil
Epidemiological studies have shown strong evidence that periodontal disease does not affect all subjects in the same manner. There are subjects and sites with higher risk for disease progression. This study tested parameters to select “a priori” sites and subjects potentially at risk. The data from periodontal clinical examinations of 2273 subjects was used. The clinical loss of attachment was measured in 6 sites per tooth. Using computer software, the patients were distributed into 14 age groups, with intervals of 5 years, from 11 years to greater than 75 years of age. The measure of each site was compared with the average and the median values of the subject age group, with the results indicating site comparative severity (SCS). Three global parameters were calculated: parameter 1 (P1) - percentage of sites with clinical attachment loss ≥ 4 mm; parameter 2 (P2) - percentage of sites with clinical attachment loss ≥ 7 mm; parameter 3 (P3) - percentage of sites with clinical attachment loss surpassing the median value for the age group by 100% or more. There were 1466 (65%) females and 807 (35%) males. Most subjects had P1, P2 and P3 values less than 30%. Parameter 3 allowed a division of the sample similar to that of Parameters 1 and 2, with the advantage of analyzing the subject in relation to his/her age group. It was suggested that the methodology of SCS is useful for selecting a population with a high disease prevalence, and that cut-off lines between 10% and 20% would be appropriate for using Parameter 3.
Key Words: cross-sectional studies, periodontitis/epidemiology, periodontitis/diagnosis, periodontal index.
Correspondence: Dr. Sérgio Luís Scombatti de Souza, Departamento de Cirurgia e Traumatologia Buco-Maxilo-Facial e Periodontia, Faculdade de Odontologia de Ribeirão Preto, USP, Av. do Café S/N, 14040-904 Ribeirão Preto, SP, Brasil. E-mail: [email protected]
INTRODUCTION
Early studies of experimental gingivitis showed dental plaque to be the main etiological factor of peri-odontal disease (1,2). These concepts also determined that periodontal treatment should be primarily based on the periodic removal of dental plaque. This would require periodic appointments for maintenance therapy at similar time intervals for all cases.
In the last 20 years, epidemiological studies have shown strong evidence that periodontal disease, de-fined as the loss of attachment and bone, does not affect all subjects in the same manner (3,4). There are subjects and sites of higher risk for disease progression. Further-more, research has shown that these subjects are a minority of the population, and that the majority of bone loss occurs early in life, mainly in the second and third decades (5).
As a result of this new knowledge, periodontal research has tried to map risk factors for the detection of sites and individuals with a higher tendency for disease progression. Many diagnostic parameters have been tested to assess periodontal risk, using different risk indicators and resulting in different predictive values of future destructive disease (6,7).
The predictive value of a diagnostic test is de-fined by the Bayes’s Theorem (8), by the mathematical formula:
P(D+/T+) = P(T+/D+) x P(D+)
P(T+/D+) x P(D+) + P(T+/D-) x P(D-)
the sensitivity of the diagnostic test. P(D+) = the preva-lence of disease, percentage of disease occurrence in a population. P(T+/D-) = probability of a positive diag-nostic test, if the disease is not present. This is the false positive fraction of the diagnostic test. P(D-) = preva-lence of the absence of disease, the percentage of non-diseased subjects in a population.
The predictive value is dependent on the quality of the diagnostic test as well as on the prevalence of the disease in the population. Using the same diagnostic test in two different populations, the first with high and the second with low prevalence of disease, will cer-tainly lead to different predictive values (with a small value in the population with the lowest prevalence) (9). Thus, there are strategies to obtain a higher diagnostic predictive value: a) increase the sensitivity of the diagnostic test (which is not possible in most cases); b) increase the prevalence of the disease (as-sessing previously selected populations with high preva-lence); c) associate different diagnostic tests.
The increase of the prevalence of disease can be obtained by the use of successive diagnostic tests to identify subjects or sites with disease activity. This investigation tested parameters that select “a priori” sites and subjects potentially at risk, in a cross-sectional study of the population, using a sample with high prevalence of disease.
MATERIAL AND METHODS
The computerized data bank used in this study has a complex structure, including general information (address, phone number, etc.), medical evaluation and clinical data of patients examined by two calibrated examiners in the periodontal clinic of the School of Dentistry of Bauru, University of São Paulo. The cali-bration procedures involved five previous sessions of calibration.
The data from 2273 patients used in this study included the age of the patient when the clinical exami-nation was performed, clinical attachment level loss (CAL), measured in mm from the bottom of the peri-odontal pocket to the cementoenamel junction at six sites per tooth: mesio-buccal (MB), center of buccal (CB), distal-buccal (DB), mesio-lingual (ML), center of lingual (CL) and distal-lingual (DL).
A computer software was developed to generate parameters to analyze the comparative severity of
peri-odontal status from sites and subjects, based on data previously described, creating a section of “Compara-tive Severity” in the patient’s periodontal clinical chart. The computer software divided the sample into 14 age groups, with 5 year intervals, from 11 years of age to more than 75 years of age. For each age group, the software also calculated the clinical chart of medi-ans site by site, according to the following steps: a) Beginning with the first age group (11-15 years of age), and the DB site of tooth 18 (maxillary right third molar), the software counted all the occurrences in which that measure was not empty, obtaining a Y value. b) All values of CAL related to this site and age group were organized in increasing order (position 1, position 2, etc.). The software then divided Y by 2, verifying if the number of occurrences was even or odd. If it was even, the following calculation was performed:
Median = value (position (Y/2) + value (position ((Y+2)/2))
2
If it was odd, the following calculation was performed:
Median = value (position ((Y+1)/2))
2
c) The median obtained was stored in the site DB of tooth 18 in the Median Clinical Chart, in that age group. The software then performed the calculation of the median of the next site, repeating all processes for the site DL up to tooth 48 (mandibular right third molar). d) After performing the Median Clinical Chart of one age group, the software calculated the next age group, until all 14 Median Charts were completed.
severity field it will be stored 200, indicating that clinical attachment loss of this site exceeded the corre-sponding median of the age group in 200% of its value. Following this example, the CB, MB and DL sites have the same CAL (values 2, 2, and 3 mm) as the values of the Median Chart. Thus, in the comparative severity fields, these sites have the value of 0 (zero), indicating that they are not greater or less than the median for that particular age group.
The site CL has a CAL value of 2 mm, which is 2 mm less than the corresponding value in the Median Chart. This difference represents 50% of the median value (4). Thus, in the field of site comparative severity, this site will have the value –50, indicating that it is 50% less than the median for the age group.
The site ML has 8 mm of CAL, and the median of the age group is 4, with a difference of 4 mm, or 100% of the median value, and 100 will be stored in the comparative severity field. The comparison between site ML and site DB shows the importance of working
with percentages: in both cases the CAL was 4 mm greater than the median, however this represents 200% more than the median in the DB site, but only 100% more in the ML site. The Comparative Severity Chart of this example is shown in Table 1.
After calculating the site comparative severity data, the computer software generated 3 parameters for analysis: P1 = percentage of sites with CAL equal to or greater than 4 mm; P2 = percentage of sites with CAL equal to or greater than 7 mm; P3 = percentage of sites with CAL surpassing the median for the age group by 100% or more (value ≥ 100 in the comparative severity of sites). Parameters 1 and 2 are cut-off lines that have already been used in epidemiologic and clinical re-search in Periodontology. Parameter 3 was the test parameter in this study. It differs from the others by comparing the subject to his/her age group, using the site comparative severity methodology.
The computer software generated a Compara-tive Severity page in the clinical chart of the patient with the following data: name of patient, date of birth, values of CAL, val-ues of comparative sever-ity of sites and parameters of the subject (P1, P2 and P3). It is important to re-member that the data of the Comparative Severity page were stored in the data bank designed by the software. These data (median chart and comparative severity of sites) will be automatically recalculated after data from every 500 new patients is stored in the data bank.
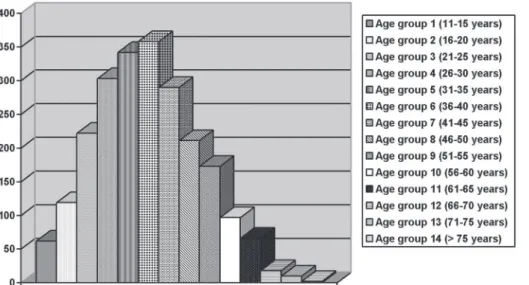
Figure 1. Sample distribution by age groups, in absolute numbers.
Table 1. Hypothetical example of the Comparative Severity Clinical Chart, comparing patient clinical data to the median of the respective age group.
Tooth 18 - Age of Patient: 22 years – Age Group 3
CAL of Patient Median Chart of Age Group 3 Comparative Severity Buccal Lingual Buccal Lingual Buccal Lingual
D C M D C M D C M D C M D C M D C M
Finally, the manner in which the parameters of subject analysis (P1, P2 and P3) divided the sample of 2273 patients was observed. The division of the sample by P1 and P2 was compared to that by P3.
RESULTS
There was a higher prevalence of females (1466; 64.5%) compared to males (807; 35.5%). Figure 1 shows the number of subjects in each age group. Age group 6 (36 to 40 years old) had the greatest number of subjects (358, representing 15.75% of the sample). The sum of age groups 4, 5, 6 and 7 (26-45 years old) totaled more than half of the sample (1293 patients, 56.89% of
the sample). These patients represented the subjects who, going into the third and fourth decades of life, have intensified or extension of periodontal disease.
Most of the patients (941, 41.40%) presented values of P1 ranging from 0 to 10%. Only 14.3% of the patients presented P1 greater than 50%. Table 2 shows the number of subjects with the different intervals of P1 in each age group. There was a tendency to increasing values of P1 with increasing age. In age group 1 (11-15 years old), more than 85% of the patients had a maxi-mum P1 of 10%, and none of them had a P1 over 50%. In age group 7 (41-45 years old), only 33.8% of the subjects had a P1 less than or equal to 10%, and 17.24% presented a P1 over 50%.
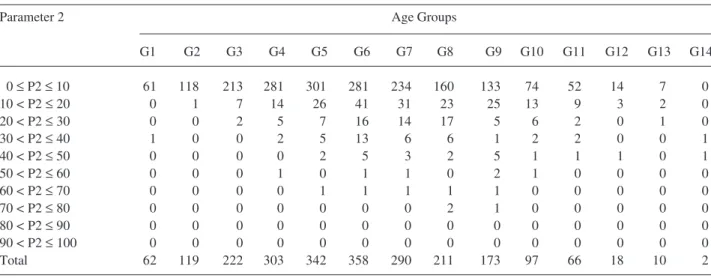
Table 3. Percentage values of Parameter 2 (% of sites with attachment loss ≥ 7 mm) by number of subjects, in the age groups 1 to 14.
Parameter 2 Age Groups
G1 G2 G3 G4 G5 G6 G7 G8 G9 G10 G11 G12 G13 G14 0 ≤ P2 ≤ 10 61 118 213 281 301 281 234 160 133 74 52 14 7 0 10 < P2 ≤20 0 1 7 14 26 41 31 23 25 13 9 3 2 0 20 < P2 ≤30 0 0 2 5 7 16 14 17 5 6 2 0 1 0 30 < P2 ≤40 1 0 0 2 5 13 6 6 1 2 2 0 0 1 40 < P2 ≤50 0 0 0 0 2 5 3 2 5 1 1 1 0 1 50 < P2 ≤60 0 0 0 1 0 1 1 0 2 1 0 0 0 0 60 < P2 ≤70 0 0 0 0 1 1 1 1 1 0 0 0 0 0 70 < P2 ≤80 0 0 0 0 0 0 0 2 1 0 0 0 0 0 80 < P2 ≤90 0 0 0 0 0 0 0 0 0 0 0 0 0 0 90 < P2 ≤100 0 0 0 0 0 0 0 0 0 0 0 0 0 0 Total 62 119 222 303 342 358 290 211 173 97 66 18 10 2 Table 2. Percentage values of Parameter 1 (% of sites with attachment loss ≥ 4mm) by number of subjects, in the age groups 1 to 14.
Parameter 1 Age Groups
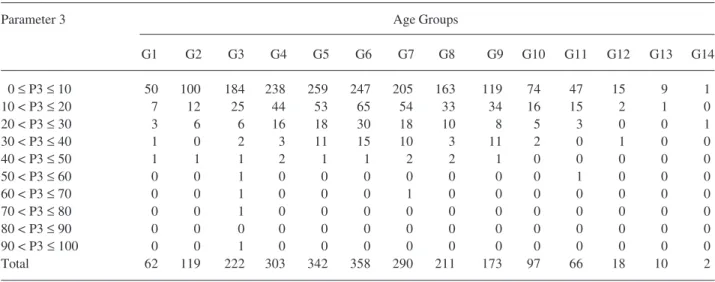
Table 4. Percentage values of Parameter 3 (% of sites with attachment loss surpassing the median value for the age group by 100% or more) by number of subjects, in the age groups 1 to 14.
Parameter 3 Age Groups
G1 G2 G3 G4 G5 G6 G7 G8 G9 G10 G11 G12 G13 G14 0 ≤ P3 ≤ 10 50 100 184 238 259 247 205 163 119 74 47 15 9 1 10 < P3 ≤20 7 12 25 44 53 65 54 33 34 16 15 2 1 0 20 < P3 ≤30 3 6 6 16 18 30 18 10 8 5 3 0 0 1 30 < P3 ≤40 1 0 2 3 11 15 10 3 11 2 0 1 0 0 40 < P3 ≤50 1 1 1 2 1 1 2 2 1 0 0 0 0 0 50 < P3 ≤60 0 0 1 0 0 0 0 0 0 0 1 0 0 0 60 < P3 ≤70 0 0 1 0 0 0 1 0 0 0 0 0 0 0 70 < P3 ≤80 0 0 1 0 0 0 0 0 0 0 0 0 0 0 80 < P3 ≤90 0 0 0 0 0 0 0 0 0 0 0 0 0 0 90 < P3 ≤100 0 0 1 0 0 0 0 0 0 0 0 0 0 0 Total 62 119 222 303 342 358 290 211 173 97 66 18 10 2
The great majority of the patients (1929 subjects, comprising 84.87% of the sample) had Parameter 2 less than or equal to 10%. Only 3.26% of the patients had P2 values greater than 30%. Table 3 shows the number of subjects with the different intervals of P2 in each age group. There was a small increase of P2 with age; however, it was less than the increase observed in P1. For example, in age group 2 (16-20 years old), more than 99% of the patients had P2 less than or equal to 10%, and none of them had P2 greater than 30%; in age group 9 (51-55 years old), the patients with P2 between 0 and 10% represented 76.88%, and only 5.78% of this group had P2 greater than 30%.
The majority of patients (1711 subjects, repre-senting 75.27% of the sample) had Parameter 3 values between 0 and 10%. Only 8.84% of the patients had P3 values over 20%, and only 3.39% had values greater than 30%. Table 4 shows these numbers in each age group. The tendency to increased P3 with age was smaller than that seen in P2 and P1. In age group 3 (21-25 years old), 82.88% of the patients had P3 values between 0 and 10%, and only 5.86% of the subjects had P3 values above 20%; in age group 10 (56-60 years), 76.29% of the patients still had P3 values less than or equal to 10%, and only 7.2% of this age group had P3 values above 20%.
DISCUSSION
The existence of groups with higher risk for
periodontal disease is well known. From the first epide-miologic studies in the 1970’s, culminating with many studies in the 1980’s, mainly in African and Asian populations, new concepts concerning the progression of destructive periodontal disease have been estab-lished (3,4,10): a) Loss of attachment does not affect all subjects in the same manner; b) There is no causal relationship between accumulation of plaque and rapid loss of attachment; c) The most destructive types of disease generally occur early in life, and are concen-trated in a minority group of subjects of the population with disease.
Systemic risk factors such as tabagism and dis-eases associated with immunosuppression (AIDS, im-munosuppressive drugs, leukocyte deficiencies, etc.) (11), and local factors, such as probing pocket depth, probing loss of attachment, plaque index, bleeding on probing, gingival redness, dental mobility and the pres-ence of caries or restorations (6,12), have been re-ported. For many years, a majority of dentists have associated the presence of plaque, gingival redness, bleeding on probing and suppuration as a risk for periodontal disease. However, these parameters, when tested scientifically, have shown to be of little use to predict future disease activity (11,12). The only consis-tent factor correlated with bone loss was loss of attach-ment (13).
mod-els that have been used to describe or predict disease activity are sufficiently precise or complete – the bio-logical complexity of periodontal status seems to sur-pass analysis methodology (15).
This study has put together knowledge about risk for periodontal disease and computerized resources to generate and test a new parameter for selection of a population with a high prevalence for disease. All sites of the patient were analyzed. The use of partial indexes, such as CPITN, has shown a tendency to over-evaluate the disease, especially in the youngest individuals, because it uses the worst situation in each quadrant (16).
Biological evaluation of a subject related to the presence or absence of a disease, in general, bases comparison of the condition of the subject with a pa-rameter that represents the value of a population with-out disease. In periodontal disease, there are no abso-lute values for normality, especially for systemic micro-biological parameters. Although there is strong evi-dence for associations between some situations and specific disease stages, the determination of health patterns for periodontal disease is extremely difficult due to numerous factors: a) Periodontal disease is locally specific; b) There is little association between the traditional clinical measures of plaque and bleeding indexes, gingival redness and suppuration and the pro-gression of disease (12,13); c) Errors in the measure-ment of periodontal conditions may hinder comparison, i.e., the variability of probing and the angulation of x-rays (17,18).
This indicates that research for a comparative methodology for analysis of periodontal disease should evaluate all sites, record six sites per tooth, critically evaluate traditional clinical parameters, and associate risk parameters. Thus, this study has tried to establish a comparison method that uses the most reliable clinical parameter, probing loss of attachment (19), evaluating the subject in relation to the sample population.
As cited previously, the groups of high risk for periodontal disease are a minority. When an analysis of the disease average among subjects is performed, the most compromised cases are diluted in the total sample, and the average is usually small. On the other hand, with an increase in age, this average tends to increase in a continuous and gradual manner. Therefore, compari-son of a patient’s loss of attachment cannot be related to the total sample, but only to subjects of similar age. In
this study, age groups with 5-year intervals were estab-lished that classified all subjects of the sample. The value of each patient’s site was then compared with the median of that site in the same age group. The expres-sion of the result of the comparison between the site value and the median was made in percentages, to better visualize the relationship between these two values, allowing the differentiation between the stages of the cases.
The organization of the comparative values site by site allowed the creation of a Comparative Severity page in the patient’s periodontal chart. This page also contained the parameters P1, P2 (both cut-off lines already reported in the literature) and P3 (a test param-eter) for each patient. Parameter 1 (percentage of sites with loss of attachment ≥ 4 mm) is associated with the progression of an early stage of disease to a moderate destructive stage. Parameter 2 (percentage of sites with loss of attachment ≥ 7 mm) is associated with the advanced stages of disease. Both are strict lines that do not take into account the analysis of the subject in relation to the sample. Parameter 3 (percentage of sites with loss of attachment surpassing the median for that age group by 100% or more) was the test parameter, and the way that it divided the sample was compared with the other two parameters.
The results of P1 and P2 were in agreement with many epidemiological studies (3,4,10) that point to a prevalence of more destructive periodontal disease up to 20%. An interesting fact is that the prevalence of severe periodontal stages, represented by high values of P2, was very small in all age groups, even though the studied population generally represents an economic and cultural status characterized by low income, poor oral hygiene habits, poor oral health method instruc-tions, and large quantities of dental plaque. These results are also in agreement with the literature (3,4,10,20), and reinforce the importance of subject susceptibility for disease progression.
Another important aspect to be considered is that, existing a tendency for increased P1 and P2 values with age, it is difficult to determine a strict cut-off value for diagnostic decision-making criteria. The maximum that could be obtained would be a table, with different cut-off lines for every age group, a method with no practical use for clinicians.
compares the subject with his/her age group. In this way, there is a possibility of determining a single cut-off line, valid for all age groups. The percentages obtained in this study allow us to suggest values of P3 from 10% to 20% as cut-off lines for selecting a popu-lation with a high prevalence for disease. This should be evaluated in future longitudinal studies that may also determine the predictable value of P3 in relation to future loss of attachment. The division of the sample made by P3 tends to be more specific than that made by P1 and P2, because it compares the patient with his/her age group, taking into account the intrinsic variations that aging causes in bone loss. The site is not compared with a single value “X” for all subjects, but with the value “Y” that was more prevalent in the specific age group; thus the parameter for comparison is singular-ized.
This methodology tends to increase accuracy due to two factors: a) increasing the number of subjects of the data bank and b) increasing the precision of the measures. The greater the number of patients with clinical examination in the data bank, the larger will be the group against which each patient’s site will be compared. In the same way, probing with more accu-racy (for example, using a pressure-controlled probe) tends to minimize measurement errors.
There is a consensus in research that determin-ing reliable methods, in terms of sensitivity and speci-ficity, to detect patients at risk for periodontal diseases will need the association of different parameters, such as clinical, microbiological, host response, etc., and the analysis of the results using computerized systems to be presented to the clinician. This study was limited to one clinical parameter to select a sample with a high preva-lence for disease. To determine the Predictive Value of the tested parameters it will be necessary to perform future longitudinal studies, although the results of this study suggest the possibility of testing P3 for that predictive capacity.
RESUMO
Estudos epidemiológicos mostraram fortes evidências de que a doença periodontal não afeta todos os indivíduos da mesma maneira. Existem indivíduos e sítios com maior risco de ocorrer progressão da doença. Este estudo testou parâmetros para a seleção “a priori” de sítios e indivíduos potencialmente de risco. Foram utilizados para tal os dados dos exames clínicos periodontais de 2273 pacientes. A perda de inserção clínica foi
medida em 6 sítios por dente. Usando um programa de computador, os pacientes foram distribuídos em 14 grupos etários, com intervalos de 5 anos, a partir dos 11 anos de idade e até acima de 75 anos. A medida de cada sítio foi comparada com a média e a mediana da faixa etária do indivíduo, com o resultado da comparação com a mediana indicando a comparação da severidade do sítio (CSS). Foram calculados três parâmetros globais do indivíduo: parâmetro 1 (P1) – porcentagem de sítios com perda de inserção clínica ≥ 4 mm; parâmetro 2 (P2) – porcentagem de sítios com perda de inserção clínica ≥ 7 mm; parâmetro 3 (P3) – porcentagem de sítios com perda de inserção clínica superando a mediana do grupo etário em 100% ou mais. A amostra tinha 1466 (65%) mulheres e 807 (35%) homens. A maioria dos indivíduos apresentou valores de P1, P2 e P3 menores que 30%. O parâmetro 3 permitiu uma divisão da amostra de forma similar àquela realizada por P1 e P2, com a vantagem de analisar o indivíduo em relação a seu grupo etário. Com base nos resultados, sugere-se que a metodologia da CSS possa ser útil na seleção de uma população de alta prevalência de doença, e que linhas de corte entre 10% e 20% seriam as mais apropriadas para o uso do parâmetro 3.
REFERENCES
1. Löe H, Theilade E, Jensen SB. Experimental gingivitis in man. J Periodontol 1965;36:177-187.
2. Theilade E, Wright WH, Jensen BS, Löe H. Experimental gingi-vitis in man. II. A longitudinal clinical and bacteriological inves-tigation. J Periodont Res 1966;1:1-13.
3. Baelum V, Fejerskov O, Karring T. Oral hygiene, gingivitis and periodontal breakdown in adult Tanzanians. J Periodont Res 1986;21:221-232.
4. Baelum V, Fejerskov O. Tooth loss as related to dental caries and periodontal breakdown in adult Tanzanians. Commun Dent Oral Epidemiol 1986;14:353-357.
5. Jenkins WMM, Kinane DF. The “high risk” group in periodonti-tis. Br Dent J 1989;167:168-171.
6. Badersten A, Nilvéus R, Egelberg J. Scores of plaque, bleeding, suppuration and probing depth to predict probing attachment loss. J Clin Periodontol 1990;17:102-107.
7. Kaldahl WB, Kalkwarf KL, Patil KD, Molvar MP. Relationship of gingival bleeding, gingival suppuration, and supragingival plaque to attachment loss. J Periodontol 1990;61:347-351. 8. Spiegelhalter DJ, Myles JP, Jones DR, Abrams KR. Bayesian
methods in health technology assessment: a review. Health Technol Assess 2000;4:1-130.
9. Greenstein G, Lamster I. Understanding diagnostic testing for Periodontal disease. J Periodontol 1995;66:659-666.
10. Loe H, Anerud A, Boysen H, Morrison E. Natural history of periodontal disease in man. Rapid, moderate and no loss of attachment in Sri Lankan laborers 14 to 46 years of age. J Clin Periodontol 1986;13:431-440.
11. Clarke NG, Hirsch RS. Personal risk factors for generalized peri-odontitis. J Clin Periodontol 1995;22:136-145.
12. Claffey N, Nylund K, Kiger R, Garret S, Egelberg J. Diagnostic predictability of scores of plaque, bleeding, suppuration and prob-ing depth for probprob-ing attachment loss. J Clin Periodontol 1990;17:108-114.
loss. J Clin Periodontol 1991;18:117-125.
14. Socransky SS, Haffajee AD, Goodson JM, Lindhe J. New con-cepts of destructive periodontal disease. J Clin Periodontol 1984;11:21-32.
15. Page RC, Derouen TA. Design issues specific to studies of peri-odontitis.J Periodont Res 1992;27:395-404.
16. Lewis JM, Morgan MV, Wright FAC. The validity of CPITN’s scoring and presentation method for measuring periodontal con-ditions. J Clin Periodontol 1994;21:1-6.
17. Gröndahl K, Gröndahl H, Webber RL. Influence of variations in projection geometry on the detectability of periodontal bone le-sions. A comparison between subtraction radiography and
con-ventional radiographic technique. J Clin Periodontol 1984;11:411-420.
18. Mullally BH, Linden GJ. Comparative reproducibility of proxi-mal probing depth using electronic pressure-controlled and hand probing. J Clin Periodontol 1994;21:284-288.
19. Theil EM, Heaney TG. The validity of periodontal probing as a method of measuring loss of attachment. J Clin Periodontol 1991;18:648-653.
20. Lembariti BS, Frencken JE, Pilot T. Prevalence and severity of periodontal conditions among adults in urban and rural Morogoro, Tanzania. Comm Dent Oral Epidemiol 1988;16:240-243.