*Correspondence: M. C. S. Matuo. Laboratório de Controle Biológico, De-partamento de Farmácia, Faculdade de Ciências Farmacêuticas, Universidade de São Paulo. Av. Prof. Lineu Prestes, 580 - Bloco 13 - Cid. Universitária - 05508-900 - São Paulo – SP, Brasil. E-mail address: [email protected]
A
rti
Pharmaceutical Sciences vol. 46, n. 3, jul./set., 2010
Evaluation of cytochrome P-450 concentration in
Saccharomyces cerevisiae
strains
Míriam Cristina Sakuragui Matuo*, Irene Satiko Kikuchi, Terezinha de Jesus Andreoli Pinto
Department of Pharmacy, Faculty of Pharmaceutical Sciences, University of São Paulo
Saccharomyces cerevisiae has been widely used in mutagenicity tests due to the presence of a cytochrome P-450 system, capable of metabolizing promutagens to active mutagens. There are a large number of S. cerevisiae strains with varying abilities to produce cytochrome P-450. However, strain selection and ideal cultivation conditions are not well deined. We compared cytochrome P-450 levels in four different S. cerevisiae strains and evaluated the cultivation conditions necessary to obtain the highest levels. The amount of cytochrome P-450 produced by each strain varied, as did the incubation time needed to reach the maximum level. The highest cytochrome P-450 concentrations were found in media containing fermentable sugars. The NCYC 240 strain produced the highest level of cytochrome P-450 when grown in the presence of 20 % (w/v) glucose. The addition of ethanol to the media also increased cytochrome P-450 synthesis in this strain. These results indicate cultivation conditions must be speciic and well-established for the strain selected in order to assure high cytochrome P-450 levels and reliable mutagenicity results.
Uniterms: Saccharomyces cerevisiae. Cytochrome P-450/obtention. Cytochrome P-450/cultivation conditions. Ethanol. Carbon sources.
Linhagens de Saccharomyces cerevisiae tem sido amplamente empregadas em testes de mutagenicidade devido à presença de um sistema citocromo P-450 capaz de metabolizar substâncias pró-mutagênicas à sua forma ativa. Devido à grande variedade de linhagens de S. cerevisiae com diferentes capacidades de produção de citocromo P-450, torna-se necessária a seleção de cepas, bem como a deinição das condições ideais de cultivo. Neste trabalho, foram comparados os níveis de citocromo P-450 em quatro diferentes linhagens de S. cerevisiae e avaliadas as condições de cultivo necessárias para obtenção de altas concentrações deste sistema enzimático. O maior nível enzimático foi encontrado na linhagem NCYC 240 em presença de 20 % de glicose (p/v). A adição de etanol ao meio de cultura também produziu um aumento na síntese de citocromo P-450. Estes resultados indicam que as condições de cultivo devem ser especíicas e bem deinidas para a linhagem selecionada, garantindo assim elevados níveis de citocromo P-450 e, conseqüentemente, a coniabilidade nos testes de mutagenicidade.
Unitermos:Saccharomyces cerevisiae. Citocromo P-450/obtenção. Citocromo P-450/condições de cultivo. Etanol. Fontes de carbono.
INTRODUCTION
Short-term screening tests for detecting mutagenic chemicals have been developed that do not involve the use of laboratory animals. One of the widely adopted assays is the mutagenicity test using Saccharomyces cerevisiae.
This yeast has an internal cell structure similar to that of
higher organisms, grows quickly, and is easily cultivated and manipulated by modern genetic techniques (Terziyska
employed in mutagenicity tests (Pellacani et al., 2006; Miadokova et al., 2008). In addition, other strains are also used as model organisms (Lichtenberg-Fraté et al., 2003).
The biological action of many chemicals is strictly dependent on high cytochrome P-450 levels (Buschini
et al., 2003). Therefore, the use of yeast cells with high cytochrome P-450 concentrations is required for reliable results. There are a large number of S. cerevisiae strains and the level of cytochrome P-450 production varies among them. Therefore, strain selection can be dificult, as is determining the ideal cultivation conditions necessary to obtain high cytochrome P-450 levels.
Previous studies have investigated factors that in-luence cytochrome P-450 content in S. cerevisiae, such as growth phase and glucose concentration (Wiseman
et al., 1975) as well as the substrate supporting growth (Kärenlampi et al., 1981). However, these studies were performed using different strains, leading to discrepancies among the results obtained (Kelly, Parry, 1983; Von Bors-tel et al., 1958). To the best of our knowledge, only one report has compared cytochrome P-450 levels produced by different strains (Kärenlampi et al., 1980). In the present study, cytochrome P-450 production was compared in four
S. cerevisiae strains (D7, NCYC 240, ATCC 2366, and ATCC 9080), and best cultivation conditions determined for obtaining cells with high cytochrome P-450 content.
MATERIALS AND METHODS
Yeast strains
The S. cerevisiae strains used in this study were: D7 (ATCC 201137), genetically modiied for detection of chemicals that induce mitotic crossover and mitotic gene conversion (Zimmerman et al., 1975); NCYC 240 (ATCC 44953), employed in previous studies of cytochrome P-450 induction (Wiseman et al., 1975; Kärenlampi et al., 1981); ATCC 9080; and ATCC 2366, reported in studies of cytochrome P-450 in ergosterol biosynthesis (Hata et al., 1981) and with antineoplastic agents (Delitheos et al., 1995), respectively.
D7 and NCYC 240 strains were purchased from the American Type Culture Collection (Manassas, VA). ATCC 9080 and ATCC 2366 were kindly donated by the National Institute of Quality Control in Health (Rio de Janeiro, Brazil). The strains were maintained on slants of Sabouraud dextrose agar.
Culture conditions and growth curves
The ATCC 9080 and 2366 strains were inoculated
(105 cells mL-1) in 100 mL of liquid growth media and
incubated in a water bath orbital shaker at 120 rpm, 30 oC
for up to 48 h. The media contained the following: 1 % (w/v) yeast extract, 2 % (w/v) peptone, 0.5 % (w/v) NaCl (Blatiak et al., 1987). Carbon sources were added to the media at inal concentrations of 2 % and 20 % (w/v) in se-parate experiments. The carbon sources were: D-glucose, D-galactose, sucrose, D-mannose, maltose, D-fructose, lactose, and glycerol. The effect of ethanol on cytochrome P-450 concentration was evaluated for the NCYC 240 strain. Ethanol, at a inal concentration of 2 % (v/v), was added to media containing 2 % and 20 % (w/v) glucose, and incubated in sealed flasks in a water bath orbital shaker as described above. For growth curves, samples were harvested at different times and the number of viable cells determined by plating on Sabouraud dextrose agar incubated at 30 oC for 48 h.
Cytochrome P-450 determination in whole cells
Cells were harvested at different times during the exponential phase, washed twice with 0.1 M phosphate buffer pH 7.4, and resuspended in the same buffer. The cell concentration was adjusted to 109 cells mL-1. Cytochrome
P-450 was determined directly in whole cells (Buschini
et al., 2003; Stansfield, Kelly, 1996) by the method of Omura and Sato (1964). Approximately 5 mg mL-1 of
sodium dithionite was added to each cell suspension and the baseline of between 390 and 500 nm recorded using a Beckman Coulter model DU 640 (Fullerton, CA) spec-trophotometer. Carbon monoxide was bubbled through the sample cuvette for 20 seconds and after 2-3 minutes the scan was repeated. The concentration of cytochrome P-450 was calculated by the difference between absorption peaks at 450 nm and 490 nm. An extinction coeficient of 91 cm-1mM-1 was used. The experiments were performed
at least three times, and the data presented in the igures are expressed as mean values. The statistical analysis was performed by analysis of variance (ANOVA). Mean values were considered signiicantly different at P<0.05.
RESULTS
Inluence of carbon source on cytochrome P-450 level
D-galactose, maltose, and sucrose. In contrast, lactose, glycerol, and D-fructose promoted lower cell growth (Table I). Based on the growth curves, the utilization of different carbon sources by the yeast was compared and
the exponential growth phase was determined. Cyto-chrome P-450 determinations were performed during the logarithmic growth phase (Wiseman et al., 1975) when maximum levels were reached.
FIGURE 1 - Growth curves of S. cerevisiae strains ATCC 9080 (A) and ATCC 2366 (B) grown in different carbon sources, at
concentrations of 2 % (w/v).
TABLE I - Maximum cell growth of S. cerevisiae at end of exponential growth phase
Carbon source S. cerevisiae ATCC 9080 (CFU mL-1)* S. cerevisiae ATCC 2366 (CFU mL-1)*
Monosaccharides
Glucose (2.0 ± 1.4) x 108 (1.1 ± 0.1) x 108
Fructose (1.1 ± 0.1) x 107 (9.9 ± 1,0) x 106
Mannose (2.3 ± 0.2) x 108 (2.1 ± 0.3) x 108
Galactose (2.2 ± 0.4) x 108 (2.0 ± 1.4) x 108
Disaccharides
Sucrose (1.6 ± 0.3) x 108 (1.3 ± 0.1) x 108
Maltose (2.4 ± 0.1) x 108 (2.5 ± 1.2) x 108
Lactose (2.5 ± 0.5) x 107 (2.9 ± 0.8) x 107
Others
Glycerol (1.7 ± 0.3) x 107 (6.1 ± 0.7) x 107
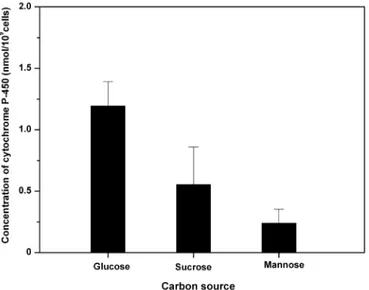
The ATCC 9080 strain was cultured in media containing 2 % (w/v) D-glucose or sucrose (strongly fermentable sugars), 2 % (w/v) D-mannose (respiration and fermentation simultaneously), and 2 % (w/v) glycerol (non-fermentable carbon source) until the end of the expo-nential growth phase was reached (12 h of incubation). The highest cytochrome P-450 level was found in cells grown in the presence of fermentable carbon sources (Figure 2).
Cytochrome P-450 levels in different
Saccharomyces cerevisiae strains
Growth curves and cytochrome P-450 concentra-tions were determined for different S. cerevisiae strains, cultured in media containing low and high glucose
con-centrations of 2 % and 20 % (w/v), respectively (Figure 3). Table II shows the maximum cytochrome P-450 con-centrations obtained from each strain.
In the ATCC 9080 strain cultured in low glucose media, the maximum cytochrome P-450 level in the low glucose media was obtained after 12 h of incubation, ma-rking the end of exponential growth (Figure 3a). This level fell sharply when the cells entered the stationary phase. The increase in glucose concentration (from 2 % to 20 %) caused a slight increase in the inal cell population. Although the cellular mass was higher at 20 % glucose than in 2 % gluco-se, the level of cytochrome P-450 did not differ signiicantly (P= 0.18). However, the exponential growth phase was extended at the high glucose concentration. Consequently, the incubation time to reach the maximum cytochrome P-450 level changed from 12 h in 2 % glucose to 24 h in 20 % glucose. Similar effects occurred in the ATCC 2366 and D7 strains (Figure 3b-c). No significant difference was observed between the maximum cytochrome P-450 concentrations in 2 % and 20 % glucose in the ATCC 2366 (P=0.19) or D7 (P=0.05) strains. In the NCYC 240 strain (Figure 3d) however, the higher glucose concentration (2 % to 20 %) elevated the cytochrome P-450 level (P=0.04).
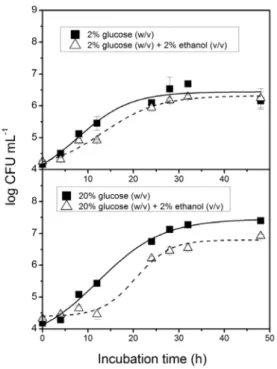
Effect of ethanol on cytochrome P-450 concentration
The effect of the addition of ethanol to media on cytochrome P-450 concentration was evaluated in the NCYC 240 strain. Figure 4 shows the growth curves and Figure 5 shows the cytochrome P-450 concentrations obtained for the NCYC 240 strain cultured in media containing 2 % and 20 % (w/v) glucose, in the presence and absence of 2 % (v/v) ethanol. Cells were harvested at different intervals during growth. Cytochrome P-450
FIGURE 2 - Cytochrome P-450 production by S. cerevisiae
strain ATCC 9080 cultured for 12 h in media containing glucose, sucrose, and mannose, at concentrations of 2 % (w/v).
TABLE II - Maximum cytochrome P-450 concentrations in S. cerevisiae strains cultured in 2 % (w/v) and 20 % (w/v) glucose
Strain Glucose
(%, w/v) Maximum cytochrome P-450 level (nmol/109cells) Incubation time* (h)
ATCC 9080 2 1.26 12
20 1.31 24
ATCC 2366 2 0.95 10
20 1.10 12
D7 2 1.07 16
20 1.24 24
NCYC 240 2 1.94 20
20 2.47 28
FIGURE 3 - Growth curves and cytochrome P-450 concentrations of different Saccharomyces cerevisiae strains cultured in media
production was signiicantly increased by the addition of ethanol to the media containing 2 % glucose (P=0.008). However, this effect was not observed in cells cultured in 20 % glucose with addition of 2 % ethanol (P=0.59).
DISCUSSION
The S. cerevisiae cultivation conditions were ini-tially evaluated for the ATCC 9080 and ATCC 2366 strains commonly found in Brazil. In the presence of different carbon sources, these strains presented similar growth, as evaluated by the cellular mass obtained (Table I). Moreo-ver, the growth curves of the ATCC 9080 and ATCC 2366 strains showed growth was higher in cells cultured in me-dia containing strongly fermentable sugars (D-glucose and sucrose) and in the presence of D-mannose, D-galactose, and maltose, where fermentation and respiration occur concomitantly (Figure 1). Therefore, cytochrome P-450 determination was performed in cells cultured in D-gluco-se, D-mannoD-gluco-se, sucroD-gluco-se, and glycerol, selected according to the carbohydrate utilization of the yeast.
Our results indicated that although growth rates were very similar, cytochrome P-450 levels varied according to the type of sugar utilized as the carbon source. As shown in Figure 2, the ATCC 9080 strain produced the highest cytochrome P-450 levels in the presence of glucose and sucrose. In cells cultured in media containing D-mannose, cytochrome P-450 was also produced albeit at lower le-vels. However, in the presence of glycerol, no cytochrome P-450 was detected. These results corroborate those of Kärenlampi et al. (1981), who demonstrated cytochrome P-450 was produced when cells were grown in sugars whose degradation proceeds via fermentation.
Since glucose was capable of promoting high cellular mass and inducing high cytochrome P-450 levels, this sugar was employed in the evaluation of cytochrome-P450 pro-duction by different strains. Wiseman et al. (1975) demons-trated that cytochrome P-450 reaches maximum concentra-tion at the end of the exponential growth phase. However, our data evidenced that slight changes in the incubation time needed to reach the maximum level can occur depending on the strain. In the ATCC 2366 strain cultured in 2 % glucose (Figure 3b), determinations performed at the beginning (6 h) and middle (8 h) of the exponential phase and during the stationary phase (12 h and 16 h) resulted in very low cyto-chrome P-450 levels (not detectable). Cytocyto-chrome P-450 was only detected at 10 h of incubation, corresponding to the end of exponential growth phase. However, in 20 % glucose, the maximum concentration was found during the exponential growth phase at 12 h of incubation. The opposite occurred with the D7 strain (Figure 3c) where in 2
FIGURE 4 - Growth curves of S. cerevisiae strain NCYC 240
cultured in media containing 2 % (w/v) and 20 % (w/v) glucose, in the presence and absence of 2 % ethanol (v/v).
FIGURE 5 - Cytochrome P-450 concentrations of S. cerevisiae
% glucose, this strain produced the maximum cytochrome P-450 level at the end of the exponential growth phase (16 h of incubation). In high glucose concentration (20 %) ho-wever, the cytochrome P-450 peak appeared when cells had already entered the stationary phase. These results indicate that the maximum level of cytochrome P-450 occurs in a short and speciic period of growth, not necessarily at the end of the exponential growth phase, and depends on the cultivation conditions and strain tested.
The production of cytochrome P-450 can be inluen-ced by glucose concentration, depending on the characte-ristics of the S. cerevisiae strain. These differences among strains may account for the discrepancies in results obtained by several authors. Our data also suggests the capacity to maintain high amounts of cytochrome P-450 varies among the strains. As shown in Figure 3a – d, the NCYC 240 and D7 strains cultured in 20 % glucose were able to maintain high cytochrome P-450 levels longer, in comparison to ATCC 2366 at the same glucose concentration.
The cytochrome P-450 concentrations found in S. cerevisiae strains cultured in 2 % and 20 % glucose are summarized in Table II. Incubation time to reach ma-ximum cytochrome P-450 levels, the effect of glucose concentration, and cytochrome P-450 levels produced, differed among the strains. In our experiments, the ATCC 9080, ATCC 2366, and D7 strains produced similar levels of cytochrome P-450 even in the presence of high glucose concentration. The maximum level produced by these strains was around 1.0 nmol/109 cells. In contrast, the
concentration of cytochrome P-450 in the strain NCYC 240 was approximately two-fold higher, making it a good source of cytochrome P-450.
The regulation of cytochrome P-450 levels in S. cerevisiae has not been well elucidated. However, several studies have examined the mechanisms underlying cyto-chrome P-450 accumulation. One hypothesis holds that accumulation of cytochrome P-450 is caused by a catabo-lite of the sugar, or an effector generated by this catabocatabo-lite (Buschini et al., 2003). Other reports have suggested that ethanol is the catabolite involved in the control of cyto-chrome P-450 content, inducing its production (Blatiak
et al., 1987; Morita, Mifuchi, 1984). The fermentative capacity, as well as the amount of metabolites produced, is an inherent characteristic of each strain. If ethanol, pro-duced during fermentation, can induce the accumulation of cytochrome P-450, then strains with higher fermentative capacity should be able to produce high cytochrome P-450 levels. Thus, the higher cytochrome P-450 concentration produced by strain NCYC 240 is possibly due to its higher fermentative capacity.
Ethanol induction of cytochrome P-450 was
evalua-ted in the NCYC 240 strain which produced higher levels of cytochrome P-450 than the other strains studied. Etha-nol is known to cause toxic effects on yeast cells, including inhibition of growth and viability (Walker, 1998). This toxicity was observed in cells cultured in 2 % and 20 % glucose with addition of 2 % ethanol (Figure 4). Although the growth rates were lower in the presence of ethanol, the levels of cytochrome P-450 were higher in cells grown in ethanol and 2 % glucose (Figure 5). This enhancement of cytochrome P-450 by ethanol may be explained by changes in the yeast physiology in response to ethanol to-xicity, such as acceleration of ergosterol biosynthesis and increase in ethanol metabolism (Walker, 1998). Previous studies have suggested involvement of cytochrome P-450 in ergosterol biosynthesis (Hata et al., 1981; Ayoama et al., 1984),thus an increase in ergosterol biosynthesis by the addition of ethanol to media may induce cytochrome P-450 production in yeast. In contrast, cells cultured in 20 % glucose did not present changes in cytochrome P-450 levels with the addition of ethanol to the media (Figure 5). One possible explanation for this result is that the high fermentation rate in the presence of 20 % glucose led to a higher ethanol level. Del Carratore et al.(1984)reported that ethanol concentrations above 3 % in media lead to a decrease in cytochrome P-450 concentrations. Thus, as the initial ethanol concentration in the media was 2 %, an increase in this concentration could have made the media unsuitable for cytochrome P-450 synthesis.
Our results showed that the conditions required to ob-tain S. cerevisiae cells with a high cytochrome P-450 level are speciic for each strain. Thus, growth conditions must be evaluated in detail and established speciically for the strain selected as the model organism. Given the variations in cytochrome P-450 production, the choice of strain should be considered carefully, so as to select organisms with high cytochrome P-450 content. Our study indicated that the NCYC 240 strain is capable of producing high cytochrome P-450 levels and that cytochrome P-450 production can be increased by cultivation in the presence of 2 % glucose and 2 % ethanol for a 28 h-incubation period at 30 oC and
120 rpm. Under these conditions, the cytochrome P-450 concentration reached by the NCYC 240 strain was around 2.98 nmol/109 cells. Our data suggests the NCYC 240 strain
is capable of producing high cytochrome P-450 levels and that its potential should be investigated further.
ACKNOWLEDGEMENTS
REFERENCES
AYOAMA, Y.; YOSHIDA, Y.; SATO, R. Yeast cytochrome P-450 catalyzing lanosterol. 14 α-lanosterol metabolism by puriied P-450 14DM and by intact microsomes. J. Biol. Chem., v.259, p.1661-1666, 1984.
BLATIAK, A.; KING, D. J.; WISEMAN, A.; WINKLER, M. A. Cytochrome P-450 accumulation and loss as controlled by growth phase of Saccharomyces cerevisiae: relationship to oxygen, glucose and ethanol concentrations. J. Gen. Microbiol., v.133, p.1053-1059, 1987.
BUSCHINI, A.; POLI, P.; ROSSI, C. Saccharomyces cerevisiae as an eukaryotic cell model to assess cytotoxicity and genotoxicity of three anticancer anthraquinones. Mutagenesis, v.18, p.25-36, 2003.
DEL CARRATORE, R.; MORGANTI, C.; GALLI, A., BRONZETTI, G. Cytochrome P-450 inducibility by ethanol and 7-ethoxycoumarin o-deethylation in Saccharomyces cerevisiae. Biochem. Biophys. Res.Commun., v.123, p.86-193, 1984.
DELITHEOS, A.; KARAVOKYROS, I.; TILIGADA, E. Response of Saccharomyces cerevisiae strains to antineoplastic agents. J. Appl.Bacteriol., v.79, p.379-383, 1995.
HATA, S.; NISHINO, T.; KOMORI, M.; KATSUKI, H. Involvement of cytochrome P-450 in ∆22 – denaturation in
ergosterol biosynthesis of yeast. Biochem. Biophys. Res. Comm., v.103, p.272-277, 1981.
KÄRENLAMPI, S.O.; MARIN, E.; HÄNNINEN, O.O.P. Occurrence of cytochrome P-450 in yeasts. J. Gen. Microbiol., v.120, p.529-533, 1980.
KÄRENLAMPI, S.O.; MARIN, E.; HÄNNINEN, O.O.P. Effect of carbon source on the accumulation of cytochrome P-450 in the yeast Saccharomyces cerevisiae.Biochem. J., v.194, p.407-413, 1981.
KELLY, D.; PARRY, J.M. Metabolic activation of cytochrome P-450/P-448 in the yeast Saccharomyces cerevisiae. Mutat. Res., v.108, p.147-159, 1983.
LICHTENBERG- FRATÉ, H.; SCHMITT, M.; GELLERT, G.; LUDWIG, J. A yeast-based method for the detection of cyto and genotoxicity. Toxicol. in vitro, v.17, p.709-716, 2003.
MIADOKOVA, E.; NADOVA, S.; VLCKOVA, V.; DUHOVA, V., KOPASKOVA, M.; CIPAK, L.; RAUKO, P.; MUCAJI, P.; GRANCAI, D. Antigenotoxic effect of extract from Cynara cardunculus L. Phytother. Res., v.22, p.77-81, 2008.
MORITA, T.; MIFUCHI, I. Ethanol enhancement of cytochrome P-450 content in yeast, Saccharomyces cerevisiae D7. Chem. Pharm. Bul., v.32, p.1624-1627, 1984.
OMURA, T.; SATO, R. The carbon monoxide-binding pigment of liver microsomes. J. Biol. Chem., v.239, p.2370-2378, 1964.
PELLACANI, C.; BUSCHINI, A.; FURLINI, M.; POLI, P.; ROSSI, C. A battery of in vivo and in vitro tests useful for genotoxic pollutant detection in surface waters. Aquat. Toxicol., v.77, p.1-10, 2006.
STANSFILED, I.; KELLY, S.L. Puriication and quantiication of Saccharomyces cerevisiae cytochrome P-450. Methods Mol. Biol., v.53, p.355-367, 1996.
TERZIYSKA, A.; WALTSCHEWA, L.; VENKOV, P. A new sensitive test based on yeast cells for studying environmental pollution. Environ. Pollut., v.109, p.43-52, 2000.
VON BORSTEL, R.C.; O`CONNELL, D.F.; METHA, R.D.; HENNIG, U.G.G. Modulation in cytochrome P-420 and P-450 content in Saccharomyces cerevisiae according to physiological conditions and genetic background. Mutat. Res., v.150, p.217-224, 1985.
WALKER, G.M. Yeast physiology and biotechnology. 1.ed. New York: John Wiley & Sons Inc., 1998. 350 p.
WISEMAN, A.; LIM, T.K.; McCLOUD, C. Relationship of cytochrome P-450 to growth phase of brewer’s yeast in 1 % - or 20 % - glucose medium. Biochem. Soc. Trans., v.3, p.276-278, 1975.
ZIMMERMANN, F.K.; KERN, R.; RASENBERGER, H. A yeast strain for simultaneous detection of induced mitotic crossing over, mitotic gene conversion and reverse mutation. Mutat. Res., v.28,p.381-388, 1975.
Received for publication on 16th January 2009