Study of the block/grout interface in concrete and clay
block masonry structures
Estudo da interface bloco/graute em alvenaria de blocos
cerâmicos e de concreto
Abstract
Resumo
This work aims to study the behavior of the block/grout interface for concrete and clay block masonry. This was achieved by push-out and pull-out experimental tests including reinforcement bar in the latter one. The experimental result showed that there is a good bond between the
con-crete blocks internal faces and the grout, enough to prevent inill-slippage, and that the whole tensile strength of the usual reinforcement bars is
achieved provided they are properly anchored. Nevertheless, for clay blocks there is a low bond between the clay blocks internal faces and the
grout, allowing the inill-slippage before the reinforcement bars reach their yield stress.
Keywords: block/grout interface, bond stress, compressive strength, bond strength, grouting.
Este trabalho objetiva o estudo do comportamento da interface bloco/graute em alvearia de blocos cerämicos e de concreto. Tal objetivo foi al-cançado com ensaios laboratoriais de empurramento e arrancamento, sendo estes útimos com a inclusão de barras de armadura. Os resultados
experimentais mostraram que existe uma boa aderência entre as faces internas dos blocos de concreto e o graute, suiciente para evitar o seu
deslizamento, e que as barras de aço atingem a sua resistência última de tração, desde que devidamente ancoradas no graute. No entanto, no caso dos blocos cerâmicos, ocorre uma baixa aderência entre o graute e as faces internas do bloco, podendo levar a um deslizamento do graute antes que as barras de aço atinjam a sua resistência ao escoamento.
Palavras-chave: interface bloco/graute, aderência, resistência à compressão, resistência de aderência, grauteamento.
a Department of Civil Engineering, Federal University of Tocantins, Palmas, TO, Brazil;
b Department of Structural Engineering, School of Engineering of São Carlos, University of São Paulo, São Carlos, SP, Brazil.
Received: 20 Mai 2016 • Accepted: 23 Feb 2017 • Available Online: 27 Jul 2017
O. S. IZQUIERDO a
M. R. S. CORRÊA b
I. I. SOTO a
1. Introduction
Two types of bond should be considered when evaluating the per-formance of reinforced masonry: the bond between reinforcing steel and grout, and the bond between the grout and the internal faces of the unit. The bond which can be developed between the reinforcement and the surrounding grout is a complex phenome-non which is dominated by the interlocking action of the reinforcing bar ribs in the grout mass. However, the bond between the grout and the surrounding masonry unit is primarily limited by the adhe-sion formed at the interface [1].
The slippage mechanism between the contact surfaces is similar to the phenomenon of the bond between rebar and grout. In both
cases, the bond strengths are inluenced by the microscopic and macroscopic irregularities of the contact surfaces. Grout ills the
micro or macro cavities, forming imbrication points that mechani-cally constrain the slippage. The bond loss is related to the ab-sence or destruction of these imbrication points [2].
There are not many research reports on the study of block/grout interface of structural masonry.
Pereira de Oliveira [3] researched the relationship between the block/grout bond strength and the compressive masonry strength of concrete block. For that, the author studied several types of
grouts varying the water/cement ratio and the speciic area of the
aggregates. This study showed that the grout bond strength is im-proved with the decrease of the water/cement ratio and that this
strength increases when increasing the speciic area of the aggre -gates until a maximum point and then decreases. The compressive masonry strength is raised by an improvement of the bond capac-ity between the concrete block and grout.
Biggs [4] tested mortar as a substitute for grout in reinforced ma-sonry by testing the pull-out strength of reinforcement embedded in mortar. The author compared the performance of two-concrete-half-block prisms (406.4 mm high) containing reinforcing bars
in-serted in grout or mortar inills. Four types of mortar inill and two
types of grout were studied. Although the results show that the
grout samples present a higher failure load than the mortar inill
samples, the author concluded that Portland cement-lime based mortar has the potential to be an acceptable alternative for grout in reinforced masonry. Some of the results of Biggs[4] will be com-pared to those obtained in the present work.
Soric and Tulin [1] studied the bond between the reinforcement re-bar and the grout, and the bond between the grout and the masonry
units. The bond strength between the grout inill and the concrete
unit was determined by push-out tests. The specimens consisted of a single half block, fully grouted, to which a compressive load was applied at the top surface of the grout through a bearing plate while the block was supported only around its masonry shell. The bond stress at failure was determined by dividing the maximum applied load by the area of the interface surface of the masonry unit. The average bond stress obtained from push-out tests was of approximately 1.52 MPa. The authors suggest that more testing
should be performed for the deinitive characterization.
Soric and Tulin [5] studied the reinforced masonry bond applying experimental pull-out tests in specimens of concrete and clay blocks with the presence of reinforcement bars. This bond stress depends on the ribbed bar pattern, the applied load, the embedment length,
and the grout characteristics. Two types of block materials (concrete and clay) and two rebar diameters (12.5 mm and 16 mm) were test-ed, also varying the embedment length. They concluded that the behavior of the clay masonry units specimen and reinforced with 12.5 mm bars was similar to those made with concrete masonry units. The specimen reinforced with 16 mm rebar and constructed of clay masonry units reached a maximum stress equivalent to 25% of the yield stress of the steel bar, while the concrete unit specimen reached 50% of the steel bar yield stress.
Ahmed and Feldman [6] rated the contact and noncontact lap splices in concrete block masonry construction. Contact and non-contact lap splices, where the lapped bars were located in adjacent cells, were tested in both double pullout and wall splice concrete block specimens. Visual observations of the incurred damage were also reviewed to identify the resulting failure modes. A statistically
signiicant diference was found between the results of the double
pullout and wall splice specimens with the same reinforcing
ar-rangements, and for the diferent reinforcing arrangements in the
same specimen type. Specimens with contact lap splices failed due to bar pullout. Evidence of bond loss at the grout–block inter-face was observed for specimens with noncontact lap splices and
appeared to have inluenced the resulting failure mode and lap
splice resistance.
Camli and Binici [7] studied the bond strength of carbon iber re -inforced polymers bonded to concrete and masonry. The study presents the results of 57 double shear push-out tests conducted to
determine the strength of carbon iber reinforced polymers (CFRPs) bonded to concrete prisms and hollow clay tiles that are inished with and without plaster. In the experimental program, diferent types
of anchorage methods were tested in a double shear push-out test setup. It was found that strength of CFRPs bonded to hollow clay
tiles are signiicantly lower than CFRPs bonded to concrete. Lower
bond strengths were observed for hollow clay tile specimens due to weak tile texture and discontinuities on the tile surface.
Aiello and Sciolti [8] made a bond analysis of masonry structures strengthened with CFRP sheets. The study has been carried out
on naples tuf and leccese stone specimens reinforced with FRP
sheets, glued onto the surface of the stones. It was observed that the bond stress-slip law proposed by reference [9], referring to FRP reinforced concrete structures, could be appropriate for predicting the interface behavior of FRP strengthened masonry structures.
The author concluded that the maximum bond strength, τmax, is mainly afected by the properties of the substrate, being higher for
specimens made by leccese stone, by about 50%, with respect
to the values registered for the naples tuf. In this case, in fact, the lexural strength of the substrate is the main determining pa -rameter, considering that the debonding started at the loaded end, within the substrate layer.
1.1 Justiication
(0.5 σy). This is an indirect way of limiting the shear stress at the
interface grout/unit. This request is relevant for high rise buildings
(buildings with 20 loors in structural masonry are not unusual in Brazil. Therefore, the present study is justiied mainly because the
need to establish such limits.
Thus, the main objective of this paper is to study the behavior of the block/grout interface in concrete and clay blocks, by means of experimental “push-out” and “pull-out” tests.
2. Materials and experimental program
The experimental program studied the masonry behavior using push-out specimens to determine the bond strength between the grout and the concrete unit, and pull-out specimens to study the behavior of the interface of the grout/block/reinforcement set. Two types of block materials (concrete and clay), two types of grout (large and small compressive resistance) and two rebar di-ameters (12.5 mm and 16 mm) were considered. These labora-tory tests were preceded by a set of materials characterization tests, and additional tests to verify the roughness of the unit and
inill surfaces.
2.1 Push-out test
The push-out specimens consisted of a single concrete block with one of its cavities completely grouted. The salient grout from the surface of the block at a distance of 30 mm was loaded in compression through a bearing plate at the top surface, while the block was supported only around the perimeter of the unit shells at the bottom surface. The bond stress at failure was calculated by dividing the maximum applied load by the area of the interface surface between the grout and the masonry unit, when slippage was evident. Figure 1 shows the nominal dimensions of the push-out specimens.
The structural concrete blocks have conic holes, that is, the webs have varying thickness along the height. The results shown in this
work correspond to the situation in which the greater thicknesses are facing up with the load applied down. Therefore, it favors safety. Two types of grout were studied. Grout G14 with a low compres-sive strength (14 MPa) and high water/cement ratio (0.95) and grout G30 with high compressive strength (30 MPa) and low wa-ter/cement ratio (0.65). Note that the grout denominations are not
standard, used here to point out the main diference between the
two types.
Two series were used for testing the push-out specimens, depend-ing on the grout type.
2.2 Pull-out
The pull-out specimens of concrete blocks were built with ive
concrete blocks in stack bond formation, with one of their cavities completely grouted and with a reinforcement rebar embedded in
the grout. The irst 4 blocks were grouted, leaving the last empty
block for support. The pull-out clay block specimens were built with four concrete blocks in stack bond. The 4 blocks were grouted. The reinforcement rebar was subjected to a tensile load in order to study the grout/block/reinforcement set. Figure 2 shows the nomi-nal dimensions of the pull-out specimens.
Those specimens had diferent types of grout (grout G14 and grout
G30) and rebar diameters (12.5 mm and 16 mm). Four series were built with 6 specimens for each series:
n Series G14S12: Grout G14 and rebar diameters 12.5 mm; n Series G30S12: Grout G30 and rebar diameters 12.5 mm; n Series G14S16: Grout G14 and rebar diameters 16 mm; n Series G30S16: Grout G30 and rebar diameters 16 mm. Complementary tests were carried out to characterize the mason-ry: compressive strength testing of cylindrical mortar specimens,
cylindrical grout specimens and units. They were rectiied to obtain
regular and smooth surfaces. The rebars were subjected to tensile strength tests. The internal surfaces of units and grout were also tested for roughness, since that property determines the expected
diferences in bond related to imbrication points.
Figure 1
Nominal dimensions of the push-out specimens of: concrete block (a) and clay block (b) (in mm)
Load
140
19
0
390
140
390
19
0
Load
B
B
B
2.3 Specimen types
The designation describes the specimen coniguration. For exam -ple, Co10G14S12 means: Co10 (or Co26 or Cl10) = concrete (or clay) masonry units of 10 or 26 MPa compressive strength; G14 (or G30) = grout of 14 MPa compressive strength (or grout of 30 MPa); S12 (or S16) = 12.5 mm (or 16.0 mm) steel bar diameter.
2.4 Materials and their properties
The cement and lime used in this study were CP II Z and CH III, re-spectively. According to the Brazilian Standard [12], the cement and
lime present speciic density of 3.07 g/cm3 and 2.45 g/cm3, respectively.
The ine and coarse aggregates were sand and basalt crushed
rock of zero graduation. These materials are readily available in the market and were used under the same conditions in which they are usually employed in construction sites.
The sand used in this study meets the requirements of the
Brazil-ian Standard [13] and can be classiied as ine sand in zone 2, as
shown in Figure 3.
The results of the characterization of the ine and coarse aggre -gates are presented in Table 1.
3. Results and discussions
The experimental results are presented below. They are divided in two groups: concrete and clay blocks.
Statistical tests were applied to evaluate the diferences of the ex
-perimental results at a 5% signiicance level, for a better under -standing of the results.
The statistical test F was applied for the analysis of the homo-geneity of variances and next the T-test or “Student’s t test”, in view of the previously performed F test, to compare the
Figure 2
Nominal dimensions of the pull-out specimens: concrete blocks (a) and clay blocks (b) (in mm)
B
B
B
A
390
14
0
99
0
19
0
10 19
0
10 19
0
19
0
19
0
10
10
Load
79
0
Load
79
0
19
0
10 19
0
19
0
19
0
10
10
390
79
0
14
0
Figure 3
Comparison between the sand used in this study
and that recommended by the [13]
Table 1
Physical characteristics of sand and gravel
Materials Specific weight
(g/cm3)
Bulk density
(kg/m3) Fineness modulus
Maximum diameter (mm)
Sand 2.62 2.59 2.15 2.40
samples’ means. The null hypothesis was the equality of means or variances of the two data sets. Note that the Student´s test is appropriate for a small sample size. Win-ter [14] applied successfully this test to extremely small sample sizes.
3.1 Compressive strength
3.1.1 Mortar
Table 2 shows the mean compressive strength results of the mortar used in the experimental program. Six cylindrical mortar sample specimens were tested at 28 days. The volume proportion of mor-tar was 1:0.5:4.5 (cement: lime: sand) and the water/cement ratio of 1.60. The use of two classes of concrete units is explained in section 3.3.
This volume ratio was selected in this work to keep the mortar less resistant and more deformable than the units, to
accommo-date small deformations. The two mortars did not show signiicant diferences.
3.1.2 Grout
Six cylindrical grout specimens were tested at 28 days for each grout type. The mass proportion of grout G14 was 1:3.06:2.94 (ce-ment: sand: gravel) with a water/cement ratio of 0.95 and grout G30 was prepared using a mass proportion 1:1.90:2 (cement: sand: gravel) and a water/cement ratio of 0.65. Both types of grout
are representative of the most used in Brazil, and are suicient to
the aims of this study.
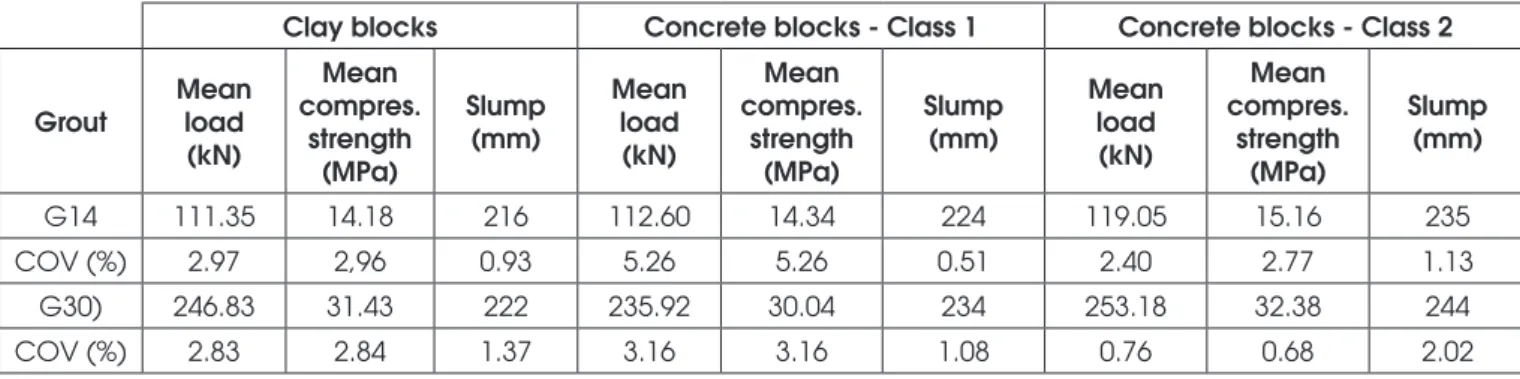
Table 3 shows the mean of the compressive strength results for
grout G14 and G30 used for illing the clay blocks and the two
classes of concrete blocks specimens.
As already mentioned, grout G14 was designed to be weaker than
grout G30. Statistical analysis showed signiicant diferences between the results for the diferent types of grout, for both concrete and clay
blocks. The values obtained for the same type of grout did not show
signiicant diferences. Therefore, there was a rigorous control in the
production of both types of grouts for each type of blocks.
3.1.3 Blocks
Six concrete blocks (for two diferent classes) and six clay blocks
were tested under compression. Table 4 presents the results of the compressive strength of the blocks, related to the gross area.
The use of concrete units of two diferent compressive strengths is
explained in section 3.3.
The results in Table 4 show that the mean compressive strength of the clay and the weakest concrete blocks was similar.
Statisti-cally, these values are not diferent at a 5% signiicance level. The diferences of the two classes of concrete blocks are stati
-cally signiicant.
Table 2
Results of the compressive strength of mortar
Clay blocks Concrete blocks Class 1 Concrete blocks Class 2 Mean strength
(MPa) 4.96 4.45 5.85
COV (%) 7.11 12.74 11.96
Table 3
Results of the compressive strength of grout G14 and G30 for concrete blocks
Clay blocks Concrete blocks - Class 1 Concrete blocks - Class 2
Grout Mean load (kN) Mean compres. strength (MPa) Slump (mm) Mean load (kN) Mean compres. strength (MPa) Slump (mm) Mean load (kN) Mean compres. strength (MPa) Slump (mm)
G14 111.35 14.18 216 112.60 14.34 224 119.05 15.16 235
COV (%) 2.97 2,96 0.93 5.26 5.26 0.51 2.40 2.77 1.13
G30) 246.83 31.43 222 235.92 30.04 234 253.18 32.38 244
COV (%) 2.83 2.84 1.37 3.16 3.16 1.08 0.76 0.68 2.02
Table 4
Results of the compressive strength of the blocks
Clay blocks Concrete blocks – Class 1 Concrete blocks – Class 2
Mean load (kN) Mean compres. strength (MPa) Mean load (kN) Mean compres. strength (MPa) Mean load (kN) Mean compres. strength (MPa)
586.58 10.89 557.03 10.21 1403.38 26.02
3.2 Tensile strength of reinforcements
Three 12.5 mm and 16 mm steel rebar samples were submitted to direct tensile tests. Table 5 shows the results obtained for the reinforcement used in clay blocks and concrete blocks. The yield stress was calculated according to Brazilian Standards [15].
3.3 Push-out tests
3.3.1 Bond strength of the push-out specimens
The bond strength was determined dividing the maximum load ap-plied by the area of the internal cavity surface of the unit. The area calculated for a clay block hole was 722 cm2 and for a concrete
clay block hole it was 813 cm2. Table 6 displays the results for
clay and concrete blocks. Note that in the case of concrete units,
Table 5
Results of the tensile strength of reinforcements
Tensile strength of reinforcements of clay blocks
Diameter rebar Mean ultimate
load (kN)
Mean yield load (kN)
Mean ultimate load (kN)
Mean yield load (kN)
12.5 mm – 93.32 65.55 760.43 534.15
COV (%) 1.39 2.95 1.39 2.95
16 mm – 159.86 117.32 795.05 583.52
COV (%) 1.20 2.79 1.20 2.79
Tensile strength of reinforcements of concrete blocks - Class 1 (Co10)
Diameter rebar Mean ultimate
load (kN)
Mean yield load (kN)
Mean ultimate load (kN)
Mean yield load (kN)
12.5 mm – 98.95 68.26 806.32 556.24
COV (%) 0.82 2.18 0.82 2.18
16 mm – 141.97 118.35 706.10 588.60
COV (%) 1.29 2.02 1.30 2.02
Tensile strength of reinforcements of concrete blocks – Class 2 (Co26)
Diameter rebar Mean ultimate
load (kN)
Mean yield load (kN)
Mean ultimate load (kN)
Mean yield load (kN)
12.5 mm – 89.14 70.25 711.44 572.49
COV (%) 0.57 4.51 3.10 4.51
16 mm – 139.78 116.74 694.67 580.63
COV (%) 0.84 6.79 0.92 6.79
Table 6
Results of the push-out tests
Clay blocks Concrete blocks (Co10)
Class 1
Concrete blocks (Co26) Class 2
Mean ultimate load (kN)
Bond strength (MPa)
Mean ultimate load (kN)
Lower limit of bond strength
(MPa)
Mean ultimate load (kN)
Lower limit of bond strength
(MPa)
G14 11.64 0.16 38.40 0.47 107.42 1.32
COV (%) 11.31 11.31 11.38 11.36 12.70 12.70
G30 14.02 0.19 53.65 0.66 146.56 1.80
the ratio “failure load/internal cavity area” is not the bond strength itself but only a lower limit of that property, since failure is typically caused by tension in the units, as described below. After obtaining this failure type, we decided to add higher tensile strength con-crete units (Class 2 blocks have a mean tensile strength of 2.56 MPa, while Class 1 blocks have 0.91 MPa). Even for the strongest concrete blocks, the failure type was the same (see section 3.3.2). Depending on the type of grout, the results obtained show that the bond strength in the grout/block interface was higher for grout G30, the one with higher compressive strength and lower water/ cement ratio. The interface for grout G14 presented low resistance.
Statistically, these values show signiicant diferences in all cases. Hence, the type of grout inluenced the bond between the block webs and grout, and this inluence was more noticeable in the con -crete blocks.
Pereira de Oliveira [3] concluded that the bond strength in the grout/ block interface is improved with the decrease of the water/cement ratio. This conclusion is consistent with the push-out results
ob-tained in this research, despite the difering grout proportion.
Soric and Tulin [1] obtained average bond strength of 1.52 MPa for a grout with 19 MPa compressive strength and a concrete block with 15.61 MPa. They described the same type of failure obtained in the present study (spalling of the masonry shell) and decided to present the obtained lower limit as the bond strength of the inter-face, consistent with what is done in the present paper. Note that the referred bond strength of 1.52 MPa is somehow close to the obtained values for the strongest blocks.
According to the type of block material, the results in Table 6 show a higher bond strength in the concrete blocks than in the clay blocks.
Statistical analysis showed signiicant diferences between those
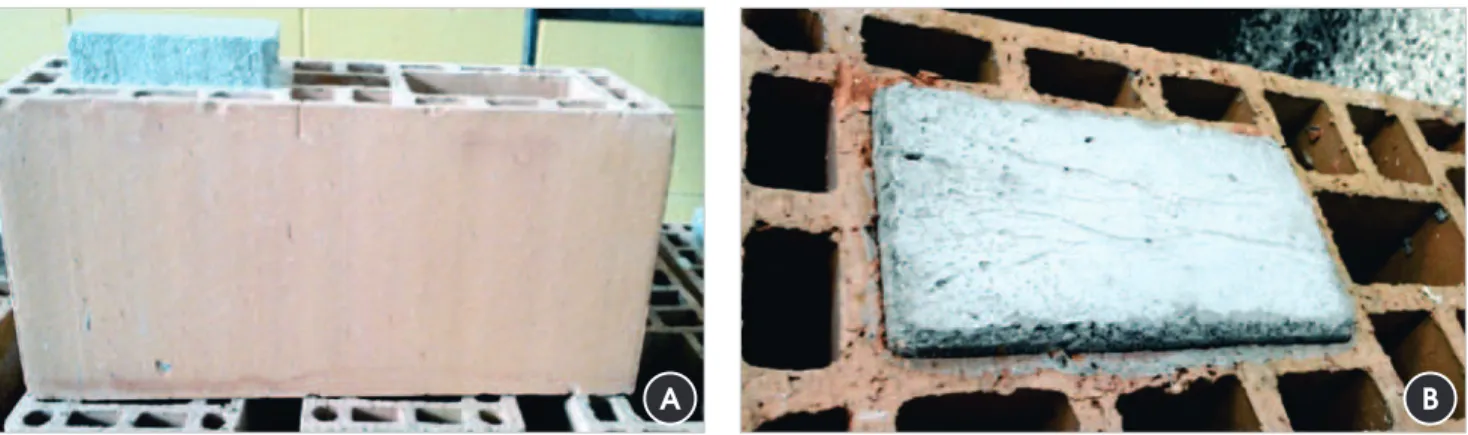
Figure 4
Types of surfaces created between the grout and clay blocks (a) and concrete blocks (b)
A
B
Figure 5
Typical measured vertical profiles of clay blocks (a) and concrete blocks – Class 1 (b)
values for both types of blocks. Therefore, the type of block
materi-al inluenced the bond resistance at the block/grout interface. Con
-sidering the concrete blocks, the tensile strength also inluenced
the results. Note that the increase of the “bond” strength (180% for specimens with grout G14 and 173% for G30) is consistent with the increase of the tensile strength of the concrete block (181%). This fact is also qualitatively evident. Figure 4 shows the texture
of the grout for each type of block. The grout inill in the concrete block displays a rougher surface than the grout inill in the clay
block. The smooth surface of the clay blocks favors the grout slip-page and creates a low bond interface between the grout and the webs of the blocks. The roughness is consistent with the nature of the block material surface into which the grout is inserted.
Additional tests were done to quantify texture variation of the inter-nal surfaces of blocks and grouts, in a way similar to Thamboo et al. [16], using an experimental apparatus widely used for metal
tri-bological applications and rock mechanics proile. The roughness
average (Ra) is a property to describe irregularities of the surface texture, which is the arithmetic mean of the deviation between
the measured vertical and the average proiles. Typical proiles
are shown in Figure 5. Table 7 shows the obtained values of Ra, noting that each line contains the obtained results for block and corresponding G14 and G30 grouts. The obtained results show clearly that: a) concrete blocks and corresponding grouts have more irregularities than clay units and their grouts, favoring bond; b) considering each block, the strongest grout presents higher values for Ra, being more capable of penetrating irregularities of the block surface, despite of nearly the same consistency of the weakest grout (see slump results in Table 3) and c) considering the two classes of concrete blocks, the irregularities are larger for
the weakest blocks; however the inluence on the bond strength
could not be observed, since failure is typically related to the ten-sile strength of the webs.
3.3.2 Failure type of the push-out specimens
The tested push-out specimens showed a good bond between grout and concrete blocks, enough to prevent grout slippage inside the concrete block’s cavity, for all the tested series (see Figure 6). Note that the shells cracked before slippage for concrete units of
diferent classes. On the other hand, the two types of grout slid
inside the clay block’s cavity. Figure 7 displays a clay block speci-men before and after the test.
The failure of the concrete block specimens was characterized by cracks at the concrete blocks webs, the same type described by Soric and Tulin [1] (see Figure 6). This failure was due to the
stress transference from the grout inill to the concrete block webs through the common interface. This behavior is justiied by the
similarity between the materials of the grout and concrete blocks, besides the already mentioned roughness of the contact surfaces. Although no slippage occurred, the failure of the block breaks up the bond, thereby limiting this property.
On the other hand, the grout inill in the clay blocks slipped, as
shown in Figure 7. Therefore, the transference of stresses be-tween grout and block web was weak, which meant that there was low adhesion at that interface.
3.4 Pull-out tests
As previously mentioned, the pull-out specimens had reinforce-ment bars. In this work, the anchorage length was calculated
Table 7
Results of average roughness
Type of unit and grout
Average roughness Ra (mm)
COV (%)
Clay blocks 0.006 5.771
Grout G14 0.073 9.264
Grout G30 0.093 13.239
Concrete blocks-Class 1
(Co10) 0.143 14.341
Grout G14 0.138 1.051
Grout G30 0.173 11.324
Concrete blocks-Class 2
(Co26) 0.117 15.036
Grout G14 0.100 5.956
Grout G30 0.133 2.182
Figure 6
according to the [17] because the assessment of the grout/rein-forcement bond stress is more detailed than in the [10]. This code
does not consider the inluence of the grout strength.
Table 8 shows the anchorage length calculated according to the material properties.
The results obtained show that the calculated anchorage lengths are lower than the actual embedment length adopted for the rebars in the pull-out specimens of this work (see Figure 2). Therefore,
the anchorage length was suicient for the bars of both diameters.
The rebars of 12.5 mm and 16 mm diameters were chosen because they are the most common in the reinforced masonry in Brazil, in high-rise buildings. The Brazilian Standards for Concrete Block
Structural Masonry [10] and the Clay Block Structural Masonry [11] suggest that the reinforcement housed in the same grouting cavities should not have cross-sectional area higher than 8% of the corresponding area of the surrounding grout section, considering possible trespass regions. In practical terms, this means using a maximum reinforcement diameter of 20 mm, although it is usual to limit the reinforcement diameter to 16 mm.
3.4.1 Results of the pull-out of concrete block specimens
Table 9 shows the mean value of the ultimate load and the maximum stress of the pull-out concrete block specimens for the four series. Figure 8 shows the results of the pull-out loads. Figure 8 also shows the reference values of the yield load and the ultimate load, both in the simple tensile test of the steel rebars, to better under-stand the results.
The pull-out tests showed that there was a good bond between the reinforcement and the two types of grout. In all cases, the steel bars reached their maximum load without slipping. The load
capac-ity was deined by the reinforcement tension since the steel rebar
and the grout did not slip. The results in Table 9 evidence that the diameter limits are practically the same for the bars. The pull-out specimens built with reinforcement of 16 mm diameter reached an ultimate load higher than the maximum load of the referred bar. The maximum load of the 12.5 mm diameter pull-out specimens remained close to the maximum load of the corresponding steel
Figure 7
Failure type of push-out clay block specimens before (a) and after (b) the test
A
B
Table 8
The calculated anchorage length for concrete
and clay blocks
Series Grout
Diameter of rebar
(mm)
Anchorage length (lb)
(mm)
G14S12 G14 12.5 570
G30S12 G30 12.5 350
G14S16 G14 16 730
G30S16 G30 16 440
Table 9
Results of the pull-out of concrete block specimens
Concrete blocks – Class 1 (Co10) Concrete blocks – Class 2 (Co26)
Series
Mean ultimate load (kN)
Mean ultimate stress (MPa)
COV (%)
Mean ultimate load (kN)
Mean ultimate stress (MPa)
COV (%)
CoG14S12 96.33 784.93 1.96 89.15 726.42 0.81
CoG30S12 98.17 799.98 1.79 89.24 727.17 0.53
CoG14S16 155.78 774.79 7.20 150.97 750.84 3.83
Figure 8
Results of the pull-out of concrete block specimens of the Class 1 (Co10) (a) and Class 2 (Co26)
(b) with yield load and maximum load of the reinforcements
A
B
bar. The results in Figure 8 clearly show that the specimens’ failure was commanded by the type of steel and not by the type of grout. As mentioned earlier, the Brazilian Standards [10] and [11] consid-er that the maximum tensile load of the reinforcement embedded
in the grout cannot be higher than half the yield stress (0.5 σy).
Ac-cording to the achieved results, it is apparent that this standardized value is very conservative.
3.4.2 Results of the pull-out of clay blocks specimens
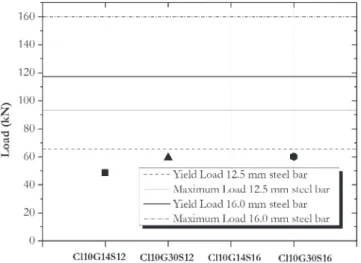
Table 10 shows the mean value of the ultimate load and the maxi-mum stress of the pull-out clay block specimens for the four series. Figure 9 presents the results of the pull-out loads. Figure 9 also shows the reference values of the yield load and the ultimate load, both obtained in the simple tensile test of the rebars.
Figure 9 shows that the failure of the clay block specimens was determined by the type of grout. The series Cl10G14S12 and Cl10G14S16 (lower compressive strength and higher water/ce-ment ratio) reached almost the same value of the ultimate load,
independently of the reinforcement diameter. The same thing hap-pened with the series Cl10G30S12 and Cl10G30S16 (higher com-pressive strength and lower water/cement ratio). The specimens
illed with grout G30 were more resistant than with the grout G14,
which is consistent with the roughness measures presented in
sec-tion 3.2. The push-out results conirm this fact.
Statistical analysis conirms that the failure load of the G30 specimens is signiicantly diferent to the specimens illed with
grout G14.
The behavior of clay blocks in pull-out tests was not similar to the concrete blocks. The column of grout inside the clay blocks slipped for both types of grouts. Therefore, the reinforcement rebars did
Table 10
Results of the pull-out of clay block specimens
Series
Mean ultimate
load (kN)
Mean ultimate
stress (MPa)
COV (%)
ClG14S12 48.47 394.95 2.36 ClG30S12 59.26 482.91 10.51 ClG14S16 48.96 243.49 3.60 ClG30S16 60.11 298.94 8.50
Figure 9
not reach their yield stress because the grout slipped before, de-spite the anchorage length being adequate. The bond strength
be-tween the clay block webs and the grout inill was weak.
3.4.3 Behavior of the block/grout interface
Another aspect to consider in the tested pull-out specimens re-gards the behavior of the grout/block interface. When the tensile force was applied to the embedded reinforcement, there was no slippage of the grout inside the cavities of the concrete block. This
feature demonstrates that there was suicient bond strength at that
interface, as illustrated in Figure 10a. Although there was slippage of the grout’s column inside the clay blocks (see Figure 10b).
3.4.4 Analysis of the limits of block/grout bond
The analysis of the block/grout bond limits was carried out only for the clay blocks, since there was no slippage in the concrete blocks. The bond load between the grout and clay block was 11.64 kN for grout G14 and 14.02 kN for grout G30, for a single grouting block.
These loads multiplied by the number of grouting blocks used in the pull-out specimens (4 blocks) set important limits related to the grout/block bond. These values can be compared with the ultimate loads obtained in the pull-out tests, as shown in Table 11.
The results in Table 11 show that the ultimate loads of pull-out tests were approximately equal to the extrapolated limits of the push-out tests. The statistical analysis showed that these limits are not
sig-niicantly diferent. Note that these limits should be checked in the
reinforced masonry design.
3.4.5 Diferent rebar diameters
The authors of this research speculated on the use of 8, 10 and 20 mm diameter rebars in the pull-out test, assuming the use of the
same materials. Table 12 shows the yield load for three diferent
diameters which have been tested by [18] and [19] under the same test conditions of the rebars in this experimental program (12.5 mm and 16 mm). Table 12 also shows the ultimate load considering the experimental tests of this study for the concrete blocks and Table 13 for clay blocks.
Figure 10
Behavior of grout after the pull-out specimens were tested: concrete block without grout slippage
(a) and clay block with grout slippage (b)
A
B
Table 12
Yield load for different diameters and load limited by spalling achieved in concrete blocks
Table 11
Load limited by bond and ultimate load of the pull-out tests of clay blocks
Yield load (kN) Load limited by shell
cracking (kN)
Load limited by shell cracking (kN)
Ø 8 mm Ø 10 mm Ø 20 mm G14 G30
31.01 44.94 178.19 153.60 214.60
Concrete blocks – Class 1 (Co10) Pull-out specimens
Ultimate load (kN)
G14 G30 ClG14S12 ClG14S16 ClG30S12 ClG30S16
Table 12 shows that the use of rebar diameters of 8 and 10 mm in the pull-out specimens of concrete blocks would cause a masonry failure related to the yield load of both steel bars, and not by shell cracking. The 20 mm rebar diameter is used in the construction of
tall buildings, higher than 16 loors. In this case, a block with com
-pressive strength of 16 MPa (1 MPa per loor, as a rule of thumb)
and a corresponding grout of 32 MPa (twice the block compressive strength related to the gross area) could be indicated. Therefore, with the use of a 20 mm rebar and the same grout G30, it would
have the same efect as using the 8 and 10 mm diameter rebar. It
would be a failure commanded by the yield load of the steel bars (178.19 kN < 214.60 kN, see Table 12). If a lower compressive strength grout is used, the failure load would probably be smaller than for the G30 grout, depending on the surface roughness, as shown in section 3.3.1.
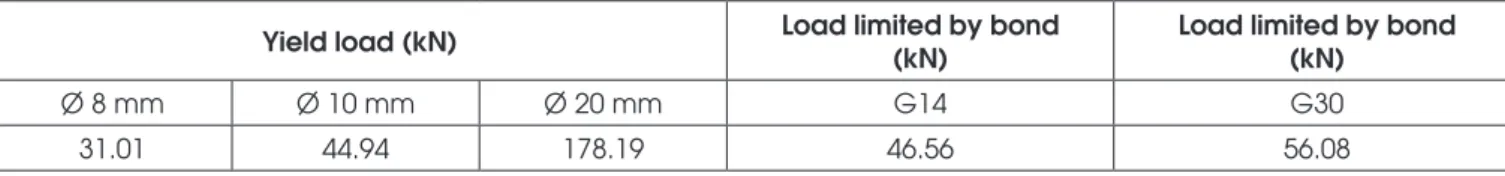
Regarding the clay blocks, the masonry failure corresponding to the 8 and 10 mm reinforcement bars would be commanded by
the yield load of rebars. With the use of 20 mm rebar, the efect
would be probably the same as the rebars already shown in this paper (12.5 mm and 16 mm), where the masonry limit state would depend on the bond strength of the block/grout interface for the
speciic grout type.
Table 14 displays a summary of the ultimate stress of the pull-out test of clay blocks referred to the yield stress of the steel bar, for several reinforcement diameters.
As mentioned earlier, the Brazilian Standards [11] considers as a limit half of the yield stress of the reinforcement embedded in the
grout (50% σy). The results in Table 14 show that the limit reduces
progressively with the increasing rebar diameter. It is then appar-ent that the bond stress at the grout/block interface should be con-sidered during the design development to guarantee safety.
4. Conclusions
The push-out tests in concrete blocks showed that there is
suf-icient bond strength between the concrete block and the two types
of grout used in this study. This bond prevented grout slippage for both classes of blocks. The push-out tests with clay blocks leaded to grout slippage, denoting a lack of bond.
The higher strength grout with lower water/cement ratio (grout G30) presented higher bond strength compared to the lower strength grout and higher water/cement ratio (grout G14). This fact was evidenced for both concrete and clay blocks.
The pull-out tests with concrete blocks showed that the reinforce-ments embedded in the grout reached their yield stress without slippage. This feature demonstrated that the anchorage length used in this work was appropriate. The grout did not slip in relation to the concrete block webs. The pull-out with clay blocks showed
slippage of the grout’s column before the reinforcement rebars achieved their yield stresses. The failure was commanded by the
lack of suicient bond strength of the clay block/grout interface,
consistent with the low values of roughness (Ra).
In the case of concrete blocks there should be no restriction limits on the yield stress of reinforcement, in a practical sense and con-sidering other prescribed limits. In contradiction, in the case of clay blocks, additional tests should be carried out for establishing lim-its, with varying blocks and grouts. The preliminary results indicate limits that should be adopted for a diameter larger than 10 mm, for clay block and grout properties similar to this research. The authors of this paper suggest 75% for Ø 12.5mm, 50% for Ø 16mm and 25% for Ø 20 mm as a reference point for future investigations, while a comprehensive research program covering the bond
be-tween diferent clay blocks and grout inills is not performed.
The two types of bond strength that occur in the reinforced mason-ry should be considered during design: grout/reinforcement bond and block/grout bond.
5. Acknowledgements
The authors would like to thank the Department of Structural Engi-neering of the School of EngiEngi-neering of São Carlos at the Univer-sity of São Paulo for permission to conduct the survey. The authors also would like to thank the Conselho Nacional de
Desenvolvim-ento Cientíico e Tecnológico-CNPq.
6. References
[1] SORIC, Z. and TULIN LG. Bond in reinforced concrete ma
-sonry. In: 4th North American Masonry Conference, Los An -geles, California, 1987, p. 47.1-47.16.
Table 13
Yield load for different diameters and load limited by bond achieved in clay blocks
Yield load (kN) Load limited by bond
(kN)
Load limited by bond (kN)
Ø 8 mm Ø 10 mm Ø 20 mm G14 G30
31.01 44.94 178.19 46.56 56.08
Table 14
Ultimate stress of the pull-out tests of clay blocks
referred to the yield stress of the steel rebar for
different diameters
Rebar diameters (mm)
Ultimate
G14 G30
Ø 8 100% σy 100% σy
Ø 10 100% σy 100% σy
Ø 12.5 74% σy 90% σy
Ø 16 42% σy 51% σy
[2] PEREIRA DE OLIVEIRA L.A. Resistência de aderência
como parâmetro de compatibilidade entre o graute de en-chimentos e as unidades da alvenaria estrutural. In: 5th In-ternacional Seminar on Structural Masonry for Developing
Countries, Florianópolis, Brasil, 1994, p. 214-227.
[3] PEREIRA DE OLIVEIRA L.A. The micro-concrete inill strength’s inluence on the compressive masonry strength.
In: European Ready Mix Organization Congress - ERMCO
98, Lisboa, Portugal, 1998, p.691-700.
[4] BIGGS D.T. Grouting Masonry using Portland Cement-Lime Mortars. In: International Building Lime Symposium, Orlan -do, Florida, 2005, p.2-15.
[5] SORIC, Z. and TULIN, L.G. Bond Stress/Deformation in
Pull-Out Masonry Specimens. Journal. Structure Engineer, v. 115, n. 10, 1989; p. 2588-2602. http://dx.doi.org/10.1061/ (ASCE)0733-9445(1989)115:10(2588)
[6] AHMED, K. and FELDMAN L.R. Evaluation of contact and
noncontact lap splices in concrete block masonry construc-tion. Canadian Journal of Civil Engineering, v.39, n.5, 2012; p. 515-525. doi: 10.1139/l2012-026
[7] CAMLI, U.S. and BINICI, B. Strength of carbon iber reinfor -ced polymers bonded to concrete and masonry. Construc-tion and Building Materials, v. 21, 2007; p. 1431-1446. doi: 10.1016/j.conbuildmat.2006.07.003
[8] AIELLO, M.A. and SCIOLTI, S.M. Bond analysis of mason -ry structures strengthened with CFRP sheets. Construction and Building Materials, v. 20, 2006; p. 90-100.
doi:10.1016/j.conbuildmat.2005.06.040
[9] Fédération International du Béton (ib). Bond of reinforce -ment in concrete. Bulletin n. 14, 2002.
[10] ASSOCIAÇÃO BRASILEIRA DE NORMAS TÉCNICAS.
Structural Masonry – Concrete Blocks Part 1: Design. - NBR 15961-1, Rio de Janeiro, 2011.
[11] ASSOCIAÇÃO BRASILEIRA DE NORMAS TÉCNICAS.
Structural Masonry – Clay Blocks Part 1: Design. - NBR 15812-1, Rio de Janeiro, 2010.
[12] ASSOCIAÇÃO BRASILEIRA DE NORMAS TÉCNICAS.
Portland cement and other powdered material - Determina-tion of density. - NBR NM 23, Rio de Janeiro 2001.
[13] ASSOCIAÇÃO BRASILEIRA DE NORMAS TÉCNICAS. Ag
-gregates for concrete – Speciication. - NBR 7211, Rio de
Janeiro, 2009.
[14] WINTER, J.C.F. Using the Student’s t-test with extreme-ly small sample sizes. Practical Assessment, Research & Evaluation, v. 18, n. 10, 2013. http://pareonline.net/getvn. asp?v=18&n=10.
[15] ASSOCIAÇÃO BRASILEIRA DE NORMAS TÉCNICAS. Ste
-el for the reinforcement of concrete structures – Speciica -tion. - NBR 7480, Rio de Janeiro, 2007.
[16] THAMBOO, J.A., DHANASEKAR, M. and YAN, C. Flexural and shear bond characteristics of thin layer polymer ce-ment mortared concrete masonry. Construction and Building Materials, v. 46, 2013; p. 104-113. doi:10.1016/j.conbuild-mat.2013.04.002
[17] ASSOCIAÇÃO BRASILEIRA DE NORMAS TÉCNICAS. De -sign of concrete structures — Procedure. - NBR 6118, Rio de Janeiro, 2007.
[18] KATAOKA, M. N. Beam–column composite connections under cyclic loading: an experimental study. Materials and Structures, v. 48, n. 4, 2011; p. 929-946.
doi: 10.1617/s11527-013-0204-4
[19] OLIVEIRA, L.M.F. Numerical and experimental study of the