Gonçalo Nuno Fernandes Ritto
Licenciado em Engenharia de Micro e Nanotecnologias
Growing of biomorphic nanomaterials
based on calcium carbonate
Dissertação para Obtenção do Grau de Mestre em Engenharia de Micro e Nanotecnologias
Orientador: Isabel Maria Mercês Ferreira, Professora Associada, Faculdade de Ciências e Tecnologia da UNL
Co-orientadores: Ana Baptista, Investigadora de Pós-Doutoramento Faculdade de Ciências e Tecnologia da UNL
Júri
Presidente: Rodrigo Ferrão de Paiva Martins, Professor Catedrático, Faculdade de Ciências e Tecnologia da UNL
Arguente: João Paulo Miranda Ribeiro Borges, Professor Auxiliar, Faculdade de Ciências e Tecnologia da UNL
Crescimento de Nanomateriais Biomorficos à base de carbonato de cálcio
Copyright © Gonçalo Nuno Fernandes Ritto, Faculdade de Ciências e Tecnologia, Universidade Nova de Lisboa.
Agradecimentos
Agradeço a todos as pessoas que me ajudaram a chegar até aqui.
Agradeço principalmente à minha orientadora de tese, professora Isabel Ferreira, por me ter dado a oportunidade de desenvolver este tema, por todos os ensinamentos, paciência, e pelo tempo gasto e despesas monetárias comigo.
Agradeço também à Ana Baptista, Inês Ropio, David Sousa, Paulo Duarte, Catarina Marques e a todas as outras pessoas do Departamento, que me deram a sua ajuda para conseguir fazer este trabalho.
Agradeço também ao Departamento de Conservação e Restauro por me ter disponibilizado o microscópio Raman.
Agradeço aos meus colegas de curso, tanto pela companhia como pela ajuda que me deram no laboratório.
Agradeço também à minha família e amigos que me apoiaram durante todo este percurso.
Resumo
Neste trabalho foi produzido carbonato de cálcio por precipitação: banho de óleo e ultra sons, onde vários parâmetros foram testados: temperatura, velocidade de agitação magnética, concentração dos reagentes, duração da reação e meio da reação. Algumas amostras ficaram em repouso durante um mês antes de algum precipitado ser removido, lavado e seco para a caracterização do pó sem este ter nenhum produto secundário ou solvente da reação.
A técnica de “dip-coating” foi utilizada para produzir carbonato de cálcio com uma matriz orgânica (PVP – Polyvinylpyrrolidone) numa tentativa de produzir nacre artificial. Vários parâmetros foram testados: número de ciclos, temperatura, tempo de imersão e de secagem; presença/falta de uma etapa intermédia e velocidade de imersão.
Dois polimorfos anidros do carbonato de cálcio foram produzidos por ambos os métodos: vaterite e calcite.
Algumas amostras foram caracterizadas por DRX (Difração por raios-X), Espectroscopia Raman e foram analisadas por SEM (Microscópio Eletrónico de Varrimento).
Espectrofotometria foi também utilizada para ver a diferença da absorvância/transmitância e refletância de algumas amostras de “dip-coating”. As amostras com uma matriz orgânica mostraram uma transmitância muito elevada na região do infra-vermelho e uma baixa transmitância na região do visível ao contrário das amostras com apenas camadas inorgânicas indicando a possibilidade da formação de um complexo orgânico/inorgânico.
Abstract
Calcium carbonate was produced by precipitation: oil bath and ultra-sounds, being studied several parameters such as: temperature, magnetic stir speed, concentration of the reagents, duration of the reaction and the medium of the reaction. Samples rested for a month before some of the precipitated was removed, washed and dried to get the powder characterized without any secondary product or the solvent of the reaction.
Dip-coating technique was also used to produce calcium carbonate with an organic matrix (PVP - Polyvinylpyrrolidone) in an attempt to produce artificial nacre. Several parameters were also modified: number of coating cycles, temperature, dip and dry time; presence/absence of an in-between step and dipping speed.
Two anhydrous polymorphs of calcium carbonate were produced from both methods: vaterite and calcite.
Some samples were characterized by XRD (X-ray Diffraction), Raman Spectroscopy and were analysed by SEM (Scanning Electron Microscopy).
Spectrophotometry was also used to analyse the absorbance/transmittance and reflectance of some dip-coated samples. The samples with an organic matrix showed a very high transmittance in the infra-red region and a very low transmittance in the visible region unlike samples with just inorganic layers indicating the possibility of formation of an organic/inorganic complex.
Index
Agradecimentos ... v
Resumo ... vii
Abstract ... ix
Index ... xi
Table Index ... xiii
Figure Index ... xv
Objective ... 1
1 Introduction ... 2
1.1 Calcium carbonate ... 2
1.2 Applications ... 3
1.3 Nacre ... 4
2 Materials and Methods ... 6
2.1 Synthesis ... 6
2.2 Characterization ... 7
3 Results and discussion ... 8
3.1 Synthesis of CaCO3 by precipitation ... 8
3.2 Influence of solution’s temperature, magnetic stirring speed and reaction time ... 9
3.3 Structural and morphologic analysis ... 9
3.4 Purified calcium carbonate powders... 21
3.5 Synthesis of CaCO3 films by Dip-Coating ... 24
4 Conclusions and future perspectives ... 29
References... 31
Annex ... 39
Annex 1 ... 40
Annex 2 ... 43
Table Index
Table A1. 1: Solution parameters tested ... 40 Table A1. 2: Dip-coating parameters used ... 41
Table A2. 1: Influence of time and temperature for a solution with magnetic stir at 400rpm. ... 43 Table A2. 2: Influence of time and temperature for a solution with magnetic stir at
800rpm. ... 44 Table A2. 3: Influence of time and temperature for a solution without magnetic stir. .. 46 Table A2. 4: Influence of the ultra-sounds in the solution ... 48
Figure Index
Figure 1 - Calcium carbonate crystals in nature, from left to right: Aragonite[9];
Vaterite[10]; Calcite[11]... 2 Figure 2 - Different literature images exemplifying: amorphous calcium carbonate
(ACC, a); ACC and vaterite nanoaggregates (b, c); and vaterite nanoaggregates (d, e). Pictures at the bottom correspond to: vaterite nanoaggregates and
first calcite crystals (f); calcite crystals attached to vaterite spheres with the development of growth steps on the calcite surface (g); calcite growth steps and vaterite nanoparticulate subunits (h) and calcite crystals with vaterite casts (i).[13] ... 3 Figure 3 - Scheme of layers of nacre in the outer layer of a pearl[32] ; Interior of a
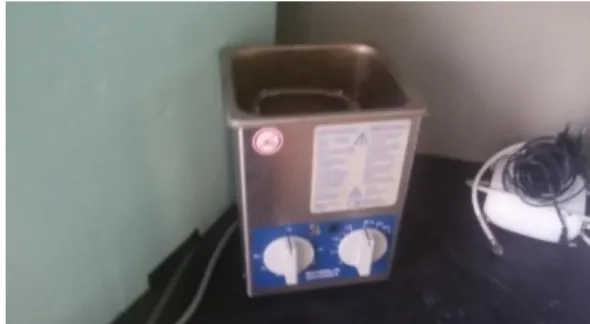
nautilus shell which contains the iridescent nacre[33] ... 4 Figure 4 - Heating plate, Heidolph ... 6 Figure 5 - Ultra-sonic machine, (Sonorex, Bandelin) ... 6 Figure 6 - Images of SEM and optical microscopy for samples synthetized during 60
minutes at 40ºC at 400 rpm and 800rpm magnetic stir. a) Optical microscopy of crystals at 400 rpm. b) Optical microscopy of crystals at 800 rpm. c) SEM image of crystals at 400 rpm. d) SEM image of crystals at 800 rpm. ... 10 Figure 7- a) – Micro Raman Spectra of samples prepared during 60 min and at 40°C
with a different magnetic stir speed b) XRD pattern of samples synthetized at 40°C during 60min with a different rotation speed ... 11 Figure 8 - Images of SEM and optical microscopy for samples synthetized at 40°C and
75°C. a) Optical microscopy of crystals at 40ºC; b) Optical microscopy of crystals at 75ºC; c) SEM image of crystals at 40ºC; d) SEM image of crystals at 75ºC. .... 13 Figure 9 - Samples synthesized during 60 min at 400 rpm with different temperatures:
a) Raman spectra; b) XRD pattern. ... 14 Figure 10 - Images of SEM and optical microscopy for samples synthetized at different
Figure 11 - Samples synthesized at 400 rpm and 40°C at different reaction time: a) Micro Raman spectra; b) XRD pattern. ... 17 Figure 12 - Microscopy and SEM images of samples synthetized at 40°C during 30
minutes for magnetic stir of 400 rpm varying CaCl2*2H20:NaHCO3 ratios; a) SEM image of (1:1 ratio); b) Optical microscope image of (1:1 ratio); c) SEM image of (1:2 ratio); d) Optical microscope image of (1:2 ratio); e) SEM image of (1:4 ratio); f) Optical microscope image of (1:4 ratio); g) SEM image of (1:6 ratio); h) Optical microscope image of (1:6 ratio). ... 18 Figure 13 - Microscopy and SEM images of samples synthetized at 75°C during 30
minutes for magnetic stir at 400 rpm varying CaCl2*2H20:NaHCO3 ratios: a) SEM image of (1:4 ratio); b) Optical microscope image of (1:4 ratio); c) SEM image of (1:5 ratio); d) Optical microscope image of (1:5 ratio) ... 19 Figure 14 - a) Micro Raman spectra of 4 samples synthesized during 30 minutes at 40°C
at 400 RPM with different reagents (CaCl2*2H2O/(NaHCO3)2) ratios. b) Micro
Raman spectra of 2 samples synthesized during 30 minutes at 75°C at 400 rpm with different reagents (CaCl2*2H2O/(NaHCO3)2) ratios. c) XRD pattern of 4
samples synthesized during 30 minutes at 40°C at 400 RPM with different reagents (CaCl2*2H2O/(NaHCO3)2) ratios. ... 21
Figure 15 - SEM, microscopy and EDS images of samples washed after preparation: a) SEM image of crystals at 120 minutes 75ºC 400 rpm; b) Optical microscope image of crystals at 120 minutes 75ºC 400 rpm; c) SEM image of crystals at 120 minutes 40ºC 400 rpm; d) Optical microscope image of crystals at 120 minutes 40ºC 400 rpm; e) SEM image of crystals at 120 minutes 40ºC 800 rpm; f) Optical
microscope image of crystals at 120 minutes 40ºC 800 rpm; g) SEM image of crystals at 60 minutes 75ºC 800 rpm; h) Optical microscope image of crystals at 60 minutes 75ºC 800 rpm; i) EDS spectrum of the sample at 60 minutes 75ºC 800 rpm. ... 23 Figure 16- a) Micro Raman spectra and b) XRD pattern of samples washed after
synthesis: i. 120 min 75° and 400rpm; ii. 120 min 40° and 400rpm; iii. 120 min 40° and 800rpm and; iv. 60 min, 75° and 800rpm ... 24 Figure 17 - Absorbance at 1500 nm versus number of cycles varying the dip time
Figure 19 - a) Absorbance and b) reflectance as a function of the wavelength for different sequences of cups at 10 cycles; cycle of 2min dip in the organic cup, and 3 min dry for a dip speed 5mm/s, ambient temperature of 27°C and 10 seconds of dip time in the inorganic reagents... 27 Figure 20 - a) and b) SEM images of the dip coated samples respectively for 20 cycles,
Objective
The objective of this work was to find a facile synthesis process to grow nacre. In nature nacre is formed by alternate sheets of CaCO3 with organic compound. To achieve this goal, the
work performed in this thesis follows two approaches: first the synthesis of pure CaCO3 was
tried and then a layer-by-layer process using an automated dip-coating was used to growth CaCO3 film directly into a glass substrate.
To achieve the synthesis of pure CaCO3, several parameters of the reaction were modified
in order to know about its polymorphs. The changed parameters of the reaction were: temperature, time, stirring speed, different concentration of reagents and influence of the medium (oil bath or ultra-sounds). The reactants were CaCl2(calcium chloride) and NaHCO3
(sodium bicarbonate) and the solvent was ethylene glycol (C2H6O2).
The dip-coating technique was utilized in an attempt to produce nacre alternating between an organic and inorganic solution were several parameters varied such as temperature, dip and dry time, with/without in-between cup, number of cycles, dipping speed.
1
Introduction
1.1
Calcium carbonate
Minerals have been produced for more than 3500 million years from different species of animals[1]. The biominerals are the inorganic phase formed in biological systems and widespread in nature. They have a hierarchical structure and special functions like the silica cell wall of the diatom, the calcitic spine of sea urchin, and the calcitic otolith of the marine algae. The process that leads to the formation of biominerals is called biomineralization. Calcium carbonate is one of the most important biominerals found in mammalian hard tissues[2].Calcium carbonate have three anhydrous polymorphs: calcite, vaterite and aragonite (Figure 1) and 2 hydrated polymorphs: ikaite (CaCO3.6H2O) and monohydrocalcite
(CaCO3.H2O). There are also some amorphous calcium carbonate (ACC) with different degrees
of short range order and degree of hydration[3]–[7]. It is extremely difficult to know about the formation of these polymorphs because there are many parameters involved in biomineralization.[8]
Figure 1 - Calcium carbonate crystals in nature, from left to right: Aragonite[9]; Vaterite[10]; Calcite[11]
Figure 2 - Different literature images exemplifying: amorphous calcium carbonate (ACC, a); ACC and vaterite nanoaggregates (b, c); and vaterite nanoaggregates (d, e). Pictures at the bottom correspond to: vaterite nanoaggregates and first calcite crystals (f); calcite crystals attached to vaterite spheres with the development of growth steps on the calcite surface (g); calcite growth steps and vaterite nanoparticulate subunits (h) and calcite crystals with vaterite casts (i).[13]
Some findings of those researches were that with a higher CO2 pressure and a pH between
8,5 and 10,5 favours the formation of vaterite but with lower CO2 pressure and a pH around 7
and higher than 11 calcite is favored.[14][15][16][17]. Han et.al said that increasing Ca2+ ion
concentration in a solution favours the appearance of calcite over vaterite.[18] To obtain aragonite the pH of the solution should be lower than 11, the temperature should be high and Magnesium present in the solution.[19]
Vaterite is the most unstable CaCO3 polymorph and can be transformed into aragonite
and calcite easily[20] and is the rarest polymorph in nature but it still can be found in: gallstones,[21] gastropods eggshells,[22] freshwater lackluster pearls,[23] in a member of the ascidians, the snail, carp otoliths and sea squirts. Vaterite formation is under strictly genetic control. Vaterite acts as a transient precursor or as functional component for structural purposes.[22] It has been stated that it is possible to transform calcite to vaterite too [23]. The lackluster pearls are made from vaterite crystals which change its mechanical and optical properties[24]. The good solubility of vaterite can make it a good material for applications in biomedical area.[25]
CaCO3 as other nano particles can change/improve their properties at submicron scale
like: mechanical and optical properties, increased surface area, better barrier effects in a polymer matrix and better chemical reactivity.[30]
Submicron CaCO3 particles are required to improve the rheology and the opacity of paints
and coatings and also as a lubricant additive.[26]
With CaCO3 being produced by a low-cost method it could be applied not only in a few
applications but also replacing silica and titania by a bio-degradable material.[26]
1.3
Nacre
The elaborate properties of nacre come from the intricate structure at many scale levels between an organic matrix and calcium carbonate fibers and tablets[31] which can be seen in Figure 3.
Figure 3 - Scheme of layers of nacre in the outer layer of a pearl[32] ; Interior of a nautilus shell which contains the iridescent nacre[33]
Nacre (Figure 3) and coral had attracted the attention of many orthopedists because they can replace some components used by them that exhibit toxicity, incompatibility and mechanical strength problems.
vitro[37] and in the vertebrae of sheep[38], induce cutaneous fibroblast growth in rats[39]. It gathered much attention by scientist whom try to reproduce the structure of nacre [40]. There is a group of researchers who could produce artificial nacre. [41] It is not easy to control the formation of a specific phase of CaCO3 artificially[42] but in nature, animals can produce
aragonite inside the shell and calcite outside of it. There are some investigations about this selectivity of polymorphs, about the conditions of formation and the role of macromolecules and they suggest the existence of nanoclusters of ACC which are then transformed into the different polymorphs[43][44].
Many aspects in the role of organic matrix in the formation of the skeleton in corals are still enigmatic. Some experiences in vitro showed that the organic matrix have influence in the polymorph phase of the calcium carbonate.[45] They say that the Mediterranean zooxanthellate solitary coral, Balanophyllia europaea, can favor the precipitation of aragonite and stated that a transient amorphous calcium carbonate was stabilized by lipids is involvement.
The organic matrix of: Acropora digitifera, Lophelia pertusa, and Montipora caliculata macromolecules can influence the precipitation of the calcium carbonate too.[46]
Amino-acids are the building units of proteins and they have amino and carboxyl groups simultaneously. Amino-acids can regulate the nucleation, the growth, and the structures of the inorganic crystals.[47]
One recent study also said that four acidic proteins from the genes of Stylophora pistillata can catalyse spontaneously the precipitation of calcium carbonate from sea water.[48]
Valiyaveettil et al. isolated pelovaterin, a glycine-rich peptide from eggshells of a soft-shell turtle. In vitro tests showed that pelovaterin induce the formation of vaterite, modify the crystal morphology and increases their growth rate[49]
2
Materials and Methods
2.1
Synthesis
The synthesis of CaCO3 by precipitation was performed using the following quantities of
reagents: M(CaCl2.2H2O) =147 g/mol; M(NaHCO3) = 84 g/mol; M(C2H6O2) = 62.07 g/mol in
ethylene glycol leading to a mass of m(CaCl2.2H2O)= 147x5x10-3 = 735mg and m(NaHCO3)=
840mg. A quantity of 5 mmol of dehydrated calcium chloride (CaCl2.2H2O), Sigma Aldrich
were dissolved in 50 mL ethylene glycol (99%, Sigma Aldrich) by ultra sounds bath for 2 hours at 40°C. Then 10 mmol of sodium bicarbonate (NaHCO3) Ultra, Sigma Aldrich was dispersed in 50 mL of ethylene glycol by magnetic stirring overnight at 1100 rpm and at ambient temperature. Each flask was filled with 2.5 mL of ethylene glycol with (NaHCO3) and 2.5 mL
of ethylene glycol with CaCl2.2H2O to obtain a molar concentration of (1:2)
(CaCl2.2H2O:NaHCO3). To obtain a solution with a molar concentration of (1:4) instead of a
2.5 ml solution of NaHCO3, it was added 5 ml of NaHCO3 to the final solution. All the
parameters tested are indicated in Table A1. 1 of annex 1.
The resulting dispersion was heated up for different times, from 5 minutes to 24 hours, different temperatures (40°C and 75°C), and for different methods (Ultra-sounds bath in the ultra-sounds machine (Sonorex, Bandelin) of Figure 5 at Lab 213, DCM, FCT-UNL and oil bath (baysilone oil M350 heated in a plate (Heildolph) that can be observed on Figure 4)) at Lab 213, DCM, FCT-UNL.
After preparation, some solutions samples rested for 1 month. The CaCO3 nanoparticles
were separated from the turbid product sol, by washing 4 times with a mixture of water and ethanol 200 µl (1:1) and by centrifugation at 9000 rpm during 20 minutes.
The different solutions were used in a dip-coater where a glass substrate was attached to pneumatic arm of the equipment, the glass was dipped for different parameters: temperature, dip and dry times, number of cycles, alternating with different reagents.
The main reagents were the same prepared for the synthesis of CaCO3 by solution. In
same experiences an in-between cup of water/acetone/PVP-methanol solution was used. All the combinations are presented in the table: Table A1. 2
The films produced by dip-coating were dried at ambient temperature during 2 days.
2.2
Characterization
The produced samples were characterized by observing its surface morphology in an inverted optical microscope (Leica DMi8, at Lab 213, DCM, FCT-UNL) and a representative selection of these samples were analysed also by a scanning electron microscope (SEM - Hitachi S2400 with Bruker light elements EDS, at MicroLab-Electron Microscopy Laboratory of Instituto Superior Técnico). For SEM analysis, the powder or glass coated samples were placed in the sample holder using a carbon ribbon and then covered with a very thin layer of gold.
The compositional/structural analysis was performed by Raman microscopy (Labram 300 Jobin Yvon spectrometer, equipped with a solid state laser operating at 532 nm, at Lab 217,
Departamento de Conservação e Restauro, FCT UNL) and by X-ray diffraction (XRD -
PANalytical X’Pert PRO equipped with an X’Celerator detector using CuKα radiation at 45 kV
and 40 mA, in a Bragg–Brentano configuration. The analysis was performed over the angular
2θ range 10°–80°, with a scanning step of 0.03° at CENIMAT-I3N, FCT-UNL.
3
Results and discussion
The main goal of this work was to obtain calcite (the most stable polymorph of calcium carbonate) by precipitation synthesis and also by dip-coating directly into a glass substrate.
For the precipitation synthesis several parameters were tested as already mentioned in the material and methods section. In the following section, the obtained results are presented and discussed.
3.1
Synthesis of CaCO
3by precipitation
The synthesis of calcium carbonate polymorphs was attempted by varying different process parameters that may influence the growth and the crystal structure.
The calcium carbonate is obtained from the reaction of the CaCl2 (calcium chloride) and
NaHCO3 (sodium bicarbonate) precursors according to the main reaction expected:
CaCl2+ 2NaHCO3→ Ca(HCO3)2(s)+2NaCl
(Ethylene glycol)
Ca(HCO3)2(s)→ CaCO3(s) + CO2(g) + H2O(l)
The above reaction leads to the formation of Ca(HCO3)2 (calcium bicarbonate) and NaCl
(sodium chloride). Therefore, depending on consumption or not of the all carbonate in the source, the NaCl will be a product of reaction and present in all samples. Knowing that, and as the primary goal is to understand how the process parameters affect the formation of the different CaCO3 polymorphs, to help this analysis in the following study the NaCl was not
removed.
Due to a high number of samples produced and limited access to SEM facilities most of the results obtained are related to the observation of samples in an optical microscope, although it is known that the best type of characterization in order to precisely evaluate the formation of CaCO3 in any of their polymorphs (calcite, vaterite….) would be EDS and SEM, XRD and also
3.2
Influence of solution’s temperature, magnetic stir
ring speed
and reaction time
The tables of annex 2 show images obtained in the microscope for the different conditions studied. Table A2. 1 shows the images obtained along the time of reaction and two synthesis temperatures 40°C and 75°C for 400rpm stirring. Table A2. 2 shows the evolution of eleven samples when stirring varies to 800rpm. Table A2. 3 the images for synthesis performed without stirring and Table A2. 4 shows the influence of the ultra sounds bath in five samples. A small drop of solution was extracted from the solution recipient, placed in an observation glass and dried in an oven at 70°C prior observation in the microscope. All the images have the same scale to allow a better comparison between them.
From the results some conclusions were taken. First, the time and magnetic stirring speed plays a great role on the formation of crystals, although we think that the bigger crystals are due to NaCl formed, the time in solution promotes the growth of crystals and the speed seems to decrease their size. Therefore, it was performed a new set of four samples without magnetic stirring and lower temperature.
Low temperatures contribute to the formation of smaller crystals; the non-magnetic stirring allows the formation of larger crystals. This was also observed by other authors. Schuler and Tremel said that particles synthesized by microwave heating without magnetic stirring are
significantly larger (up to 150 nm) and is mainly calcite; when they increased the temperature the medium size of the particles increased too.[26]
Yu-Bin Hu et al. reported that at near-freezing temperature, precipitation of metastable forms of calcium carbonate from solution is favored (ikaite or vaterite).[51]
3.3
Structural and morphologic analysis
From the all samples produced and due to constrains on access of SEM, Raman and XRD, as mentioned already we try to understand the influence of magnetic stir speed by analysis of samples made with a synthesis time of 60min at 40°C. The influence of temperature was analyzed in samples made at 400rpm and 60min at 40°C and 75°C. The influence of reaction time was observed by comparing results of samples performed at 40°C, 400rpm and 5min, 30 min, 60 min and 24h.
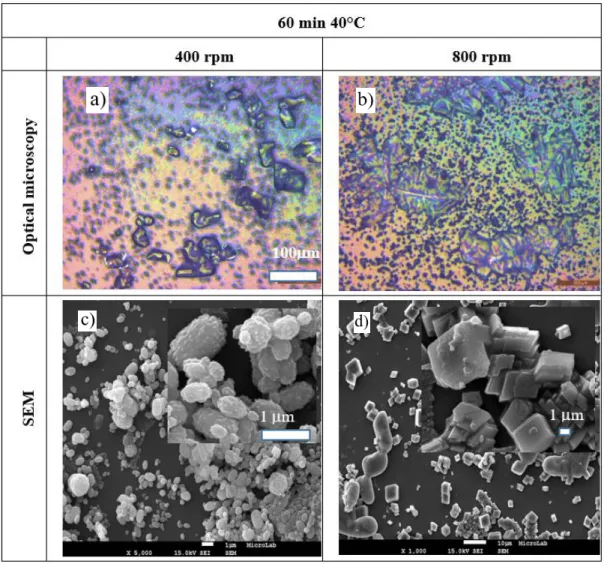
Figure 6 - Images of SEM and optical microscopy for samples synthetized during 60 minutes at 40ºC at 400 rpm and 800rpm magnetic stir. a) Optical microscopy of crystals at 400 rpm. b) Optical microscopy of crystals at 800 rpm. c) SEM image of crystals at 400 rpm. d) SEM image of crystals at 800 rpm.
In the optical microscope in Figure 6 a) it is possible to see the bigger crystals of NaCl (halite) and the small dark particles are vaterite agglomerates. In the Figure 6 b) it is possible to see longer halite crystals and a higher concentration of calcite crystals.
The SEM images confirm the difference in the structure of CaCO3 when magnetic stir
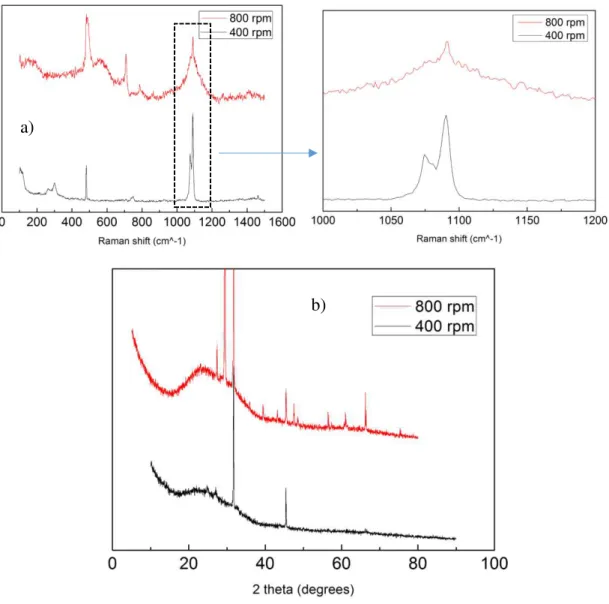
Figure 7- a) – Micro Raman Spectra of samples prepared during 60 min and at 40°C with a different magnetic stir speed b) XRD pattern of samples synthetized at 40°C during 60min with a
different rotation speed
Figure 7 a) for 400rpm sample shows the characteristic peaks of vaterite[54]. The presence of symmetric stretching mode triplets with the highest peak at 1090 cm-1, followed by
the peak at 1074 cm-1 and the lowest peak at 1081 cm-1; and the presence of in-plane bending mode with a 750 cm-1 peak and the lattice modes peaks at 106 cm-1, 263 cm-1 and 302 cm-1.
Figure 7 a) for 800 rpm sample it is displayed the characteristic peaks of mixed calcite a)
The XRD diffractogram of the same samples are shown in Figure 7 b), the sample synthesized with 400rpm of magnetic stir has two highly intense peaks, one at 31.7° and another at 45.4° which are characteristic of NaCl crystal (halite)[57] (JCPDS card number: 05-0628), but the small peaks at 25°, and at 27° represent vaterite[58]. The sample synthetized at 800 rpm of magnetic stir shows the high characteristic peaks from halite at: 31.7° and the small peaks at: 27°; 45.4°; 56°; 66° and at 75° but also shows the calcite peaks[58] at: 29°, 36°, 39°, 47° and at 61°.
With Scherrer equation it is possible to calculate the crystallite size:
𝐷 =β cos(θ)𝐾𝜆
Where D is the mean size of crystallites; K is crystallite shape factor, in this case is 0.94 for FWHM of spherical crystals; λ is the X-ray wavelength, in this case: 0.15418 nm; β is the full width at half the maximum (FWHM) in radians of the X-ray diffraction peak; θ is the
Bragg’s angle.
For the sample prepared at 400 rpm we have D = 28.11 nm; and for the sample prepared at 800 rpm we have D = 77.09 nm
3.3.2
Influence of temperature in supersaturation conditions
The influence of temperature was further detailed for samples synthesized during 60 min and magnetic stir of 400 rpm, and as shown previously corresponds to major CaCO3 vaterite
Figure 8 - Images of SEM and optical microscopy for samples synthetized at 40°C and 75°C. a) Optical microscopy of crystals at 40ºC; b) Optical microscopy of crystals at 75ºC; c) SEM image of crystals at 40ºC; d) SEM image of crystals at 75ºC.
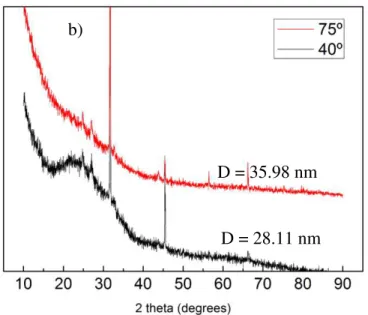
Figure 9 - Samples synthesized during 60 min at 400 rpm with different temperatures: a) Raman spectra; b) XRD pattern.
Figure 8 a) and c) are the same than Figure 6 a) and c). In Figure 8 b) it is possible to see that the NaCl crystals are smaller than in Figure 8 a) but have a more regular cubic shape.
Figure 9 a) compares the Raman spectra of samples synthesized at 40°C and 75°C. The spectrum of sample obtained at 40°C was already presented and identified in Figure 7 a) (400rpm) being identified the respective peaks. Figure 9 b) also shows similar patterns for samples produced with different synthesis temperature. There we see again the main peak of halite at 31.7° and the very small peaks at 45°, 56° and 66°. The peaks at 25°, 27° and 32.8° are from vaterite. Despite the Raman spectra give us the information of vaterite in the sample, in the SEM image of 60 min 75°C 400 rpm we can see unexpectedly what seems to be ACC (amorphous calcium carbonate) [13] because ACC is thermodynamically unstable, and will spontaneously crystallize when suspended in an aqueous solution at ambient temperature.[13]
The XRD data also reveal similar patterns for samples produced at both temperatures and the prevalent diffraction peak is that of halite (NaCl main phase).
3.3.3
Influence of reaction time in supersaturation conditions
The influence of time reaction in the morphology of samples can be observed in Figure D = 28.11 nm
b)
Figure 10 - Images of SEM and optical microscopy for samples synthetized at different reaction times: a) SEM image of crystals at 5 minutes reaction time; b) Optical microscope image of crystals at 5 minutes reaction time; c) SEM image of crystals at 30 minutes reaction time; d) Optical microscope image of crystals at 30 minutes reaction time; e) SEM image of crystals at 60 minutes reaction time; f) Optical microscope image of crystals at 60 minutes reaction time; g) SEM image of crystals at 24 hours reaction time; h) Optical microscope image of crystals at 24 hours reaction time.
In the Figure 10 b) it is possible to see halite crystals with a near cubic-shape and the small dark spots are vaterite aggregates. In Figure 10 d) the dark spots with square shape represent the halite crystals and small white spots are a mix between aragonite and vaterite. Figure 10 f) is the same as Figure 8 a). In Figure 10 h) there are not halite crystals present but it is possible to see the small dark spots from vaterite.
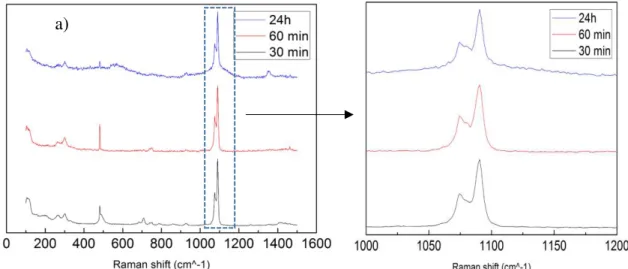
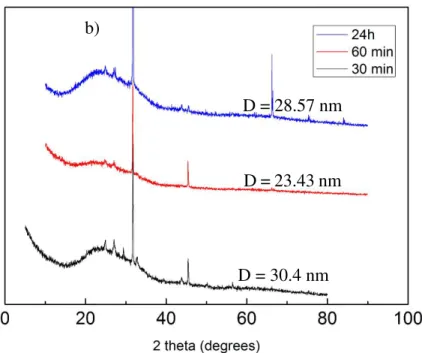
Analysing the SEM images above we can see that the reaction time of the solution does not change much the type of polymorph, but the size does change with a longer reaction time. The Raman spectra and XRD patterns shows vaterite as predominate phase unchanged for the time reaction tested. With 30 minute reaction we could observe some aragonite crystals (identified by the needle-like crystals) and one aragonite peak located at 707 cm-1 also identified in the Raman spectra, beside the others already identified as being due to vaterite phase. Usually aragonite appears only at higher temperatures and in the presence of Magnesium and Mg 2+
ions [19]. At 24 hours reaction time the crystal size decrease abruptly becoming very similar to the asteriscus´s vaterite which is a constituent of the otolith, a calcium carbonate biomineral present in the fish inner ear [59]
The XRD data shows a high intensity peak of halite (NaCl) at 31.7° in the 3 samples.
Although with lower intensity in the 30 minutes’ sample the peaks of vaterite are present and
located at 25°, 27°, 32.8° and 43.8°; it is possible to see also one calcite peak at 29.4°
Figure 11 - Samples synthesized at 400 rpm and 40°C at different reaction time: a) Micro Raman spectra; b) XRD pattern.
3.3.4
Influence of CaCl
2:NaHCO
3ratio
Although the previous study was performed with the ratio of CaCl2*H20:NaHCO3 (1:2)
given by the literature [26] we have tried also to vary the ratio of the precursors and find out its influence on the calcium carbonate polymorphs.
In Figure 12 are shown the microscopy and SEM images of obtained samples for the different ratios tested keeping the reaction temperature at 40°C and magnetic stir at 400rpm. Figure 14 shows the Raman Spectra and XRD pattern of the same samples.
b)
D = 28.57 nm
D = 23.43 nm
Figure 13 - Microscopy and SEM images of samples synthetized at 75°C during 30 minutes for magnetic stir at 400 rpm varying CaCl2*2H20:NaHCO3 ratios: a) SEM image of (1:4 ratio); b) Optical microscope image of (1:4 ratio); c) SEM image of (1:5 ratio); d) Optical microscope image of (1:5 ratio)
Figure 12 d) has the biggest NaCl crystals compared to the other samples, increasing NaHCO3 concentration, the NaCl crystals become smaller.
The SEM images of Figure 12 complemented by microscopy images show how the morphology of samples is influenced by the concentration of NaHCO3 as the one of CaCl2 is
kept constant. A 1:1 ratio the morphology of samples look-like amorphous calcium carbonate (ACC) and this is confirmed in the Raman spectra of Figure 14 a). Increasing the NaHCO3
amount into the solution (1:4) we get spheres of vaterite with some aragonite. Further increase of NaHCO3 in the solution (1:6 ratio of CaCl2:NaHCO3) we get enhanced size crystal with an
unusual shape (a double-cone like shape). In the Raman spectra of Figure 14 it corresponds to a shift to lower wavenumber of vaterite peaks to unknown peaks position: 1030 cm-1, 1062 cm -1 and 1084 cm-1. Those peaks are due to a greater increase of NaHCO
3 (sodium bicarbonate) in
one peak of aragonite at 700 cm-1 [54]; we can also see similar peaks on sample: 30 min 40°C
400 rpm (1:6); at 1027 cm-1, 1062 cm-1.
b)
c) a)
Figure 14 - a) Micro Raman spectra of 4 samples synthesized during 30 minutes at 40°C at 400 RPM with different reagents (CaCl2*2H2O/(NaHCO3)2) ratios. b) Micro Raman spectra of 2
samples synthesized during 30 minutes at 75°C at 400 rpm with different reagents (CaCl2*2H2O/(NaHCO3)2) ratios. c) XRD pattern of 4 samples synthesized during 30 minutes at
40°C at 400 RPM with different reagents (CaCl2*2H2O/(NaHCO3)2) ratios.
For the sample with ratio of 1:1 there are not characteristic peaks from calcium carbonate, so the crystallite size cannot be calculated.
3.4
Purified calcium carbonate powders
The previous study was performed on the samples just as it is synthetized, that is, without any further treatment. Therefore, most of the samples had a high quantity of NaCl which results from the reaction:
CaCl2+ 2NaHCO3→Ca(HCO3)2(s)+2NaCl
(Ethylene glycol)
Ca(HCO3)2(s)→ CaCO3(s) + CO2(g) + H2O(l)
Even knowing that NaCl formed is always the same, as the CaCl2 is the limiting reactant
of the above reaction, it can influence the formation of the CaCO3 polymorphs. Therefore, in
some of the obtained samples the reactions’ products were washed several times in water and ethanol to eliminate NaCl.
The obtained SEM and microscopy images are shown in Figure 15 for the different synthesis conditions used. The corresponding Raman and XRD spectra are shown in Figure 16 a) and b) respectively
7 5 °C 4 0 0 r p m
1 2 0 m in 4 0 °C 4 0 0 r p m 1 2 0 m in 4 0 °C 8 0 0 r p m
1 m
Figure 15 - SEM, microscopy and EDS images of samples washed after preparation: a) SEM image of crystals at 120 minutes 75ºC 400 rpm; b) Optical microscope image of crystals at 120 minutes 75ºC 400 rpm; c) SEM image of crystals at 120 minutes 40ºC 400 rpm; d) Optical microscope image of crystals at 120 minutes 40ºC 400 rpm; e) SEM image of crystals at 120 minutes 40ºC 800 rpm; f) Optical microscope image of crystals at 120 minutes 40ºC 800 rpm; g) SEM image of crystals at 60 minutes 75ºC 800 rpm; h) Optical microscope image of crystals at 60 minutes 75ºC 800 rpm; i) EDS spectrum of the sample at 60 minutes 75ºC 800 rpm.
Analyzing the SEM images in Figure 15 and Raman peaks, the obtained powder samples are all made of calcite. This is confirmed by the 1085, 711, 280 and 155 cm-1 Raman peaks characteristic of calcite [54]. XRD patterns also show the characteristic diffraction peaks of pure calcite at: 29.5°; 36°; 39.5°; 43°; 47.5° and 48.5°[58] The samples prepared rested for 1 month, being extracted 1 mL of solution, washed and dried as stated in the procedure; and as expected vaterite turned into calcite as mentioned by Rodriguez-Blanco et-al[13]. The state for similar reagents and with lower reaction temperature in a Teflon reaction cell, that after 1 hour vaterite crystals begin to transform into calcite crystals and after 20 hours all the vaterite turned into calcite. They also showed that increasing the temperature vaterite turns into calcite faster. In our experiments, initial parameters do not seem to modify much the final result, just with increased rotation speed it is possible to note some small crystals aggregated to bigger ones.
Figure 16- a) Micro Raman spectra and b) XRD pattern of samples washed after synthesis: i. 120 min 75° and 400rpm; ii. 120 min 40° and 400rpm; iii. 120 min 40° and 800rpm and; iv. 60 min,
75° and 800rpm
3.5
Synthesis of CaCO
3films by Dip-Coating
The dip coating was tested with the goal of obtaining directly the calcite films onto a glass substrate. Many parameters of the dip coater can be changed and may influence the final properties of the films. In the following are shown the results obtained for the selected preparation conditions.
3.5.1
Influence of the number of cycles and dip velocity
The influence of dip-coating number of cycles for different conditions: velocity and time of dip (time duration in which the samples was immersed in the calcium carbonate solution) on the absorbance at 1500 nm wavelength are shown in Figure 17. As the absorbance is proportional to the film thickness, we can say that immerging the glass substrate at higher velocity leads to the formation of thicker films. This can be seen by comparing data of 500µm/s and 5mm/s and 3 min dip where the absorbance has a great enhancement for 10 cycles. Keeping the dip velocity ten times lower and increasing the dip time we do not see any remarkable
b)
Figure 17 - Absorbance at 1500 nm versus number of cycles varying the dip time keeping constant T=40°C and 3 min Dry.
The complete study of absorbance spectra for the different coating conditions are shown in Table A3. 1 of annex 3.
3.5.2
Dip-coating with organic compounds (PVP)
In order to mimic nacre and since it is formed with organic compounds, and based on the literature[60] we have tried different conditions for dip-coating with calcium carbonate and organic compounds, PVP. Two different approaches were tested: dip-cycles of glass being immersed sequentially in CaCl2 followed by NaHCO3 and at last PVP, being the cycle repeated
Figure 18 - Absorbance as a function of the number of cycles at 500 nm for different sequences; cycle of 2min dip in the PVP, and 3 min dry for a dip speed 5mm/s, ambient temperature of 27°C
and 10 seconds of dip time in the inorganic reagents.
Clearly is shown a linear increase of the absorbance at 500 nm with the number of cycles for both dip-conditions, however the films growth faster when first is formed the CaCO3 with
the sequence of dip in CaCl2 and NaHCO3 and then immersed in PVP than when it is immersed
in PVP in between. Although the PVP layer formed in a single dip is thinner it seems to be thicker enough to cover some CaCl2 firstly adsorbed in the glass surface and prevents its
reaction with NaHCO3 in the subsequent dip.
Other sequences were also tried and the absorption and reflectance spectra of samples produced with 10 dip-coating cycles are shown in Figure 19 a) and b) respectively. Besides the absorbance spectra of CaCl2/NaHCO3/PVP and CaCl2/PVP/NaHCO3/PVP corresponding to the
Figure 19 was also tested CaCO3/PVP and CaCl2/sea water/PVP. The absorption spectra reveal
Figure 19 - a) Absorbance and b) reflectance as a function of the wavelength for different sequences of cups at 10 cycles; cycle of 2min dip in the organic cup, and 3 min dry for a dip speed 5mm/s, ambient temperature of
27°C and 10 seconds of dip time in the inorganic reagents.
Figure 20 - a) and b) SEM images of the dip coated samples respectively for 20 cycles, T amb(27°C), 1 min dip, acetone and 10 cycles, 40°C, 3 min dip; c) Raman spectra of dip-coated samples at 5 mm/s and 3 min dry time with different number of cycles, different temperature, different dip and with/without in-between cup, d) XRD pattern of sample dip- coated at ambient temperature and at 5 mm/s with cup of acetone dipped during 2 secs in-between the inorganic cups
The Raman spectra of two dip-coated samples we can see the characteristic peaks from vaterite [54] the v1 (symmetric stretching mode) triplets with the highest peak at 1090 cm-1,
4
Conclusions and future perspectives
One of the goals of this thesis was to obtain pure CaCO3 by chemical reaction. Several
parameters of the reaction were modified in order to understand their influence in the formation of CaCO3 polymorphs. The changed parameters of the reaction were: temperature, time, stirring
speed, different concentration of reagents and influence of the medium (oil bath or ultra-sounds). The reactants were CaCl2 (calcium chloride) and NaHCO3 (sodium bicarbonate) and
the solvent was ethylene glycol (C2H6O2).
From this study a generic conclusion based on the observation of samples in microscope was taken: the time and magnetic stirring speed plays a great role on the formation of crystals, the time in solution promotes de growth of crystals and the stirring speed seems to contribute to decrease the size of the formed crystals. Higher temperature contributed to the formation of higher crystals and the absence of magnetic stirring lead to the formation of larger crystals.
A more detailed analysis based on the SEM, Raman, XRD e EDS analysis lead to the following conclusions:
- The variation of magnetic stirring from 400rpm to 800rpm induces a change of CaCO3 in the
form of vaterite to calcite.
This was confirmed by the morphology of crystals formed, vaterite contains very small crystals that are aggregated to form elongated structures. Raman and XRD also confirm the existence of the vaterite finger-print peaks. A high intense doublet-peak at 1090 and 1074cm-1
in Raman spectra, while by XRD the peaks of vaterite at 25º and 27º are present. The calcite was identified by its typical morphology in SEM images, the cubic shape of crystals with a wide dispersion of sizes, from nanometers to dozen of micrometers and confirmed in XRD pattern with the main intense peak at 29º related to (104) diffraction planes.
- The temperature and reaction time has no influence on CaCO3 structure, although it seemed
to enhance the growth of crystals.
In fact, the SEM images show more compact structure formed by collate nanometric crystals when the synthesis temperature is 75ºC instead 40ºC. Raman spectra and XRD patterns are very similar for samples synthesized at these temperatures. While for the reaction time the quantity of vaterite crystals are significantly higher for the same quantity of solution sampled.
- The variation of CaCl2*2H2O:NaHCO3 ratios for samples synthetized at 40°C and 75ºC for
at 1:2 ratios, some aragonite is also formed at this ratio. For the ratio 1:4 the aggregation forms a double-cone like shape, very unusual, the same is obtained for 1:6 ratios, in these also amorphous calcium carbonate was observed. The enhancement of temperature to 75ºC for the 1:4 and 1:5 ratios leads to the formation of aragonite plate-like structure.
All the above conclusions were taken from the study performed without purification of samples and so the NaCl, as a product of reaction, is always present.
The purification of crystals was performed by washing the obtained solutions in water and ethanol and then centrifugation, being obtained pure calcite.
The second goal of this work was to explore dip-coating technique as an attempt to produce nacre alternating between an organic and inorganic solution. Several parameters varied such as temperature, dip and dry time, with/without in-between cup, number of cycles, dipping speed.
We conclude that for the dipping speed studied 500µm/s and 5mm/s the absorbance is higher for later for the same number of cycles. When alternating the reaction of CaCl2 and
NaHCO3 the growth of films increases, although it is more remarkable for the sequence
CaCl2/NaHCO3/PVP than for CaCl2/PVP/NaHCO3/PVP. The obtained films are formed by a
mixture of vaterite and calcite.
From this work we can conclude that it is possible to produce calcium carbonate and its polymorphs in simple ways like the classical precipitation method and the new dip-coating method. The conditions of obtaining, by chemical reaction, vaterite, calcite or aragonite were identified. By dip-coating technique we got a mixture of the reactants of calcium carbonate with an organic solution of PVP and obtained an organic/inorganic complex nacre-like structure.
Overall, a background study was performed that could be explore in further works. Other variations of the parameters in the solution and in the dip-coating can be explored like the further increase of the temperature and the addition of Mg in the solution to obtain aragonite and produce iridescent nacre instead of the lackluster compound obtained.[12]
References
[1] S. Mann, Biomineralization. Oxford Chemistry Masters, 2001.
[2] Y. Guo, F. Wang, J. Zhang, and L. Yang, “Biomimetic synthesis of calcium carbonate with different morphologies under the direction of different amino acids” pp. 2407–2415, 2013.
[3] P. Somasundaran and G. . Agar, “The zero point of charge of calcite” J. Colloid Interface Sci., vol. 24, no. 4, pp. 433–440, 1967.
[4] F. Lippmann, Sedimentary Carbonate Minerals, vol. 6. Springer, 1973.
[5] J. Rieger, T. Frechen, G. Cox, C. Schmidt, and J. Thieme, “Precursor structures in the crystallization/precipitation processes of CaCO3 and control of particle formation by polyelectrolytes” Faraday Discuss., no. 136, pp. 265–277, 2007.
[6] L. Gower, “Biomimetic model systems for investigating the amorphous precursor
pathway and its role in biomineralization,” Chem. Rev., vol. 108, pp. 4551–4627 2008.
[7] D. Gebauer, “Proto-Calcite and Proto-Vaterite in Amorphous Calcium Carbonates” Angew. Chemie-International Ed., vol. 49, no. 47, pp. 8889–8891, 2010.
[10]
“http://scitec.uniurb.it/dipartimenti/digeoteca/collezionefranchin/campioni_per_ classe.php?classe=Carbonati%20e%20Nitrati.” . accessed in 2016-10-07
[11] “http://geology.com/minerals/calcite.shtml.” . accessed in 2016-10-07
[12] M. Pérez-estébanez, Š. Radek, M. Pérez-estébanez, A. Viani, Š. Petr, and P.
Mácová, “Characterization of vaterite synthesized at various temperatures and
stirring velocities without use of additives stirring velocities without use of additives” Powder Technol., vol. 284, no. November, pp. 265–271, 2015.
[13] J. D. R. Blanco, S. Shawa, and L. G. Benninga, “The kinetics and mechanisms of amorphous calcium carbonate (ACC) crystallization to calcite, viavaterite.”
Nanoscale, vol. 3, pp. 265–271, 2011.
[14] J. Carmona, J. Gómez-Morales, and R. R. Clemente, “Rhombohedral -scalenohedral calcite transition produced by adjusting the solution electrical conductivity in the system Ca(OH)(2)-CO2-H2O” J. Colloid Interface Sci., vol. 261, pp. 434–440, 2003.
[15] S. R. Dickinson, G. E. Henderson, and K. M. McGrath, “Controlling the kinetic versus thermodynamic crystallisation of calcium carbonate” J. Cryst. Growth, vol. 244, no. 3–4, pp. 369–378, 2002.
[16] N. Spanos and P. Koutsoukos, “Kinetics of Precipitation of Calcium Carbonate in Alkaline pH at Constant Supersaturation. Spontaneous and Seeded Growth” J. Phys. Chem. B, vol. 102, no. 34, pp. 6679–6684, 1998.
[17] G. Hadiko, Y. S. Han, M. Fuji, and M. Takahashi, “Synthesis of hollow calcium carbonate particles by the bubble templating method” Mater. Lett., vol. 59, no. 19– 20, pp. 2519–2522, 2005.
[20] R. Dongni, G. Yonghua, and F. Qingling, “Comparative study on nano-mechanics and thermodynamics of fish otoliths.” Mat. Sci. Eng. C-Mater, vol. 33, pp. 9–14, 2013.
[21] N.A. Palchik and T. N. Moroz, “Polymorph modifications of calcium carbonate in gallstones” J. Cryst. Growth, vol. 283, no. 3–4, pp. 450–456, 2005.
[22] J. Renkel, S. Hobe, M. Susewind, and D. E. Jacob, “Designed peptides for
biomineral polymorph recognition : a case study for calcium carbonate” J. Mater. Chem. B, vol. 3, pp. 3511–3518, 2014.
[23] L. Qiao, Q. L. Feng, and Z. Li, “Special Vaterite Found in Freshwater Lackluster Pearls” Cryst. Growth Des., vol. 7, no. 2, pp. 275–279, 2007.
[24] R. G. Jones and W. L. Davis, “Calcium-containing lysosomes in the outer mantle epithelial cells of Amblema, a fresh-water mollusc” Anat. Rec., vol. 203, no. 3, pp. 337–343, 1982.
[25] D. Ren, O. Albert, W. Muller, and Q. L. Feng, “Primary cell culture of fresh water Hyriopsis cumingii mantle/pearl sac tissues and its effect on calcium carbonate mineralization” Cryst. Growth Des., vol. 14, no. 3, pp. 1149–1157, 2014.
[26] T. Schuler and W. Tremel, “Versatile wet-chemical synthesis of non-agglomerated CaCO3 vaterite nanoparticles” Chem. Commun., vol. 47, pp. 5208–5210, 2011.
[27] Z. Li, T. Wen, Y. Su, X. Wei, C. He, and D. Wang, “Hollow hydroxyapatite spheres fabrication with three-dimensional hydrogel template” CrystEngComm, vol. 16, pp. 4202–4209, 2014.
[30] H. Gleiter, “Nanostructured materials: basic concepts and microstructure” Acta Mater., vol. 48, no. 1, pp. 1–29, 2000.
[31] G. E, S. WW, U. HS, H. J, N. F, M. B, and Z. A, “Homoepitaxial meso- and microscale crystal co-orientation and organic matrix network structure in Mytilus edulis nacre and calcite.” Acta Biomater., vol. 9, no. 12, pp. 9492–9502, 2013.
[32] “http://nature.berkeley.edu/classes/eps2//wisc/oLect17.html.” . accessed in 2016-10-07
[33] “http://www.nautilusdivingbali.com/about-nautilus.” . accessed in 2016-10-07
[34] S. Hamza, N. Slimane, Z. Azarib, and G. Pluvinageb, “Structural and mechanical properties of the coral and nacre and the potentiality of their use as bone substitutes” Appl. Surf. Sci., vol. 264, pp. 485–491, 2013.
[35] N. H. Munro and K. M. McGrath, “How important is polyelectrolyte complex formation in biomimetic mineralisation? Manipulation via alcohol addition” Dalt. Trans., vol. 42, no. 23, pp. 8259–8269, 2013.
[36] H. Xu, K. Huang, Q. Gao, Z. Gao, and X. Han, “A study on the prevention and treatment of myopia with nacre on chicks.” Pharmacol Res., vol. 44, no. 1, pp. 1– 6, 2001.
[37] M. Lamghari, M. . Almeida, S. Berland, H. Huet, A. Laurent, C. Milet, and E.
Lopez, “Stimulation of bone marrow cells and bone formation by nacre: in vivo and in vitro studies” Bone, vol. 25, no. 2, p. 91s–94s, 1999.
[40] E. Munch, M. Launey, D. Alsem, E. Saiz, A. Tomsia, and R. Ritchie, “Tough, bio -inspired hybrid materials” Science, vol. 322, no. 5907, pp. 1516–1520, 2008.
[41] A. Finnemore, P. Cunha, T. Shean, S. Vignolini, S. Guldin, M. Oyen, and U.
Steiner, “Biomimetic layer-by-layer assembly of artificial nacre” Nat. Commun., vol. 3, no. 966, 2012.
[42] J. E. Parker, S. P. Thompson, A. R. Lennie, J. Pottera, and C. C. Tang, “A study of the aragonite-calcite transformation using Raman spectroscopy, synchrotron powder diffraction and scanning electron microscopy” CrystEngComm, vol. 12, pp. 1590–1599, 2010.
[43] D. Gebauer, A. Völkel, and H. Cölfen, “Stable prenucleation calcium carbonate clusters” Science., vol. 322, no. 5909, pp. 1819–1822, 2008.
[44] E. S. Tjandra, R. A. Boulos, P. C. Duncanc, and C. L. Raston, “Unfastening pearl nacre nanostructures under shear” CrystEngComm, vol. 15, pp. 6896–6900, 2013.
[45] S. Goffredo, P. Vergni, M. Reggi, E. Caroselli, F. Sparla, O. Levy, Z. Dubinsky, and G. Falini, “The skeletal organic matrix from Mediterranean coral Balanophyllia europaea influences calcium carbonate precipitation.” PLoS One., vol. 6, no. 7, p. e22338, 2011.
[46] M. Reggi, S. Fermani, V. Landi, F. Sparla, E. Caroselli, F. Gizz, Z. Dubinsky, O. Levy, J.-P. Cuif, and Y. Dauphin, “Biomineralization in Mediterranean Corals: The Role of the Intraskeletal Organic Matrix” Cryst. Growth Des., vol. 14, no. 9, pp. 4310–4320, 2014.
[47] H. Tong, W. Ma, L. Wang, P. Wan, J. Hu, and L. Cao, “Control over the crystal phase, shape, size and aggregation of calcium carbonate via a L-aspartic acid inducing process.” Biomaterials., vol. 25, no. 17, pp. 3923–3929, 2004.
“Designed peptides for biomineral polymorph recognition: a case study for calcium carbonate” J. Mater. Chem. B, vol. 2, pp. 3511–3518, 2014.
[50] W. Zhu, C.-H. Lu, and Feng-Chih Chang, “Supramolecular ionic strength -modulating microstructures and properties of nacre-like biomimetic nanocomposites containing high loading clay” RSC Adv., vol. 2, no. 15, pp. 6295– 6305, 2012.
[51] Y.-B. Hu, M. Wolthers, D. A. Wolf-Gladrow, and G. Nehrke, “Effect of pH and Phosphate on Calcium Carbonate Polymorphs Precipitated at near-Freezing Temperature” Cryst. Growth Des., vol. 15, no. 4, pp. 1596–1601, 2015.
[52] E. L. Sharp, H. Al-Shehri, T. S. Horozov, S. D. Stoyanov, and V. N. Paunov,
“Adsorption of shape-anisotropic and porous particles at the air–water and the decane–water interface studied by the gel trapping technique” RSC Adv., vol. 4, no. 5, pp. 2205–2213, 2014.
[53] C. Shivkumara, P. Singh, A. Gupta, and M. S. Hegde, “Synthesis of vaterite CaCO3 by direct precipitation using glycine and l-alanine as directing agents”
Mater. Res. Bull., vol. 41, no. 8, pp. 1455–1460, 2006.
[54] U. Wehrmeister, A. L. Soldati, D. E. Jacob, T. Häger, and W. Hofmeister, “Raman spectroscopy of synthetic, geological and biological vaterite: a Raman spectroscopic study” J. Raman Spectrosc., vol. 41, no. 2, pp. 193–201, 2009.
[55] U. Wehrmeister, D. E. Jacob, A. L. Soldati, N. Loges, T. Häger, and W. Hofmeister, “Amorphous, nanocrystalline and crystalline calcium carbonates in biological materials” Amorph. nanocrystalline Cryst. calcium carbonates Biol. Mater., vol. 42, no. 5, pp. 926–935, 2010.
[56] K. Krishnan and R. S. Krishnan, “Raman and infrared spectra of ethylene glycol”
Proc. Indian Acad. Sci. - Sect. A, vol. 64, no. 2, 1966.
tertiary calcium carbonate mixtures using powder X-ray diffraction” Analyst, vol. 126, no. 7, pp. 1118–1121, 2001.
[59] D. Ren, Y. Ma, Z. Li, Y. Gao, and Q. Feng, “Hierarchical structure of asteriscus and in vitro mineralization on asteriscus substrate.” J. Cryst. Growth, vol. 325, no. 1, pp. 46–51, 2011.
[60] A. Sellinger, P. M. Weiss, A. Nguyen, Y. Lu, R. A. Assink1, W. Gong, and J.
Brinker, “Continuous self-assembly of organic–inorganic nanocomposite coatings that mimic nacre” Nature, vol. 394, pp. 256–260, 1998.
Annex 1
Table A1. 1: Solution parameters tested
CaCl2.2H2O (mmol) +50mL ethylene glycol NaHCO3(mmol)+ 50mL ethylene glycol
Temperature © Reaction time (min)
Rotation speed (rpm)
Method
5 10 40
2 Ultra-sound bath 5 10 30 60 CaCl2.2H2O (mmol) +50mL ethylene glycol NaHCO3(mmol)+ 50mL ethylene glycol
Temperature © Reaction time (min)
Rotation Speed
(rpm)
Method
5 10
40
5
400 e 800
Oil bath 10 30 60 120 24 hours 75 5 10 30 60 120 5 5 40
30 400
15
20 30
5 20 75
Table A1. 2: Dip-coating parameters used
Speed Cycles Temperature Dip Dry In-between cup
500 um/s 3 22°C 1 min 3 min
5
10
500um/s 3 40°C 1 min 3 min
5
10
500um/s 3 40°C 3 min 3 min
5
10
500um/s 3 40°C 5 min 3 min
5
10
5mm/s 3 22°C 3 min 1 seg
5
10
5mm/s 3 40°C 3 min 3 min
5
10
5mm/s 3 40°C 3 min 1 seg
5
10
5mm/s 10 22°C 3 min 3 min Water/2 sec
20
5mm/s 10 22°C 10 min 3 min Water/2 sec
5mm/s 5 22°C 1 min 3 min Acetone/2 sec
10
20
5mm/s 5 22°C 10 seg 3 min Acetone/2 sec
10
20
Ca/Na/PVP
5mm/s 5 22°C 10 seg 3 min Methanol/PVP/2 min
10
15
20
Ca/PVP/Na/PVP
5mm/s 5 22°C 10 seg 3 min Methanol/PVP/2 min
10
15
20
Ca/Sea Water/PVP
5mm/s 5 22°C 10 seg 3 min Methanol/PVP/2 min
10
15
Annex 2
Table A2. 1: Influence of time and temperature for a solution with magnetic stir at 400rpm.
Time 400 rpm
40°C 75°C
5 min
10 min
30 min
60 min
120min
24h
Table A2. 2: Influence of time and temperature for a solution with magnetic stir at 800rpm.
800rpm
40°C 75°C
5 min
10 min
30 min
60 min
120 min
Table A2. 3: Influence of time and temperature for a solution without magnetic stir.
No magnetic stir
10 min 30 min
10°C
60 min 120min
40°C Tamb (dried at 70°C)
120 min
75°C
Table A2. 4: Influence of the ultra-sounds in the solution
Ultra-sounds 40ºC
2
min 5min
1
0
min
3
0
min
6
0
min
Annex 3
Table A3. 1: Influence of dip parameters and dip cycles in the transmittance of samples with the respective images of films taken in the microscope.
Influence of dip velocity
0 0.05 0.1 0.15 0.2 0.25 0.3 0.35
0 500 1000 1500 2000 2500 3000
Ab so rb an ce Wavelength (nm)
T 40ºC, 500um/s, 3 min Dip,
3 min Dry
3 cycles 5 cycles 10 cycles
0 0.1 0.2 0.3 0.4 0.5 0.6
0 500 1000 1500 2000 2500 3000
Ab so rb an ce Wavelength (nm)
T 40°C, 5mm/s, 3 min Dip,
3 min Dry
Influence of temperature 0 0.05 0.1 0.15 0.2 0.25 0.3 0.35
0 500 1000 1500 2000 2500 3000
Ab so rb an ce Wavelength (nm)
T ambiente (22°C), 500um/s,
1min Dip, 3 min Dry
3 cycles 5 cycles 10 cycles
0 0.05 0.1 0.15 0.2 0.25 0.3 0.35
0 500 1000 1500 2000 2500 3000
Ab so rb an ce Wavelength(nm)
T 40°C, 500um/s, 1 min Dip,
3 min Dry
0 0.05 0.1 0.15 0.2 0.25 0.3
0 500 1000 1500 2000 2500 3000
Ab so rb an ce Wavelength (nm)
T 40°C, 500um/s, 5 min Dip,
3 min Dry
3 cycles 5 cycles 10 cycles
0 0.05 0.1 0.15 0.2 0.25 0.3 0.35 0.4
0 500 1000 1500 2000 2500 3000
Ab
so
rb
an
ce
Wavelength ( nm)
T 40°C, 5 mm/s,
3min Dip, 1 seg Dry
Cycles variation
Dip in solution/acetone and dry in between
0 0.05 0.1 0.15 0.2 0.25 0.3 0.35
0 500 1000 1500 2000 2500 3000
Ab so rb an ce Wavelength (nm)
T ambi(22°C), 5 mm/s, 3 min
Dip, 1 seg Dry
3 cycles 5 cycles 10 cycles
0 0.5 1 1.5 2 2.5
0 500 1000 1500 2000 2500 3000
Ab
so
rb
an
ce
T ambi(22°C), 5 mm/s, 1 min
Dip, 3 min Dry, Acetone (2
Dry in air 0 0.05 0.1 0.15 0.2 0.25 0.3 0.35
0 500 1000 1500 2000 2500 3000
Ab so rb an ce Wavelength (nm)
T ambiente (22°C), 500um/s,
1minute Dip, 3 minutes Dry
3 cycles 5 cycles 10 cycles
0 0.02 0.04 0.06 0.08 0.1 0.12 0.14 0.16 0.18 0.2
0 500 1000 1500 2000 2500 3000
Ab so rb an ce Wavelength (nm)
T ambi(22°C), 5mm/s, 3min
Dip, 1 seg Dry, Water(2 secs)
0 0.5 1 1.5 2 2.5
0 500 1000 1500 2000 2500 3000
Ab so rb an ce Wavelength (nm)
CaCl
2/NaHCO
3/PVP
Metanol/PVP 2min, 3 min dry,
5 mm/s, T amb (27ºC), 10 seg dip
5 cycles 10 cycles 15 cycles 20 cycles
0 0.5 1 1.5 2 2.5
0 500 1000 1500 2000 2500 3000
Ab so rb an ce Wavelength (nm)
CaCl
2/NaHCO
3/PVP
150°C 1 hour
Metanol/PVP 2min, 3 min dry,
5 mm/s, T amb (27ºC), 10 seg dip
0 0.5 1 1.5 2 2.5
0 500 1000 1500 2000 2500 3000
Ab so rb an ce Wavelength (nm)
CaCl
2/PVP/NaHCO
3/PVP
Metanol/PVP 2min, 3 min dry,
5 mm/s, T amb (27ºC), 10 seg dip
5 cycles 10 cycles 20 cycles
0 0.2 0.4 0.6 0.8 1 1.2 1.4 1.6 1.8 2
0 500 1000 1500 2000 2500 3000
Ab so rb an ce Wavelength (nm)
CaCl
2/PVP/NaHCO
3/PVP 150ºC 1hour
Metanol/PVP 2min, 3 min dry,
5 mm/s, T amb (27ºC), 10 seg dip
0 0.05 0.1 0.15 0.2 0.25
0 500 1000 1500 2000 2500 3000
Ab so rb an ce Wavelength (nm)
CaCO
3/PVP
Metanol/PVP 2min, 3
min dry, 5 mm/s, T amb (27ºC),
10 seg dip
5 cycles 10 cycles 15 cycles 20 cycles
0 0.05 0.1 0.15 0.2 0.25
0 500 1000 1500 2000 2500 3000
Ab so rb an ce Wavelength (nm)
CaCO
3/PVP
150ºC 1hour
Metanol/PVP
2min, 3 min dry, 5 mm/s, T amb
(27ºC), 10 seg dip
0 0.05 0.1 0.15 0.2 0.25
0 500 1000 1500 2000 2500 3000
Ab
so
rb
an
ce
Wavelength (nm)
![Figure 1 - Calcium carbonate crystals in nature, from left to right: Aragonite[9]; Vaterite[10];](https://thumb-eu.123doks.com/thumbv2/123dok_br/16698627.743922/22.892.126.785.583.767/figure-calcium-carbonate-crystals-nature-right-aragonite-vaterite.webp)

![Figure 3 - Scheme of layers of nacre in the outer layer of a pearl[32] ; Interior of a nautilus shell which contains the iridescent nacre[33]](https://thumb-eu.123doks.com/thumbv2/123dok_br/16698627.743922/24.892.159.780.496.695/figure-scheme-layers-nacre-interior-nautilus-contains-iridescent.webp)