online | memorias.ioc.fiocruz.br
Spatial modeling of cutaneous leishmaniasis
in the Andean region of Colombia
Mauricio Pérez-Flórez1,2/+, Clara Beatriz Ocampo1, Carlos Valderrama-Ardila3, Neal Alexander1
1Centro Internacional de Entrenamiento e Investigaciones Médicas, Cali, Colombia
2Pontificia Universidad Javeriana, Cali, Colombia 3Universidad Icesi, Departamento de Ciencias Biológicas, Cali, Colombia
The objective of this research was to identify environmental risk factors for cutaneous leishmaniasis (CL) in Colombia and map high-risk municipalities. The study area was the Colombian Andean region, comprising 715 rural and urban municipalities. We used 10 years of CL surveillance: 2000-2009. We used spatial-temporal analysis - conditional autoregressive Poisson random effects modelling - in a Bayesian framework to model the dependence of municipality-level incidence on land use, climate, elevation and population density. Bivariable spatial analysis identified rainforests, forests and secondary vegetation, temperature, and annual precipitation as positively ated with CL incidence. By contrast, livestock agroecosystems and temperature seasonality were negatively associ-ated. Multivariable analysis identified land use - rainforests and agro-livestock - and climate - temperature, rainfall and temperature seasonality - as best predictors of CL. We conclude that climate and land use can be used to identify areas at high risk of CL and that this approach is potentially applicable elsewhere in Latin America.
Key words: cutaneous leishmaniasis - environmental risk factors - Colombian Andean region - spatial analysis
doi: 10.1590/0074-02760160074
+ Corresponding author: [email protected] Received 26 February 2016
Accepted 27 May 2016
The World Health Organization (WHO) has classi-fied leishmaniasis as a serious global public health prob-lem, and as a neglected and re-emergent disease (WHO 2007). It comprises a group of diseases - cutaneous (CL), muco-cutaneous (ML) and visceral (VL) - caused by Leishmania parasites which, in the Americas, are trans-mitted by female Lutzomyia sandflies (Chaves & Pascual 2006). Like all vector-borne infectious diseases (VBD), leishmaniasis is highly sensitive to environmental fac-tors (Weber 2010). Climate affects the biology and ecol-ogy of the triad parasite-vector-reservoir, and hence the disease’s spatial and temporal distribution (Ready 2010).
Vector distributions have been found to track envi-ronmental changes (Gebre-Michael et al. 2004, Michal-sky et al. 2009), and WHO is promoting integration of new technological VBD monitoring tools, such as remote sensing and geographic information systems (GIS) (Bavia et al. 2005). Factors such as temperature, precipitation, vegetation cover, land use and natural phenomena such as El Niño or La Niña, have been associated with the oc-currence of CL or VL, in patterns which depend on the region, ecological context and vector species (King et al. 2004, Bhunia et al. 2010, Valderrama-Ardila et al. 2010).
The global incidence of CL is estimated at 1.5 million new cases each year (OMS 2010). In the Americas the reported CL cases/year was 66,941 between 2003-2008 (Alvar et al. 2012). In Colombia the annual number of
reported cases has increased from an average of approxi-mately 6,500 in the 1990s; 14,000 in the 2000s; to 17,420 between 2005-2009, CL comprising more than 95% of these (INS 2010, Alvar et al. 2012). Major epidemics in Colombia have occurred in the Andean region (Pardo et al. 1999, 2006, Cárdenas et al. 2005, 2006, Flórez et al. 2006, Santamaria et al. 2006, Rodríguez-Barraquer et al. 2008), with Lutzomyia species from the verrucarum group being the dominant vectors (Bejarano et al. 2003). The current study seeks to identify environmental factors associated with the incidence of CL in the Co-lombian Andes and hence map the risk at the level of municipality. This map is expected to serve as a support tool for surveillance of leishmaniasis in Colombia and contribute to reducing the impact of this disease.
MATERIALS AND METHODS
Population and study area - The study area was the Colombian Andean region which comprises 24.5% of the country’s land surface area, or 278,600 km2
(Et-ter & van Wyngaarden 2000) and includes the wes(Et-tern, central and eastern mountain ranges (cordilleras), and much of the Magdalena and Cauca river valleys (Fig. 1). More specifically, we followed the definition used by the Instituto Alexander von Humboldt (IAvH) by tak-ing those parts of the country above 400 m (Rodríguez et al. 2006). This region is characterised by a mosaic of savanna ecological regions, tropical forests and wooded areas with diverse topography, climate and vegetation (King et al. 2004, Sandoval et al. 2006, Cárdenas et al. 2008). It also includes large areas devoted to agriculture as well as the country’s most populous cities.
those 715 having more than 90% of their area within this region, i.e. altitude above 400 m. These 715 municipali-ties belong mainly (n = 696) to 13 Andean departments (states) (Boyacá, Cundinamarca, Antioquia, Santander, Nariño, Tolima, Valle del Cauca, Cauca, Huila, Norte de Santander, Caldas, Risaralda and Quindío), with the re-maining 19 from six other departments (Casanare, Meta, Putumayo, Chocó, Bolivar and Cesar). According to the DANE (2005) national census, the population of these 715 municipalities was 27,416,481 (66.1% of national to-tal), averaging approximately 38,000 each.
Variables and sources - CL incidence - The outcome of interest is the annual incidence rate of CL for the period 2000-2009. The numerator (annual number of CL cases by municipality) comes from the mandatory reporting
system SIVIGILA, supplied by the Ministry of Health and Social Protection (Ministerio de Salud y Protección Social or MSPS) and are new and recurrent reported cases of CL. Data were considered good quality, and retained in the analysis, if they had information on municipality of origin and type of disease (CL, ML or VL). The denomi-nator (number of people) at the middle of the study pe-riod was taken from the DANE (2005) national census or population projections. The latter were used when DANE reported partial information on the number of inhabitants due to access problems at the time of the census.
We use all available environmental variables. We consider 31 variables as potential environmental risk factors: 19 climatic, one topographic, one demographic and 10 on land use.
Land use - Land use was obtained from the Colom-bian Andes ecosystems map of IAvH which was made at a scale of 1:250,000 (IAvH 2005, Rodríguez et al. 2006) from interpretation of satellite images and thematic inmation for the year 2005. This map is in digital raster for-mat (.img) of 32x32 metres but was manipulated in vector format. The 1:250,000 scale refers to the level of detail at which satellite images were interpreted. This map identi-fies 142 different ecosystems of the Colombian Andean region (112 natural and 30 modified) (Rodríguez et al. 2006), grouped in 10 categories of coverage for the cur-rent study: rainforests; dry forests; forest and secondary vegetation; shrub and xeric vegetation; páramo (alpine ecosystem above the tree line) and snow; coffee agroeco-systems; mechanised crops (rice and sugarcane); livestock agroecosystems; unmechanised crops, such as fruit, veg-etables and intercropping; others (urban areas, marshes, ponds, lakes, lagoons, rivers, beaches, wasteland, etc.).
Climate - Bioclimatic variables (Supplementary data) come from remote sensing systems available in the World-Clim database (http://www.worldclim.org). We used 19 cli-mate surfaces (raster format at spatial resolution of 1 km) derived from monthly values of temperature (ºC) and pre-cipitation (mm), e.g. annual average, prepre-cipitation or mean temperature in the coldest quarter, and similarly for the warmest, wettest and driest quarters (Hijmans et al. 2005).
Elevation - A raster image of a NASA digital eleva-tion model was acquired in EROS Data Center (edc.usgs. gov), from the mission “Shuttle Radar Topography Mis-sion - SRTM”, at a resolution of 3 arc-seconds (~90m).
Population density - Population density (Fig. 1), i.e. the number of inhabitants per square kilometre, was ob-tained for each municipality, based on the DANE (2005) national census and a digital of map of the municipalities from IGAC (1:100.000).
Information processing - ArcMap 9.3 software with Spatial Analyst was used for analysis of shapefile and raster data, and for extracting numeric data from satel-lite images. It was used to overlap the map of munici-palities with the ecosystem (ground coverage) map and the 19 bioclimatic and elevation layers. Then summary statistics were obtained for each municipality, such as percentage coverage with each ecosystem, and averages of climatic variables and elevation.
Statistical analysis - Correlation analysis - Collinear-ity between the variables, in terms of Spearman’s correla-tion coefficient (r), was used to guide data reduction.
Spatial analysis - We used a random-effects Poisson model, allowing spatial correlation via an intrinsic condi-tional autoregressive (CAR) prior. The response variable (Yit) was the total number of CL cases in municipality i by year in 2000-2009 (t= 1,…,10), and independent vari-ables (xi) were the selected land use and climatic factors, population density and year (Supplementary data). The model included a logarithmic link function and loga-rithm of population size as an offset, so that exponentiat-ing the regression coefficients ai estimates incidence rate ratios (IRRs), not standardised for age. These are report-ed with their respective Bayesian 95% crreport-edible intervals
(95% CIcred). We chose this CAR model as it takes into account the lack of independence in the data - i.e. spatial autocorrelation - and uses it to improve estimates based on neighbor information (Gelfand & Vounatsou 2003, Heinen & Rengifo 2003, Ready 2008). We also included unstructured random effects (Thomas et al. 2004). For the annual average temperature, a quadratic relationship was considered because of the vector’s aversion to ex-treme hot or cold and predominance at intermediate alti-tudes (Pardo et al. 1999, Young & Duncan 1994).
Spatial analysis was conducted in a Bayesian frame-work using non-informative large-variance priors. The intercept (a0) was assigned an improper uniform prior distribution (Thomas et al. 2004). The other a’s were assigned normal priors distributions with mean zero and variance 105. For the structured components (b
i), a
Gaussian CAR prior distribution was assumed, with con-tiguity as criterion of proximity between municipalities and a scalar argument tb representing the precision pa-rameter (inverse variance). For hi, normally distributed priors with zero mean and variance 1/th were assumed. For both tb and th, Gamma priors with parameters 0.5 and 0.0005 (mean 103 and variance 2x10⁶) were assumed. In
sensitivity analysis, Gamma priors with parameters 0.1 and 0.1 (mean 1 and variance 100) were used for tb and th.
Spatial analysis used the GeoBUGS v1.4.3 compo-nent of the WinBUGS v1.2 software. The map of munici-palities was converted from shapefile to SPlus format using a program written by Ms Yue Cui, University of Minnesota (Cui 2006).
Models were fitted using Markov Chain Monte Car-lo. In order to speed convergence in the estimation of the parameters and reduce autocorrelation, each inde-pendent variable was centered by subtracting its average (Thomas et al. 2004). Two chains were run with different starting values. Convergence was evaluated by monitor-ing parameters a0, ak, ai, tb and th. After 50,000 ‘burn-in’ iterations, visual inspection of the trace plots showed stabilisation and overlap of the two chains, and on this basis we concluded that convergence had occurred. 50,000 additional iterations were run for estimation of parameters’ posterior distributions.
Spatial analysis consisted of two phases: bivariable, then multivariable analysis using stepwise-forward selec-tion. The model started with the independent variable most associated with the outcome (on basis of size of ai). New variables (biologically important and statistically signifi-cant) were added until no more were statistically significant.
RESULTS
Incidence - A total of 90,413 cases of leishmaniasis (CL, ML, VL and unspecified) were reported in Colombia in the period 2000-2009, of which 85.4% (77,210/90,413) had the municipality recorded and only 2% were unspeci-fied cases. Of these, 78.7% (60,794/77,210) are from the 860 municipalities that fully or partially overlap with the Andean region (above 400 m), with 38.8% (29,949/77,210) from the 715 municipalities in the main analysis on the basis of having more than 90% of their surface area in the region. We use 29,542 cases of CL in the Andean region giving an overall incidence rate of 107.8 cases (29,542/27,416,481) per 100,000 inhabitants for the ten-year period, or 10.8/100,000/ten-year. We performed a tempo-ral analysis of incidence rates per year (Fig. 2).
Bivariable analysis - Six temperature variables were strongly correlated (r > 0.7) with mean annual temperature and six precipitation variables with annual precipitation: these 12 were excluded from spatial analysis (Supplemen-tary data). There was also a strong negative correlation between the mean annual temperature and elevation (r = -0.991), so the latter was also excluded, on the basis of temperature having a more direct effect on the vector.
In addition, páramo coverage was excluded due to its lack of contribution to transmission in Colombia, as was the ‘other’ category for being too heterogeneous, and (i) dry for-est, (ii) shrubland and xeric vegetation, and (iii) technified crops for their rarity (0.03%, 0.6% and 1.7% respectively). Finally, several climatic variables were excluded on the ba-sis of homogeneity over the study area, specifically aver-age annual temperature diurnal range, isothermality (mean diurnal temperature range as a percentage of annual range) and annual temperature range, with coefficients of variation 7.7%, 5.5% and 9.0%, respectively. Ten variables showing low collinearity (all 45 distinct off-diagonal pairwise cor-relations < 0.7) were retained for spatial analysis (Table I).
The first phase of spatial analysis used 10 indepen-dent variables and six were associated with CL incidence.
The incidence showed an inverted U-shaped (quadratic) relationship with average annual temperature, however this significance disappeared in multivariable analysis.
CL incidence was positively associated with rainfor-est cover, with a 2.8% increase (95% CICred: 2.0-3.7%) per additional percent of coverage. It also increased by 2.1% (95% CICred: 0.6-3.6%) for each additional percent coverage with forest and secondary vegetation.
CL incidence was positively associated with an-nual rainfall, increasing 0.16% (95% CICred: 0.12-0.20%) per millimetre. By contrast, livestock agroecosystems and temperature seasonality (i.e. standard deviation of monthly temperature averages) showed a negative asso-ciation with CL incidence, decreasing 3.0% (95% CICred: 1.9-4.1%) per percent coverage with livestock agroeco-systems and 3.0% (95% CICred: 0.1-5.9%) per ºC of sea-sonal variation in temperature.
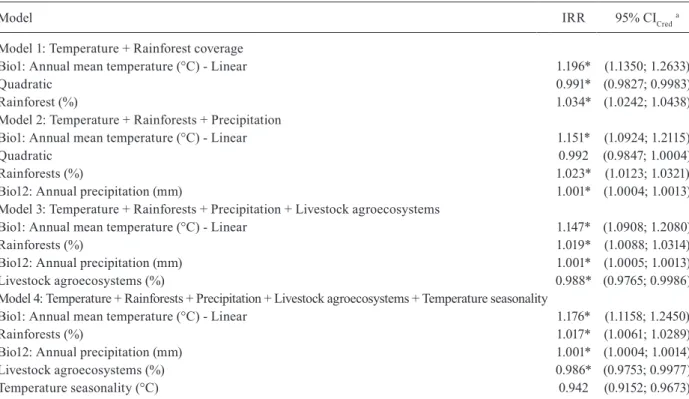
Multivariable analysis - In model 1 rainforest cover-age was added to temperature and both retained statisti-cally significance (Table II). Then annual precipitation and livestock agroecosystems coverage were added in turn (models 2 and 3). After we added temperature sea-sonality and all five variables were statistically signifi-cant (model 4). Finally, when the forest and secondary vegetation coverage was added, it lacked statistical sig-nificance, so model 4 was considered final.
The temporal component of the analysis (Fig. 3) had as reference level the year 2004 (IRR = 1). CL inci-dence increased from 2000-2003, dropped sharply in 2004 before rebounding to another peak in 2005, then dropping back again.
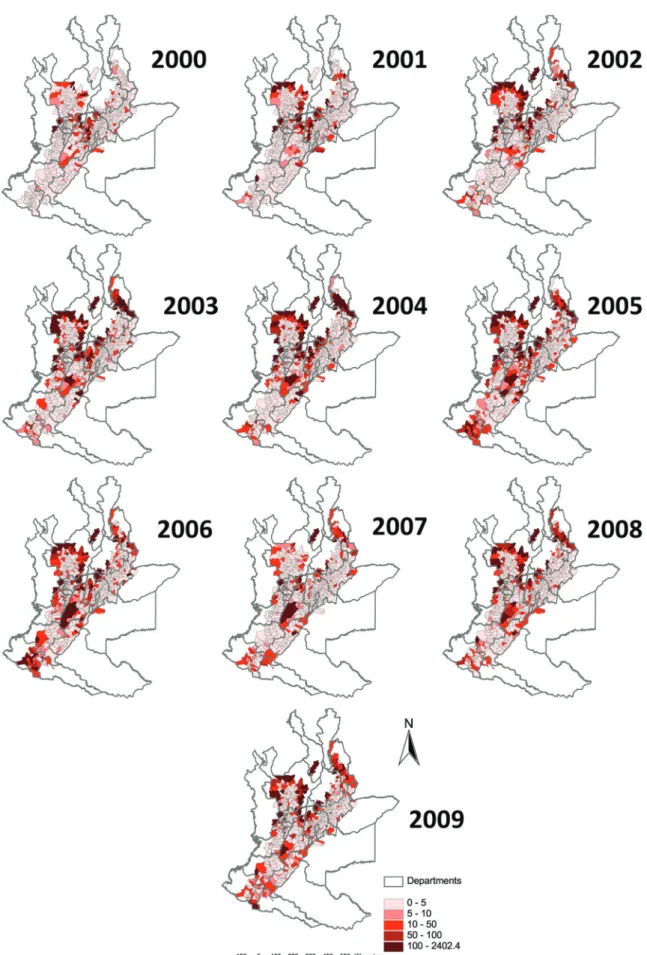
Risk map - Municipality-level risks were mapped from the expected annual incidence rates from model 4 (Fig. 4). It is noted that municipalities at highest risk (ex-pected annual rate > 100 cases per 100,000 inhabitants) belong mainly to departments of Santander and Norte de Santander, Antioquia, Cundinamarca and Tolima.
TABLE I
Bivariable spatial analysis of factors associated with
cutaneous leishmaniasis incidence in the Andean region of Colombia for 2000-2009
Independent variable IRR Change (%) 95% CICreda
Rainforests (%) 1.028* 2.8% (2.0%; 3.7%)
Forest and secondary vegetation (%) 1.021* 2.1% (0.6%; 3.6%)
Coffee agroecosystems in association (%) 1.003 0.3% (-1.8%; 2.5%)
Livestock agroecosystems (%) 0.970* -3.0% (-4.1%; -1.9%)
Non-technified crops (%) 1.002 0.2% (-0.7%; 1.2%)
Bio1: Annual mean temperature (°C)
- Linear 1.155* 15.5% (10.2%; 21.2%)
- Quadratic 0.985* -1.5% (-2.2%; -0.7%)
Bio4: Temperature seasonality (°C) 0.970* -3.0% (-5.9%; -0.1%)
Bio12: Annual precipitation (mm) 1.0016* 0.16% (0.1%; 0.2%)
Bio15: Precipitation seasonality (%) 0.995 -0.5% (-3.9%; 3.2%)
Population density (per inhabitant per km2) 1.001 0.1% (-0.4%; 0.6%)
DISCUSSION
Leishmaniasis incidence in Colombia has increased over time and in spatial extent, suggesting a need for new surveillance tools (Pinzon et al. 2005). The current study used an “ecologic” design (analysis of aggregated data) to identify environmental factors associated with leishmaniasis incidence in the Colombian Andes.
Incidence rate - We restricted the study to the An-dean region because the detailed IAvH ecosystem map-ping was not available for other parts of Colombia. We found an overall incidence rate of 10.8/100,000/year in the Andean region. The deficit relative to the national rate (23.4) can be attributed to this study region contain-ing the largest urban centres. The 715 municipalities ly-TABLE II
Multivariablespatial analysis of factors associated with cutaneous leishmaniasis incidence in the Andean region of Colombia for 2000-2009
Model IRR 95% CICreda
Model 1:Temperature + Rainforest coverage
Bio1: Annual mean temperature (°C) - Linear 1.196* (1.1350; 1.2633)
Quadratic 0.991* (0.9827; 0.9983)
Rainforest (%) 1.034* (1.0242; 1.0438)
Model 2: Temperature + Rainforests + Precipitation
Bio1: Annual mean temperature (°C) - Linear 1.151* (1.0924; 1.2115)
Quadratic 0.992 (0.9847; 1.0004)
Rainforests (%) 1.023* (1.0123; 1.0321)
Bio12: Annual precipitation (mm) 1.001* (1.0004; 1.0013)
Model 3: Temperature + Rainforests + Precipitation + Livestock agroecosystems
Bio1: Annual mean temperature (°C) - Linear 1.147* (1.0908; 1.2080)
Rainforests (%) 1.019* (1.0088; 1.0314)
Bio12: Annual precipitation (mm) 1.001* (1.0005; 1.0013)
Livestock agroecosystems (%) 0.988* (0.9765; 0.9986)
Model 4: Temperature + Rainforests + Precipitation + Livestock agroecosystems + Temperature seasonality
Bio1: Annual mean temperature (°C) - Linear 1.176* (1.1158; 1.2450)
Rainforests (%) 1.017* (1.0061; 1.0289)
Bio12: Annual precipitation (mm) 1.001* (1.0004; 1.0014)
Livestock agroecosystems (%) 0.986* (0.9753; 0.9977)
Temperature seasonality (°C) 0.942 (0.9152; 0.9673)
a: 95% CICred: 95% Bayesian credible interval; *: statistically significant (CI excludes 1); IRR: incidence rate ratio.
ing at least 90% within this region contributed 38.8% of those cases whose location was recorded. The 145 municipalities partly overlapping the Andean region, but with at least of 10% of their area outside - so not included in the current study - contributed 30,845 cases, compared to 29,949 from 715 municipalities in the main analysis. Correspondingly, a high incidence is visible in Fig. 4 round the edges of the study region. Hence a sur-prisingly high proportion of cases originated from the fringes of the Andean region.
Most studies exploring environmental risk factors for CL have reported numbers of cases with no popu-lation denominator. The few calcupopu-lations of incidence in such studies include 28.5 per 100,000 per year in the state of Bahia, Brazil (Franke et al. 2002) and 670 in Si-di-Bouzid, Tunisia (Salah et al. 2007), both much higher than that described in the current paper.
Environmental factors associated with incidence of CL - Multivariable spatial analysis found five variables associated with CL incidence. A positive association with rainforest cover was found, as by Valderrama-Ardila et al. (2010) in their smaller scale study in Chaparral (To-lima), although here it is more precisely estimated. We found a negative association between incidence and live-stock agroecosystems. This does not seem to have been described previously although can be explained by trans-formation of natural landscape from forest into grass-lands (Zeilhofer et al. 2008, Gil et al. 2010). Replacement of forests by anthropogenic vegetation like crops and pastures has led to destruction of the natural habitat of vectors and reservoirs, decreasing the risk of infection (WHO 2007, Zeilhofer et al. 2008, Gil et al. 2010).
We found a positive relationship between CL inci-dence and temperature. This is consistent with other
ies in which temperature was associated with distribution of vectors (Thomson et al. 1999, Gebre-Michael et al. 2004, González et al. 2010) or human CL cases (Elnaiem et al. 2003, Chaves & Pascual 2006, Bhunia et al. 2010).
In this study annual rainfall was also positively as-sociated with CL incidence which is consistent with most previous studies (Thomson et al. 1999, Elnaiem et al. 2003, Ready 2008, Bhunia et al. 2010). In some places, higher rainfall tends to increase vegetation density (Mi-chalsky et al. 2009) and hence vector abundance (Ostfeld et al. 2005), at least at a coarse level (Githeko et al. 2000). Higher annual rainfall may be associated with habitats, such as forest coverage, which favor transmission (Kapos et al. 1997, Turton & Freiburger 1997). The negative as-sociation between temperature seasonality and incidence may be driven by the high seasonality in the southern fringe of the eastern cordillera, where it descends to-wards the eastern plains, conditions unfavorable to many phlebotomine species (Supplementary figure).
To our knowledge, this is the first spatial and tem-poral analysis of environmental risk factors for the Co-lombian Andean region. The map of King et al. (2004) used data from a single year (1994), with dichotomous response variable (presence or absence of at least one case reported in a municipality), and classical (non-spa-tial) logistic regression. A comparative visual analysis of the Andean region in these two risk maps does not seem to show a good agreement.
On the other hand, this does highlight a limitation of our study, namely that it modeled spatial-temporal varia-tion in CL rate but not in climate and land use. For exam-ple, it cannot predict changes in incidence associated with inter-annual changes due to the El Niño climate phenom-enon, as have been identified in northeastern Colombia (Cárdenas et al. 2006) or other causes. The temperature and rainfall data are from the WorldClim database which was constructed from data mainly from 1950-2000 and then interpolated to pixels of 1 km2. For the Andean
re-gion, uncertainty in these WorldClim estimates ranged from 0.2 to > 0.4ºC for temperature, and > 10 mm for pre-cipitation (Hijmans et al. 2005). At a finer time scale, in the Andean zone of Colombia, periods of lower rainfall were inversely associated with abundance peaks of Lut-zomyia longiflocosa and L. columbiana vectors from the verrrucarum group that are the dominant species in the Andean region (Cárdenas et al. 2006, Ferro et al. 2011).
“Ecologic” studies are more susceptible to bias than those based on individuals (Borja-Aburto 2000) and they often - as here - use secondary data with possible measure-ment errors. Their aggregate-level analysis also precludes control of confounding at finer levels (Borja-Aburto 2000, Rochlin et al. 2011). This study used several data sources. Epidemiological data supplied by the public health sur-veillance in Colombia can have several limitations. For example, missing municipality information allowed use of only 85% of the records. Under-reporting is recognised nationally (King et al. 2004) and internationally (Miranda et al. 2005, Ready 2008, INS 2010). Changes in notifica-tion protocol over a period of nine years, a misclassifica-tion of origin municipality and migramisclassifica-tion of populamisclassifica-tions, among others, may cause over - or under - estimation of
the true incidence rate. Municipal-level data aggregation is quite coarse, but this is the finest level at which Colom-bian surveillance data are compiled. For each municipal-ity we represented temperature, rainfall and elevation by a single value (average) ignoring intra-municipal variation in climate and topography, which may be important for CL (Valderrama-Ardila et al. 2010).
On the other hand, in terms of strengths, we were able to include land use at a fine spatial resolution (1:250,000) and incidence data from a long period (10 years). Integra-tion of GIS data from remote sensing with spatial modeling and epidemiological data allowed identification of environ-mental risk factors and construction of the first municipali-ty-level risk map for CL in the Colombian Andes.
In conclusion, in this spatially and temporally exten-sive study of climate and land use as potential risk factors, we found that the incidence of CL in the Andean region of Colombia is positively associated with mean temperature, rainforest coverage and precipitation, and negatively as-sociated with livestock agroecosystems and temperature seasonality. The integration of epidemiological data, re-mote sensing images, GIS and statistical modeling can be used to identify areas at high risk of CL. This approach is potentially applicable elsewhere in Latin America to sup-port vector borne disease surveillance systems.
ACKNOWLEDGEMENTS
To the Ministry of Health and Social Protection (MSPS), for providing leishmaniasis epidemiological data for the pe-riod 2000-2009 that made this study possible; Drs Luisa Con-suelo Rubiano and Nancy Saravia, for facilitating this inter-change; and Rana Moyeed, for advice on the spatial analysis. This study was conducted in partial fulfillment of the Masters of Science degree in Epidemiology from the School of Public Health of the Universidad del Valle.
REFERENCES
Alvar J, Vélez ID, Bern C, Herrero M, Desjeux P, Cano J, et al. Leish-maniasis worldwide and global estimates of its incidence. PLoS ONE. 2012; 7: e35671.
Bavia ME, Carneiro DD, Gurgel HC, Madureira Filho C, Barbosa MG. Remote sensing and geographic information systems and risk of American visceral leishmaniasis in Bahia, Brazil. Paras-sitologia. 2005; 47(1): 165-9.
Bejarano EE, Rojas W, Uribe S, Velez ID. Systematics of the Lutzo-myia species of the Verrucarum Theodor group, 1965 (Diptera: Psychodiadae). Biomedica. 2003; 23: 87-102.
Bhunia GS, Kumar V, Kumar AJ, Das P, Kesari S. The use of remote sensing in the identification of the eco-environmental factors as-sociated with the risk of human visceral leishmaniasis (kala-azar) on the Gangetic plain, in north-eastern India. Ann Trop Med Pa-rasitol. 2010; 104(1): 35-53.
Borja-Aburto VH. Estudios ecológicos. Salud Publica Mex. 2000; 42(6): 533-8.
Cárdenas R, Pabón E, Anaya H, Sandoval C. Presencia de Lutzomyia longiflocosa (Diptera: Psychodidae) en el foco de leishmaniasis tegumentaria americana del municipio de Ábrego, Norte de San-tander. Primer registro para el departamento. Rev Inst Facultad Salud Universidad de Pamplona. 2005; 3: 7-14.
Cárdenas R, Sandoval CM, Rodríguez-Morales AJ, Vivas P. Zoonoses and climate variability. Ann N Y Acad Sci. 2008; 1149: 326-30.
Cui Y. How to get adjacency matrix from WINBUGS with AR-CVIEW(.shp) files [Internet]. Division of Biostatistics. Minneap-olis: University of Minnesota; 2006 [updated 2015 May 06; cited 2012 Jan 15]. Available from: http://www.biostat.umn.edu/~brad/ yuecui/index.html.
Chaves LF, Pascual M. Climate cycles and forecasts of cutaneous leishmaniasis, a nonstationary vector-borne disease. PLoS Med. 2006; 3(8): e295.
DANE - Departamento Nacional de Estadísticas [Internet]. Colom-bia. Proyecciones de población [updated 2016 May 29; cited 2015 Mar 8]. 2005. Available from: http://www.dane.gov.co.
Elnaiem DE, Schorscher J, Bendall A, Obsomer V, Osman ME, Mek-kawi A, et al. Risk mapping of visceral leishmaniasis: the role of lo-cal variation in rainfall and altitude on the presence and incidence of kala-azar in eastern Sudan. Am J Trop Med Hyg. 2003; 68: 10-7.
Etter A, van Wyngaarden W. Patterns of landscape transformation in Colombia, with emphasis in the Andean region. AMBIO. 2000; 29(7): 432-9.
Ferro C, Marín D, Góngora R, Carrasquilla MC, Trujillo JE, Rueda NK, et al. Phlebotomine vector ecology in the domestic transmis-sion of American cutaneous leishmaniasis in Chaparral Colom-bia. Am J Trop Med Hyg. 2011; 85(5): 847-56.
Flórez M, Martínez JP, Gutiérrez R, Luna KP, Serrano VH, Ferro C, et al. Lutzomyia longipalpis (Diptera: Psychodidae) at a subur-ban focus of visceral leishmaniasis in the Chicamocha Canyon, Santander, Colombia. Biomedica 2006; 26(Suppl. 1): 109-20.
Franke CR, Staubach C, Ziller M, Schlüter H. Trends in the temporal and spatial distribution of visceral and cutaneous leishmaniasis in the state of Bahia, Brazil, from 1985 to 1999. Trans R Soc Trop Med Hyg. 2002; 96: 236-241.
Gebre-Michael T, Malone JB, Balkew M, Ali A, Berhe N, et al. Mapping the potential distribution of Phlebotomus martini and P. orientalis
(Diptera: Psychodidae), vectors of kala-azar in East Africa by use of geographic information systems. Acta Trop. 2004; 90: 73-86.
Gelfand AE, Vounatsou P. Proper multivariate conditional autoregressive models for spatial data analysis. Biostatistics. 2003; 4(1): 11-25.
Gil JF, Nasser JR, Cajal SP, Juarez M, Acosta N, Cimino RO, et al. Urban transmission of American cutaneous leishmaniasis in Argentina: spatial analysis study. Am J Trop Med Hyg. 2010; 82(3): 433-40.
Githeko AK, Lindsay SW, Confalonieri UE, Patz JA. Climate change and vector-borne diseases: a regional analysis. Bull World Health Organ [Internet]. 2000; 78(9): 1136-47.
González C, Wang O, Strutz SE, González-Salazar C, Sánchez-Cor-dero V, Sarkar S. Climate change and risk of leishmaniasis in North America: predictions from ecological niche models of vec-tor and reservoir species. PLoS Negl Trop Dis. 2010; 4(1): e585.
Heinen A, Rengifo E. Multivariate modelling of time series count data: an autoregressive conditional poisson model. Center for Op-erations Research and Econometrics. Louvain-la-Neuve: Catho-lic University of Louvain; 2003.
Hijmans RJ, Cameron SE, Parra JL, Jones PG, Jarvis A. Very high resolution interpolated climate surfaces for global land areas. Int J Climatol. 2005; 25: 1965-78.
IAvH - Instituto de Investigaciones de Recursos Biológicos Alexan-der von Humboldt. Mapa de ecosistemas de los Andes colom-bianos del año 2005 [map], Escala: 1:250.000. Bogotá DC; 2005.
INS - Instituto Nacional de Salud [Internet]. Colombia. Protocolo de vigilancia en salud pública de leishmaniasis. PRO-R02.016
[updated 2016 May 29, cited 2015 Feb 5]. 2010. Available from: http://www.ins.gov.co/.
Kapos V, Wandelli E, Camargo JL, Ganade G. Edge-related changes in en-vironment and plant responses due to forest fragmentation in central Amazonia. In: Laurance WF, Bierregaard Jr RO, editors. Tropical for-est remnants: ecology, management and conservation of fragmented communities. Chicago: University of Chicago Press; 1997. p. 33-44.
King RJ, Campbell-Lendrum DH, Davies CR. Predicting geographic variation in cutaneous leishmaniasis, Colombia. Emerg Infect Dis. 2004; 10: 598-607.
Michalsky EM, França-Silva JC, Barata RA, Lara e Silva FO, Lou-reiro AMF, Fortes-Dias CL, et al. Phlebotominae distribution in Janaúba, an area of transmission for visceral leishmaniasis in Brazil. Mem Inst Oswaldo Cruz. 2009; 104(1): 56-61.
Miranda MC, Posso CX, Rojas CA. Manual de normas y procedi-mientos para la atención de la leishmaniasis en los municipios de Valle del Cauca. Cali: Secretaria Departamental de Salud, Go-bernación del Valle del Cauca y Centro Internacional de Entrena-miento e Investigaciones Médicas; 2005.
OMS - Organización Mundial de la Salud. Control de las leishmania-sis. Informe de una reunión del Comité de Expertos de la OMS sobre el Control de las Leishmaniasis. Serie de informes técnicos nº 949. Ginebra: OMS; 2010. 200 pp.
Ostfeld RS, Glass GE, Keesing F. Spatial epidemiology: an emerging (or re-emerging) discipline. Trends Ecol Evol. 2005; 20(6): 328-36.
Pardo R, Ferro C, Lozano G, Lozano C, Cabrera O, Davies C. Flebóto-mos (Diptera: Psychodidae) vectores de leishmaniasis cutánea y sus determinantes ecológicos en la zona cafetera del departamento del Huila. In: Memorias XXVI Congreso de la Sociedad Colombiana de Entomología. Bogotá: Editorial Guadalupe Ltda; 1999. p. 147-163.
Pardo RH, Cabrera OL, Becerra J, Fuya P, Ferro C. Lutzomyia longi-flocosa as suspected vector of cutaneous leishmaniasis in a focus of cutaneous leishmaniasis on the sub-andean region of Tolima department, Colombia, and the knowledge on sandflies by the inhabitants. Biomedica. 2006; 26(Suppl. 1): 95-108.
Pinzon E, Wilson JM, Tucker CJ. Climate-based health monitoring systems for eco-climatic conditions associated with infectious diseases. Bull Soc Pathol Exot. 2005; 98(3): 239-43.
Ready PD. Leishmaniasis emergence and climate change. Rev Sci Tech. 2008; 27(2): 399-412.
Ready PD. Leishmaniasis emergence in Europe. Euro Surveill. 2010; 15(10): 19505.
Rochlin I, Turbow D, Gomez F, Ninivaggi DV, Campbell SR. Predictive mapping of human risk for West Nile virus (WNV) based on environ-mental and socioeconomic factors. PLoS ONE. 2011; 6(8): e23280.
Rodríguez N, Armenteras D, Morales M, Romero M. Ecosistemas de los Andes colombianos. 2nd ed. Bogotá: Instituto de Investigación de Recursos Biológicos Alexander von Humboldt; 2006. 154 p.
Rodríguez-Barraquer I, Gongora R, Prager M, Pacheco R, Montero LM, Navas A, et al. Etiologic agent of an epidemic of cutaneous leishmaniasis in Tolima, Colombia. Am J Trop Med Hyg. 2008; 78(2): 276-82.
Salah AB, Kamarianakis Y, Chlif S, Alaya NB, Prastacos P. Zoonotic cutaneous leishmaniasis in central Tunisia: spatio temporal dy-namics. Int J Epidemiol. 2007; 36(5): 991-1000.
Santamaria E, Ponce N, Zipa Y, Ferro C. Presence of infected vectors of Leishmania (V.) panamensis within dwellings in two endemic foci in the foothill of the middle Magdalena valley, western Boy-aca, Colombia. Biomedica. 2006; 26(Suppl. 1): 82-94.
Thomas A, Best N, Lunn D, Arnold R, Spiegelhal D. GeoBUGS user manual version 1.2 [Internet]. MRC Biostatistics Unit [cited 2012 Feb 9]. 2004. Available from: http://www.mrc-bsu.cam.ac.uk/ software/bugs/.
Thomson MC, Elnaiem DA, Ashford RW, Connor SJ. Towards a kala-azar risk map for Sudan: mapping the potential distribution of
Phlebotomus orientalis using digital data of environmental vari-ables. Trop Med Int Health. 1999; 4(2): 105-13.
Turton SM, Freiburger HJ. Edge and aspect effects on the microcli-mate of a small tropical forest remnant on the Atherton Table-land, northeastern Australia. In: Laurance WF, Bierregaard RO, editors. Tropical forest remnants: ecology, management, and conservation of fragmented communities. Chicago: University of Chicago Press; 1997. p. 45-54.
Valderrama-Ardila C, Alexander N, Ferro C, Cadena H, Marin D, Hol-ford TR, et al. Environmental risk factors for the incidence of Amer-ican cutaneous leishmaniasis in a sub-Andean zone of Colombia (Chaparral, Tolima). Am J Trop Med Hyg. 2010; 82(2): 243-50.
Weber CJ. Update on global climate change. Urol Nurs. 2010; 30(1): 81-4.
WHO - World Health Organization. Cutaneous leishmaniasis: why are you neglecting me? Geneva: WHO; 2007.
Young DG, Duncan MA. Guide to the identification and geographic distribution of Lutzomyia sandflies in Mexico, the West Indies, Central and South America (Diptera: Psychodidae). Mem Amer Ent Inst. 1994; 54: 881 pp.
Supplementary data
SUPPLEMENTARY DATA
Bioclimatic variables as on the Bioclim website (http://www.worldclim.org/bioclim) BIO1 = Annual Mean Temperature
BIO2 = Mean Diurnal Range [Mean of monthly (max temp - min temp)] BIO3 = Isothermality (BIO2/BIO7) (*100)
BIO4 = Temperature Seasonality (standard deviation *100) BIO5 = Max Temperature of Warmest Month
BIO6 = Min Temperature of Coldest Month BIO7 = Temperature Annual Range (BIO5-BIO6) BIO8 = Mean Temperature of Wettest Quarter BIO9 = Mean Temperature of Driest Quarter BIO10 = Mean Temperature of Warmest Quarter BIO11 = Mean Temperature of Coldest Quarter BIO12 = Annual Precipitation
BIO13 = Precipitation of Wettest Month BIO14 = Precipitation of Driest Month
BIO15 = Precipitation Seasonality (Coefficient of Variation) BIO16 = Precipitation of Wettest Quarter
BIO17 = Precipitation of Driest Quarter BIO18 = Precipitation of Warmest Quarter BIO19 = Precipitation of Coldest Quarter
Equation of the model (spatio-temporal statistical model) - Assuming that the occurrence of cases of cutaneous leishmaniasis (Yit) in a municipality of Ni inhabitants follows a Poisson mixture distribution with mean μit (μit = Yit / Ni), the random-effects Poisson model used is:
Yit ~ Poisson (µit) i=1,…,715, t=1,…,9
log µit = log Ni + a0 + at + aijxij + bi + hi j=1,…,31 t=1,…,9
Where:
Yit is the number of cases of cutaneous leishmaniasis in the municipality i and year t µi is the incidence rate of cutaneous leishmaniasis in the municipality i and year t Ni is the number of inhabitants in the municipality i
a0 is the intercept
at is the parameter capturing the time (year) from 2000 to 2009, with 2004 as the reference level
xi are the 31 independent variables (land use, temperature, rainfall, elevation and population density) with regression coefficient aij
2
Sp
at
ial m
od
eling o
f C
L i
n C
olo
m
bia • M
au
ricio P
ére
z-F
ló
re
z e
t a
l.
Supplementary data
The matrix of spearman correlations (r) of climate variables
Variables r BIO1 BIO2 BIO3 BIO4 BIO5 BIO6 BIO7 BIO8 BIO9 BIO10 BIO11 BIO12 BIO13 BIO14 BIO15 BIO16 BIO17 BIO18 BIO19 Elev
BIO1 r 1,000 ,502** ,402** -,041 ,992** ,992** ,129** ,999** ,999** ,999** ,999** ,400** ,420** ,348** -,045 ,380** ,368** ,145** ,451** -,991**
r-value ,000 ,000 ,277 0,000 0,000 ,001 0,000 0,000 0,000 0,000 ,000 ,000 ,000 ,225 ,000 ,000 ,000 ,000 0,000 BIO2 r ,502** 1,000 ,046 ,011 ,587** ,419** ,773** ,511** ,503** ,505** ,504** ,068 ,103** ,014 ,115** ,064 ,015 -,149** ,056 -,478**
r-value ,000 ,217 ,770 ,000 ,000 ,000 ,000 ,000 ,000 ,000 ,068 ,006 ,703 ,002 ,089 ,688 ,000 ,137 ,000 BIO3 r ,402** ,046 1,000 -,634** ,339** ,469** -,559** ,399** ,402** ,382** ,415** ,384** ,258** ,711** -,679** ,263** ,657** ,405** ,330** -,403**
r-value ,000 ,217 ,000 ,000 ,000 ,000 ,000 ,000 ,000 ,000 ,000 ,000 ,000 ,000 ,000 ,000 ,000 ,000 ,000 BIO4 r -,041 ,011 -,634** 1,000 -,001 -,080* ,388** -,039 -,040 -,014 -,069 -,144** -,042 -,463** ,541** -,047 -,402** -,258** -,099** ,066
r-value ,277 ,770 ,000 ,988 ,033 ,000 ,294 ,289 ,710 ,064 ,000 ,267 ,000 ,000 ,206 ,000 ,000 ,008 ,080 BIO5 r ,992** ,587** ,339** -,001 1,000 ,972** ,237** ,991** ,992** ,993** ,991** ,386** ,417** ,302** ,004 ,375** ,327** ,105** ,442** -,980**
r-value 0,000 ,000 ,000 ,988 0,000 ,000 0,000 0,000 0,000 0,000 ,000 ,000 ,000 ,917 ,000 ,000 ,005 ,000 0,000 BIO6 r ,992** ,419** ,469** -,080* ,972** 1,000 ,020 ,989** ,992** ,990** ,992** ,416** ,425** ,390** -,097** ,389** ,408** ,167** ,474** -,984**
r-value 0,000 ,000 ,000 ,033 0,000 ,597 0,000 0,000 0,000 0,000 ,000 ,000 ,000 ,009 ,000 ,000 ,000 ,000 0,000 BIO7 r ,129** ,773** -,559** ,388** ,237** ,020 1,000 ,138** ,130** ,142** ,122** -,204** -,101** -,440** ,501** -,133** -,409** -,384** -,174** -,107**
r-value ,001 ,000 ,000 ,000 ,000 ,597 ,000 ,000 ,000 ,001 ,000 ,007 ,000 ,000 ,000 ,000 ,000 ,000 ,004 BIO8 r ,999** ,511** ,399** -,039 ,991** ,989** ,138** 1,000 ,997** ,998** ,998** ,391** ,411** ,349** -,047 ,369** ,367** ,146** ,431** -,990**
r-value 0,000 ,000 ,000 ,294 0,000 0,000 ,000 0,000 0,000 0,000 ,000 ,000 ,000 ,214 ,000 ,000 ,000 ,000 0,000 BIO9 r ,999** ,503** ,402** -,040 ,992** ,992** ,130** ,997** 1,000 ,999** ,998** ,405** ,426** ,347** -,045 ,387** ,369** ,137** ,466** -,989**
r-value 0,000 ,000 ,000 ,289 0,000 0,000 ,000 0,000 0,000 0,000 ,000 ,000 ,000 ,228 ,000 ,000 ,000 ,000 0,000 BIO10 r ,999** ,505** ,382** -,014 ,993** ,990** ,142** ,998** ,999** 1,000 ,998** ,398** ,422** ,331** -,026 ,382** ,354** ,138** ,451** -,989**
r-value 0,000 ,000 ,000 ,710 0,000 0,000 ,000 0,000 0,000 0,000 ,000 ,000 ,000 ,481 ,000 ,000 ,000 ,000 0,000 BIO11 r ,999** ,504** ,415** -,069 ,991** ,992** ,122** ,998** ,998** ,998** 1,000 ,401** ,418** ,359** -,060 ,379** ,378** ,149** ,451** -,990**
r-value 0,000 ,000 ,000 ,064 0,000 0,000 ,001 0,000 0,000 0,000 ,000 ,000 ,000 ,110 ,000 ,000 ,000 ,000 0,000 BIO12 r ,400** ,068 ,384** -,144** ,386** ,416** -,204** ,391** ,405** ,398** ,401** 1,000 ,963** ,741** -,282** ,972** ,819** ,830** ,903** -,392**
r-value ,000 ,068 ,000 ,000 ,000 ,000 ,000 ,000 ,000 ,000 ,000 0,000 ,000 ,000 0,000 ,000 ,000 ,000 ,000 BIO13 r ,420** ,103** ,258** -,042 ,417** ,425** -,101** ,411** ,426** ,422** ,418** ,963** 1,000 ,604** -,066 ,990** ,697** ,757** ,897** -,413**
r-value ,000 ,006 ,000 ,267 ,000 ,000 ,007 ,000 ,000 ,000 ,000 0,000 ,000 ,077 0,000 ,000 ,000 ,000 ,000 BIO14 r ,348** ,014 ,711** -,463** ,302** ,390** -,440** ,349** ,347** ,331** ,359** ,741** ,604** 1,000 -,758** ,608** ,982** ,768** ,598** -,358**
r-value ,000 ,703 ,000 ,000 ,000 ,000 ,000 ,000 ,000 ,000 ,000 ,000 ,000 ,000 ,000 0,000 ,000 ,000 ,000 BIO15 r -,045 ,115** -,679** ,541** ,004 -,097** ,501** -,047 -,045 -,026 -,060 -,282** -,066 -,758** 1,000 -,099** -,690** -,423** -,197** ,049
r-value ,225 ,002 ,000 ,000 ,917 ,009 ,000 ,214 ,228 ,481 ,110 ,000 ,077 ,000 ,008 ,000 ,000 ,000 ,189 BIO16 r ,380** ,064 ,263** -,047 ,375** ,389** -,133** ,369** ,387** ,382** ,379** ,972** ,990** ,608** -,099** 1,000 ,696** ,758** ,914** -,373**
r-value ,000 ,089 ,000 ,206 ,000 ,000 ,000 ,000 ,000 ,000 ,000 0,000 0,000 ,000 ,008 ,000 ,000 ,000 ,000 BIO17 r ,368** ,015 ,657** -,402** ,327** ,408** -,409** ,367** ,369** ,354** ,378** ,819** ,697** ,982** -,690** ,696** 1,000 ,813** ,684** -,375**
r-value ,000 ,688 ,000 ,000 ,000 ,000 ,000 ,000 ,000 ,000 ,000 ,000 ,000 0,000 ,000 ,000 ,000 ,000 ,000 BIO18 r ,145** -,149** ,405** -,258** ,105** ,167** -,384** ,146** ,137** ,138** ,149** ,830** ,757** ,768** -,423** ,758** ,813** 1,000 ,624** -,145**
r-value ,000 ,000 ,000 ,000 ,005 ,000 ,000 ,000 ,000 ,000 ,000 ,000 ,000 ,000 ,000 ,000 ,000 ,000 ,000 BIO19 r ,451** ,056 ,330** -,099** ,442** ,474** -,174** ,431** ,466** ,451** ,451** ,903** ,897** ,598** -,197** ,914** ,684** ,624** 1,000 -,439**
r-value ,000 ,137 ,000 ,008 ,000 ,000 ,000 ,000 ,000 ,000 ,000 ,000 ,000 ,000 ,000 ,000 ,000 ,000 ,000 Elev r -,991** -,478** -,403** ,066 -,980** -,984** -,107** -,990** -,989** -,989** -,990** -,392** -,413** -,358** ,049 -,373** -,375** -,145** -,439** 1,000
r-value 0,000 ,000 ,000 ,080 0,000 0,000 ,004 0,000 0,000 0,000 0,000 ,000 ,000 ,000 ,189 ,000 ,000 ,000 ,000
Supplementary data BIO1: Annual Mean Temperature
BIO2: Mean Diurnal Range [Mean of monthly (max temp - min temp)] BIO3: Isothermality (BIO2/BIO7) (* 100)
BIO4: Temperature Seasonality (standard deviation *100) BIO5: Max Temperature of Warmest Month
BIO6: Min Temperature of Coldest Month BIO7: Temperature Annual Range (BIO5-BIO6) BIO8: Mean Temperature of Wettest Quarter BIO9: Mean Temperature of Driest Quarter BIO10: Mean Temperature of Warmest Quarter BIO11: Mean Temperature of Coldest Quarter BIO12: Annual Precipitation
BIO13: Precipitation of Wettest Month BIO14: Precipitation of Driest Month
BIO15: Precipitation Seasonality (Coefficient of Variation) BIO16: Precipitation of Wettest Quarter
BIO17: Precipitation of Driest Quarter BIO18: Precipitation of Warmest Quarter BIO19: Precipitation of Coldest Quarter Elev: Elevation