S
PATIAL
DISTRIBUTION OF PROPORTIONAL
INFANT MORTALITY AND CERTAIN
SOCIOECONOMIC VARIABLES IN
SALVADOR, BAHIA, BRAZIL’
Jairnilson S&a Pabq2 Maria da Concei@o N. Costa,2 ViZma Cabrah3 Irani Andrade Mota,4 and
Rozana Bezewa Batista Neves5
I
NTRODUCTION
Reduction of infant mortality in developed countries (1) and, more re- cently, in Latin America (2) has stimu- lated research aimed at determining the reason for the decline and identifying the groups remaining at greatest risk with a view to adopting fairer social pol- icies (3, 4). In the case of Brazil, infant mortality has remained high but has shown a downward trend since the end of the 1970s I>,), However, studies of state capitals with reduced levels of in-
fant mortality-such as Sao Paulo (G)
and P&-to Alegre (Q-have revealed the persistence of an extremely uneven dis- tribution of deaths among infants (chil- dren under one year old) in these cities’ different districts or neighborhoods.
In Salvador, capital of Bahia
State and Brazil’s fourth-largest city
’ This article has also been published in Portuguese in the Bole& de /a Oficina Sanitaria Pananzericana, vol.
103, no. 1, 1987.
2 Associate Professor, Department of Preventive Medi- cine, Federal University of Bahia; Researcher, Na- tional Research Council, Brazil.
3 Nurse, Coordinator of the Maternal and Child Health
Program, Bahia State Health Secretariat (SESABI ISEB), Brazil.
with a population of 1,501,981 (1980
census), infant mortality studies have undergone little methodologic change over time (8, 9). As a result, the indica- tors used do not reveal the social or spa-
tial distribution of mortality, nor do
they show inequalities in the distribu- tion of goods and services among the various segments of the population. Moreover, even if the infant mortality data showed the indicators most closely associated with death in the first year of life in each zone of Salvador, accurate analysis would be hindered because area-by-area data on the number of live births is lacking.
It was therefore decided to conduct a study using the ratio of infant deaths to total deaths in Salvador as an indicator for analyzing the spatial distri- bution of infant mortality. The aim of this study was to describe the distribu-
tion of infant deaths in each zone of the .$
u B
4 Assistant Professor, School of Nutrition, Federal Uni- 2 versity of Bahia, Brazil.
5 Medical Resident, Federal University of Bahia re- search fellowship recipient. 3
city of Salvador in 1980 and to examine possible correlations between infant mortality and selected socioeconomic, sanitary, and health care variables. For
this purpose it was initially assumed
that proportional infant mortality (the ratio of infant deaths to total deaths) was higher in areas with a high percent- age of low-income residents, a high prevalence of inadequate housing, poor
water supplies, and scarce health
services.
M
ETHODOLOGY
Data on total and infant deaths among Salvador residents in
1980 were obtained by reviewing the death certificates filed at the Bahia State Health Secretariat’s Health Information
Center (CIS) (see the death certificate
form shown in Annex 1). In the case of noninfant deaths, only certificate items 8 (date of birth), 9 (age), 13 (usual place of residence), and 14 (municipality) were noted. In the case of infant deaths, certificate items 3 (fetal death), 30 (time of death in relation to delivery), and 35 (causes of death) were also noted. In the case of incorrectly completed death cer- tificates, the criteria adopted by the CIS
were employed and fetal death was as- sumed in the case of:
k
2
. cause of death information indicated that (a) death certificates where the3 the infant was “emaciated,” even if the
r; word “no” was checked under item 3, “fe- $ tal death”;
a a word “yes” was checked in item 3 under (b) death certificates where the 2 death could also apply to a live-born infant; “fetal death, ” even if the basic cause of
226
(c) death certificates where item 3 was not filled in or where both “yes” and “no” were checked, but where expressions such as “fetus of . . .” or “stillborn infant of . . .” were used in the item calling for the name of the infant, even if the basic cause of death could also apply to a live- born infant.
In addition, those death cer- tificates that presented the greatest dif- ficulty with regard to determination of fetal death were sent to the World
Health Organization Center for the
Classification of Diseases in Portuguese at Sao Paulo. Although these incorrectly completed certificates posed difficulties for the center as well, the suggestions made by the center were consistent with the criteria adopted for the present study. In the end, two certificates were considered unclassifiable and were ex- cluded from the study, along with those taken as indicating fetal deaths.
During the data collection
process, 912 death certificates from
1980 were found that had not been tab-
ulated by the CIS. These included 261
certificates issued for deaths of infants and 651 issued for deaths occurring at other ages. Nearly all (907) of these cer- tificates corresponded to deaths that oc- curred in January 1980 and were re- corded primarily at various registries (Nina Rodriguez, Vitoria, Santo Anto- nio, Brotas, and NazarC) of the Medico- Legal Institute. (The other five deaths were recorded at other registries.) Ac-
cording to information from the CIS,
these certificates were received by the health secretariat after the date estab- lished for final verification had passed, and accordingly were not included in the official publications. These 912 cer-
(3,3 12) was smaller than the officially
published number (3,608) (10). Also,
the situation in regard to deaths at other ages was the reverse; that is, 8,575 cer- tificates were found in the CIS files,
while the number published in the offi- cial statistical records was 8,099 (10). G In
all, 11,887 death certificates issued for 1980 fatalities among residents of the municipality of Salvador were included in the study; of these, 3,3 12 were taken to report the death of infants.
In order to assess the geo- graphic distribution of these deaths, a series of maps prepared by the Salvador Metropolitan Region Development En-
terprise (CONDER) was employed. These
divided the municipality into 76 report- ing zones on the basis of physical infra- structure, administrative and planning criteria, and compatibility with the cen- sus sectors adopted by the Brazilian In-
stitutional Foundation of Geography
and Statistics (see Figure 1).
In cases where the death cer- tificate provided less than complete in- formation on the decedent’s place of residence (for instance, where the dece- dent’s neighborhood was not clearly
specified), various publications were
consulted-including a list of streets,
avenues, and ways arranged by neigh- borhood that was supplied by the Ba-
hia Sanitation Enterprise (EMBASA); a
table of standard land and contracting units; and (primarily) an atlas, maps, and index cards produced by the Metric Numbering Commission of the Salva- dor Municipal Government using the
subdistricts and reporting zones
adopted by CONDER. Whenever a de-
cendent’s neighborhood of residence
could not be identified because there
were streets with identical names in dif- ferent neighborhoods, or because the street named on a certificate passed
through several neighborhoods, the
neighborhood to which the death was assigned was chosen by lot from among the various possible neighborhoods. In this way, 2.5 % of the infant deaths and 3.0% of the noninfant deaths were as- signed to specific reporting zones. The
zones where over 10% of the deaths
were assigned in this manner were zones
3, 6, 13, 19, 21, 35, 37, 46, 56, 64,
and 74.
After this was done, 366 deaths remained unallocated because
there was insufficient information to
justify the procedure of allocation by lot. (In 199 cases no address was entered on the death certificate.) One hundred and sixty-six of these recorded deaths were infant fatalities, and in most (118)
of these cases no address had been
entered. q
Because these 366 deaths re- 2
mained unallocated, the study’s neigh- 3
borhood distribution data included a
total of 11,521 fatalities (3,146 infant 8
deaths and 8,375 noninfant deaths). 2
The following definitions 2
were applied to data from the individ-
ual reporting zones: ii
k
l proportional infant mortality:
the number of infant deaths as a percentage 2 ki
of total deaths;
l proportion of low-income
families: the percentage of families with in- $
comes not exceeding five times the mini- 5
mum wage;
l proportion of ’ ‘type C” hous- 2
ing: the percentage of substandard hous- .
ing-as indicated by haphazard or disor- --i b
derly surroundings, diffkult access, open 3
sewers, or less than 50 m* of covered area per c dwelling; .U 2
6 These differences arose from several problems related to transmittal of death certificates to the CIS and their
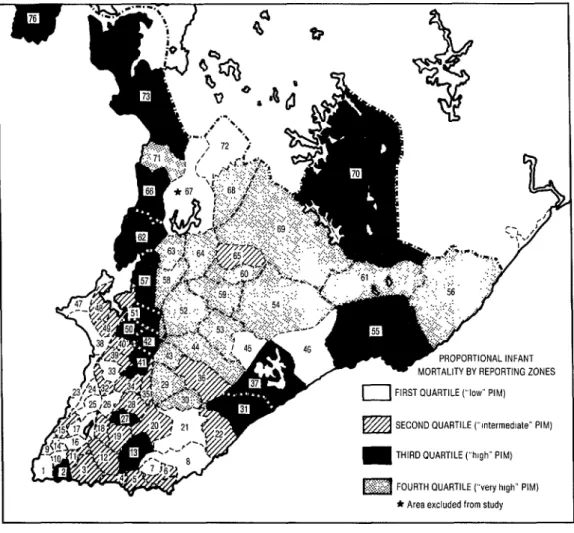
FIGURE 1. Proportional infant mortality in the city of Salvador, 1980, by reporting zone quartiles. In the first quartile (considered to have a relatively “low” level) infant mortality ranged from 3.9% to 17.1% of total mortality: in the second (with an “intermediate” level) it ranged from 17.9% to 25.8%; in the third (with a “high” level) it ranged from 26.5% to 37.5%; and in the fourth (with a “very high” level) it ranged from 37.5% to 52.5%. For the name of each reporting zone and more detailed information compiled on it, see Annex 2.
““!., .,. :: .* _( J
. . .
;/ .’
r- ‘.: I /
4
>
I’
.J
PROPORTIONAL INFANT
MORTALITY BY REPORTING ZONES
0 FIRST QUARTILE (“low” PIM)
SECOND QUARTILE (“mtermedlate” PIM)
THIRD OUARTILE (“high” PIM)
FOURTH QUARTILE (“very high” PIM)
* Area excluded from study
l per capita water supply (indi-
cator): water consumption in liters per in- habitant per day;
l residential density (crowd-
ing): the fractional number of residents per hundred square meters of residential area;
l availability of health center
and health post physicians: the number of
physicians available in heath centers and posts per 10,000 inhabitants;
l availability of maternity beds:
the number of maternity beds per 1,000 in- habitants;
l availability of hospital beds
(other than maternity beds): the number of hospital beds (other than maternity beds) per 1,000 inhabitants;
l education (indicator): the
The data on numbers of in- habitants, crowding, and types of hous-
ing were furnished by CONDER. The in-
formation on water usage was collected at EMBASA. The income data were ob-
tained from the Urban Development Master Plan prepared by the Central Planning Organization (OCEPLAN), an agency of the Municipal Government of Salvador. Information about the num- bers of physicians staffing municipal health centers and posts in 1980 was provided by the First Regional Health Directorate and the Municipal Health Secretariat. Data on the numbers of ma- ternity and other hospital beds were ob- tained from the ‘ ‘Cadastramento de Es-
tabelecimentos de Saude, 1980’ ’
(Survey of Health Establishments, 1980)
(11) and from hospital statistics maps
available at the CIS. The information on
the number of beds at one hospital (the Professor Edgard Santos Hospital) is for 1981 because no survey of that hospital was made by the health secretariat in 1980. Data on the numbers of students enrolled at the various primary public schools in Salvador in 1980 were pro- vided by the Bahia State Secretariat for Culture and Education and the Munici-
pal Secretariat for Education and
Culture.
After each type of informa- tion had been obtained for as many re- porting zones as possible, the reporting zones were placed in one of four quar- tiles depending upon the level of pro- portional infant mortality, and the data for each quartile were analyzed collec- tively. Reporting zones with fewer than 1,000 inhabitants, those with a propor- tional infant mortality equal to zero, and those where indicators of the inde-
pendent variables were unavailable were excluded from this analysis.’ The Spear- man correlation coefficient significance test was performed, using a level of sta- tistical significance of p < 0.05 with two
degrees of freedom.
RE
SULTS
The spatial distribution of
proportional infant mortality in the mu- nicipality of Salvador was found to be fairly uneven, ranging from 3.9 % in the reporting zone including Vitdria and Camp0 Grande (zone 9) in the center of the old city near the water to 52.5 % in Aguas Claras (zone 69), an outlying area. The map in Figure 1 shows the re- porting zones grouped into quartiles ac- cording to their levels of proportional infant mortality.
As the map indicates, zones
in the “low” quartile were generally
found near the shoreline of Todos OS Santos Bay to the west of the city, a shoreline extending from Ribeira (zone 47) to Barra (zone 1). This is the general area of the city that was first developed. The “low” quartile also includes Pituba (zone 8) and Itaigara (zone 21), upper- middle-class neighborhoods near the Atlantic Coast that experienced rapid growth in the 1970s.
Most zones in the “interme- diate” quartile were found toward the tip of the peninsula, starting around zone 36 (‘ ‘ 19 BC’ ‘) and including much of the heart of the city.
’ Ten zones were excluded for these reasons and eight others were paired (see Annex 2). reducing the origi- nal total of 76 zones to 62 for purposes of analysis. Accordingly, each of the four quartiles contained ei- ther 15 or 16 zones (quartile l-15; quartile 2-15;
However, most zones in the ‘ ‘high’ ’ quartile were found in outlying areas (and also in a few central slum areas), and most zones in the “very high” quartile were found in recently settled areas near the highways entering the city. These latter included many communities far removed from the city center that make up the so-called “pe- riphery of Salvador. ’ ’
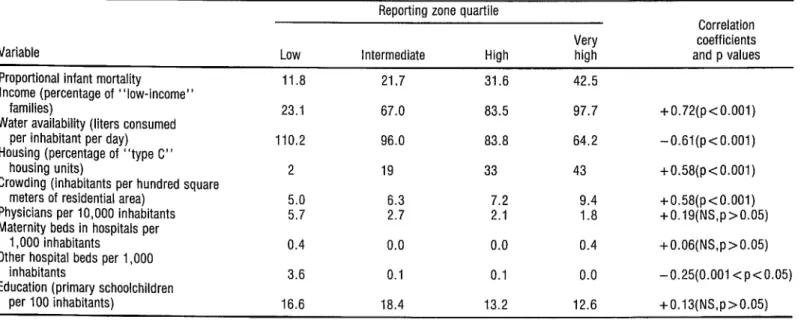
Table 1 shows the average levels of proportional infant mortality observed for each quartile, together with the values of the independent vari- ables selected for use in this study. Re- garding income, there was a direct cor-
relation between proportional infant
mortality and low-income families, such that the proportion of low-income fami- lies rose from 23.1% in the first (low proportional infant mortality) quartile to 97.7 % in the fourth quartile. Re- garding water supplies, an inverse corre- lation appeared between proportional infant mortality and water consump- tion, with the “low” proportional in- fant mortality quartile consuming some
110 liters per inhabitant per day while the “very high” quartile was consum- ing only 64 liters per inhabitant per day. Similarly, the percentage of “type C” housing (shacks) was directly associated with proportional infant mor- tality, rising from 2% in the first quar- tile to 43% in the fourth. Also, crowd- h
3
ing was directly associated with
proportional infant mortality, the num- .
3 ber of inhabitants per square meter of
s domicile area going from 5.0 inhabit-
.g ants per hundred square meters in the
u
ti i% first quartile to 9.4 inhabitants per hun-
:
dred square meters in the fourth. There was also an inverse cor-
2 n, relation between the average number of physicians per inhabitant and propor-
tional infant mortality, the average
230 number of physicians shrinking from 5.7 per 10,000 inhabitants in the first
quartile to 1.8 in the fourth. However, maternity beds were available only in the first and fourth quartiles, while nearly all the other types of hospital beds were concentrated in the first quartile.
Finally, the average numbers of public primary school students per 100 inhabitants were somewhat higher in the first and second quartiles than in the third and fourth, but the differences involved were not clearly significant,
The right-hand column in
Table 1 shows the correlation coeffi- cients between proportional infant mor- tality and the aforementioned indepen- dent variables for the set of 62 reporting
zones in the municipality of Salvador
that were included in the study, as well as these correlations’ respective levels of statistical significance.
Clear positive correlations were found between proportional infant mortality and the percentage of low- income families, the degree of residen- tial crowding, and the proportion of
type C housing (r = 0.58-0.72,
p < 0.001). Also, a strong inverse corre- lation was found between proportional infant mortality and per capita water consumption(r = -0.61, p<O.OOl).
Of the medical care indica- tors, however, only the number of hos- pital beds other than maternity beds per 10,000 inhabitants was found to have a weak inverse correlation with propor- tional infant mortality (r = - 0.25, p<O.O5).
TABLE 1. Levels of proportional infant mortality (PIM) and values of the selected independent variables in each reporting zone quartile in the municipality Of Salvador, Bahia, Brazil in 1980. The right-hand column shows the correlation coefficient and p values derived from comparison of the PIM figures with the independent variable data (NS = not significant).
Reporting zone quartile
Correlation
Variable
Very coefficients Low Intermediate High high and p values
Proportional infant mortality 11.8 21.7 31.6 42.5 Income (percentage of “low-income”
families) 23.1 67.0 83.5 97.7
Water availability (liters consumed
+0.72(p<O.O01)
per inhabitant per day) 110.2 96.0 83.8 64.2
Housing (percentage of “type C”
-0.61(p<O.O01)
housing units) 2 19 33 43
Crowding (inhabitants per hundred square
+0.58(p<O.O01)
meters of residential area) 5.0 6.3 7.2 9.4
Physicians per 10,000 inhabitants
+0.58(p<O.O01)
5.7 2.7 2.1 1.8
Maternity beds in hospitals per
+0.19(NS,p>0.05)
1,000 inhabitants 0.4 0.0 0.0 0.4
Other hospital beds per 1,000
+0.06(NS,p>0.05)
inhabitants 3.6 0.1 0.1 0.0
Education (primary schoolchildren
-0.25(0.001 <p<O.O5)
per 100 inhabitants) 16.6 18.4 13.2 12.6 +0.13(NS,p>0.05)
SOUrCes: Health Information Center (US) of the Bahia State Health Secretariat: Salvador Metropolitan Region Development Company (CONDER); Bahia Sanitation Enterprise (EMBASA): Secretaria Municipal de Salide, Secretaria Mumclpal de Educa@o; Secretaria de EducaqBo e Cultura.
c c Paim et al.
232
D
ISCUSSION
Analysis of the spatial distri- bution of infant mortality in Salvador reveals that an especially high propor- tion of those dying were infants residing in certain zones of the city, particularly
outlying neighborhoods and slums.
Even though proportional infant mor- tality does not really express the risk of death for a newborn in a given popula- tion the way the infant mortality coeffr- cient can do, it does at least indicate lo- calities where infant deaths account for an unusually large share of total deaths. Therefore, the findings obtained are important from a public health stand- point, partly because the proportional infant mortality indicator is derived from very basic information that is com- monly available, and partly because it permits needs to be identified and indi- cates where services should be directed to meet those needs.
Regarding the observed cor- relations between proportional infant mortality and selected socioeconomic variables, a few words should be said about methodologic constraints on cor- relations of this kind (1.2). Among other things, an ‘ ‘ecological’ ’ fallacy occurs when associations found to exist among groups of groups are interpreted as if they necessarily occurred among groups of individuals, i.e., as if group attrib- utes corresponded to individual attrib- utes. Thus, a study revealing a high de- gree of correlation between proportional infant mortality and the proportion of low-income households in a particular city district could not conclude, on the sole basis of those findings, that the in- fant deaths occurred in low-income households.
Nonetheless, because studies based on different designs have already shown associations between infant mor- tality and certain socioeconomic vari- ables, the objections to studies of the “ecological” type in this particular case may be only partly valid. Furthermore,
if the correlations found are not re- garded as definitive causal relationships but rather as ones that provide signifi- cant information for health planning, the correlations indicated by such “eco- logical” studies as the one reported here can be considered relevant to public health.
Regarding the present study, all of the socioeconomic variables em- ployed tend in some degree to reflect ur- ban land use patterns; but there is no reason to suppose that they reflect the historical and social processes that led to those land use patterns.
Overall, however, and in spite of these contraints, there seems good reason to conclude that use of re- search designs such as the present one may be indicated until such time as available health data are broken down
in terms of geographic and social differ- ences, and until improvements in the quality of those data permit studies that are theoretically and methodologically more refined.
Starting from these premises, the findings reported here appear to demonstrate that the infant deaths studied were not evenly distributed throughout the city. Also, the various correlations found point up the impor- tance of certain socioeconomic and sani- tation variables in the spatial distribu-
tion of proportional infant mor-
tality-an importance that appears far
greater than that of locally available medical and hospital facilities.
and Monteiro et al. in Sno Paul0 (G), have also reported high mortality differ- entials indicating significant contrasts among diverse population groups. That by Guerriero et al. (3) , based on data for Mexico’s Federal District, found propor- tional infant mortality to be 3.6 times greater in some localities than in others (and found proportional infant mortal- ity due to diarrhea to be 5.6 times greater in some localities than in oth- ers). Similar results were obtained in P&to Alegre (7), where it was found that outlying areas had an infant mor- tality coefficient twice as high as that found in the central city, a differential that was even wider in all areas when the rates among slum dwellers (75.5 infant deaths per thousand live births) and other residents (24.4 infant deaths per thousand live births) were compared. Contrasts such as these were also appar- ent in the study by Monteiro et al. (G), which found proportional infant mor- tality to vary from 10.53% to 46.54%. These findings are generally consistent with the present Salvador study findings indicating that proportional infant mor- tality varied greatly from one set of dis- tricts to another, ranging from 11.8% of total mortality in the first quartile of reporting zones to 42.5 % in the fourth. These combined findings suggest that the same social factors conditioning the use of urban land and the distribution of goods and services among the popu- lation also tend to influence propor- tional infant mortality in diverse dis- tricts of the study cities. Indeed, as Monteiro et al. (G) observed in S%o Paulo, the available public resources, instead of softening the impact of un- even income distribution among the in- habitants, seem to heighten the impact
by providing the most adequate re- sources to the relatively prosperous dis- tricts that need them least.
In the particular case of
health services, this pattern becomes worrisome to the extent that it tends to nullify the potential effects of primary care in reducing infant mortality (1.3). Among other things, the concentration of health care facilities in parts of Salva- dor with better living conditions penal- izes the residents of outlying areas by hindering their access to such facilities and reduces health care coverage for precisely those population groups that appear to run the greatest risk of disease and death.
Overall, the distribution of
proportional infant mortality in the mu- nicipality of Salvador indicates not only a need to redefine the urban develop- ment model prevailing in Latin Ameri- can cities but also to redefine the aims of the health services. It is not simply a question of seeking efficiency, efficacy, and effectiveness. If these three objec- tives are not accompanied by social poli- cies that give priority to equity, it is pos- sible to predict certain problems in attaining the proposed primary care goals implicit in the worldwide objec-
tive of “health for all by the year
2000. ’ ’
Insofar as sanitation is con- cerned, despite the expansion of water- supply coverage in Brazilian state capi- tals during the 1970s, an expansion that in certain cases may explain recent re-
duction of infant mortality (6), the
business-oriented approach of the Na-
tional Sanitation Plan (PLANASA) has
hindered the extension of water-supply systems to low-income groups (14) that run the greatest potential risk from diar- rhea1 disease.
Finally, it is worth noting that the highest correlation coefficient
ficient of association between propor- tional infant mortality and the percent- age of low-income residents. While this finding should not be surprising to stu- dents of infant mortality, it bolsters the hypothesis that economic structure plays a basic role as a factor in infant deaths, despite efforts to employ technologies that influence specific causes of morbid- ity and mortality in childhood. Hence, the recent decline in the rate of infant deaths in the city of Salvador (5) does not signify an improvement in the qual- ity of life for the whole population, be- cause the persistence of adverse social conditions among particular segments of the population is associated with sub- stantial variations of infant mortality in different city districts.
S
UMMARY
The study reported here, which was conducted in Salvador, Bra- zil, examines patterns of infant mortal- ity in different portions of that city. Be-
cause the available 1980 data on the
number of live births were not broken down by reporting zones, the study em- ploys proportional infant mortality (the number of infant deaths as a percentage of all deaths) as an indicator. It also groups the city’s reporting zones into quartiles according to their levels of pro- portional infant mortality and makes statistical comparisons between these quartiles with respect to various socio- economic and medical indicators.
This analysis shows that pro- portional infant mortality varied greatly
in the different quartiles-from 11.8 %
in the first to 42.5 % in the fourth. It also finds clear and highly significant as- sociations between proportional infant mortality and several socioeconomic and
sanitation variables-these being the
percentage of low-income families in the reporting zones, water consump- tion, the prevalence of substandard housing, and crowding. In contrast, no statistically significant associations were
found between proportional infant
mortality and the number of physicians per 10,000 inhabitants, the number of maternity beds in hospitals per 1,000 inhabitants, or the number of students in public primary schools per 100 inhab- itants; and only a weak association was
found between proportional infant
mortality and the number of nonmater- nity hospital beds per 1,000 inhabitants. These findings demonstrate that the infant deaths studied were not evenly distributed throughout the city. They also point to an important associa- tion between certain socioeconomic and sanitation variables and infant survival. Finally, they suggest that a recent de- cline in the rate of infant deaths in Sal- vador (5) does not signify an improve- ment in the quality of life for the whole
population-because of the persistence
of adverse social conditions and rela- tively high proportional infant mortality in certain city districts.
RE
FERENCES
Grant, J. P. Estado mundial de la infancia. United Nations Children’s Fund (UNICEF), Washington, D.C., 1984, 53 pp.
Guerreiro, R. L., S. A. L. L. Lopez: 0. Pe- drotta, and R. Y. Pizarro. Mortahdad di- ferencial en el Distrito Federal. Mimeo- graphed document. Pan American Health Organization, Mexico, D.F., Mexico, 1978, 37 PP.
Osuna, J. Enfoque de riesgo en la atencion maternoinfantil. In: Pan American Health Organization. Sa/z& matemoinfantd y aten- cib primaria en Las Am&has: Hechos y ten- dencias. PAHO Scientific Publication 461. Washington, D.C., 1984.
Paim, J. S., and M. da C. N. Costa. Variayao da mortalidade infantil em diferentes capitais brasileiras (1960-1979). Rev Baiana Salide Pz%ha (Salvador) July and December 1982, pp. 125-135.
Monteiro, C. A., M. H. D. Benlcio, and M. F. A. Baldijso. Mortalidade no primeiro ano de vida e a distribuiglo de renda e de re- curses pdblicos de saude, Sao Paul0 (Brasil). Rev Sahde PiWica (Go Pado) 14~515-539, 1980.
Guimarges, J. J. de L., and A. Fischmann. Desigualdades na mortalidade infantil entre favelados e nio favelados no municipio de P&to Alegre, Rio Grande do Sul, em 1980. BoL OfSanit Panam 101(1):19-38, 1986.
Paim, J. S. Indicadores s6cio-econ8micos e evolu@o da mortahdade infantil no Muni- clpio de Salvador 1969-1977. Rev Baiana Salide PzZbhca (Sahador) January 1980 and June 1981, pp. 26-40.
9 Paim, J. S., C. N. Dias, and J. D. de Aratijo. InfIuencia de fatores sociais e ambientais na mortalidade infantil. Bd Of Sanit Panam 88(4):327-340, 1980.
10 Brasil, MinistErio de Satide, Secretaria Na- cional de A@es Basicas de Sadde, Divisao National de Epidemiologia. Estatfitica de Mo?taLidade: Brad 1980. Centro de Docu- mentagao, Brasilia, 1983, 354 pp.
11
12
13
14
Bahia, Secretaria de Satide, Centro de Esta- tistica e Processamento de Dados. Ertabel’eci- mentos de Salid..: Regiao Metropol’itana de Sahador, Estado da Bahia, Cadastramento a’as Unidades de Salide. Salvador, 1980.
Almeida FiIho, N. M. de. Problemas e pers- pectivas atuais da pesquisa epidemiol6gica em medicina social. In: C. A. de Souza and J. A. de A. C. Taddei (eds.). Textos de Epi-
Aemiologia. Secretaria de Planejamento, Conselho NacionaI de Pesquisas-Coorde- na@o Editorial, Brasilia, 1984, pp. 9-37.
Taller sobre Atencion Primaria y Mortahdad de1 Niiio. Working document. Mexico City, Mexico, 7-11 May 1984.
A. Constm@o. OS erros da politica centrah- zadora. A. Constm@o (Go Pado) 134:12- 16, 1984.
kJ ch PAHO &&tin 21(3), 1987
ANNEX 1. Brazil’s Death Certificate Form
DEATH CERTIFICATE NO.
REGISTRY
IV
RECEIVED MEDICAL CARE DURING THE ILL-
q
THEUNDERSIGNED PHYSICIAN ATTENDEDTHE THE DIAGNOSIS WAS CONFIRMED NESSTHATCAUSEDDEATH DECEASED BY S"PPLlMfNTARY EXAMIHAWW BYSURGERY 1 BYAUTOPSYYES 0 NO 0 UNKNOWN q YES 0 SUBSTITUTE 0 ML q SVO 0 OTHER 0 YES 0 NO 0 YES 0 NO q YESO HOC
CAUSE OF DEATH (ENTERONLYONEDIAGNOSISPEA LINE) ofd~seasetodeatl Interval from onse
PART I
DISEASE OR PATHOLOGIC CONDITION THAT al
DIRECTLYCAUSEDDEATH DUETOORASACONSEQUENCEOF
ANTECEDENTCAUSES
PATHOLOGlCCONOITIONS,IFANY,THATLEDTO b) DUETOORASACONSEQUENCEOF
THE CAUSE CITED ABOVE. (ENTERTHE BASIC CAUSE LAST)
cl I
ia
PART II I
OTHER SIGNIFICANT PATHOLOGIC CONDITIONS THAT CONTRIBUTEDTO DEATH BUT WERE UN- RELATEDTOTHEDlSEASEORPATHOLOGlCCON- DITIONTHATRESULTEDIN DEATH
HOMICIDE 0 SUICIDE 0 ACCIDENT 0 UNKNOWN 0 YES 0 NO 0 UNKNOWN 0 TRANSIT 0 HOME q OTHER 0 UNKNOWN 0
q
CRM DATEOFCERTIFICATE PHYSICIAN'S ADDRESS HTELEPHONE HSIGNATURE~CEMETERYWHERE DECEASED WILL BE INTERRED
t2 03 PAHO Bdein 21(3), 1987
ANNEX 2. 1980 data compiled for each reporting zone in Salvador, Bahia, Brazil, on population, numbers of infant and total deaths, and seven SOCiOeCO- nOmiC and health care indicators, by number of reporting zone (see map in Figure 1).
No.
Reporting zone Name
No. of No. of students No. of Water physicians enrolled in Infant residents use % of (at health No. of pnmary No. of Total no. deaths per 100 (Iners inhabitants centers hospitals public infant of deaths as % square meters % of per wnh and posts) beds per schools
deaths (all of all of housmg type C capna incomes per 10,000 1,000 per 1,000 Populahon (i 1 year) ages) deaths area housing per day) in range Ca inhabitants inhabnants inhabitants 01 Barra
02 Jardlm Apipema 03 Ondma 04705 Rio Vermelho 06 Avaralma 07 Nordeste 08 Pituba
09 VrtorialCampo Grande 10 Graqa
11712 Alto das Pombas/FederaFlo/ Eng. Velho Federa@ 13 Horto Florestal 14 Canela 15 Centro Historic0 16 17 18 19 20 21 22 23 :; 26 27 28 29 30 31 32 33 34 35c 36 37 Garcia Barns/Ponte Nova Eng Velho Brotas Acupe Brotas
Pq N S Luz/ltargara Stiep/Armar$o Frederic0 Pontes Pilar/Rua Chile/B. Sapateiro Nazare/Datide
Matatu Cosme de Farias Luis AnselmolVila Laura Cabula
Pernambues Boca do Rio BarbalholLapinha Carxa D’Aoua CkuntasK~dade Nova Acesso Norte 19 BC Pituacu
30.744 20 199 10.0 12,966 13 36 36.1 5,430 a 31 25.8 19,883 47 199 23.6 28,753 16 89 18.0 39,016 a7 295 29.5 24,873 27 158 17 1 9,070 2 51 3.9 13,583 a 98 a.2 59,693 9,107 8,536 21,854 i 2.890 15.009 32;317 21.290 25,926 12.102 13,959 1,988 14,755 23.874 12,561 34,207 15,016 16,437 31,321 29,211 18,412 29,699 36,451 718 5,190 6,782 91 i 32 14 14 44 11 77 i 5 26 28 9 a2 10 124 123 90 35 16 68 a 1 6
440 20.7 23 30.4 47 6.4 179 17.9 100 14.0 100 14.0 204 21.6 59 18.6 398 19.3 12 16.7 40 22.5 32 15.6 158 16.5 261 to.7 120 7.5 270 30.4 52 19.2 311 39 9 315 39.0 277 32.5 180 19.4 102 15.7 309 22.0 33 24.2 5 20.0 21 28.6
38 39/40 41 42 43 44 45C.d 46c 47 48 49 50151 52 53 54 55 56c.d 57 58 59 60 61 62 63 ii 66 67$ :i 70 71 72= 73 Calcada/Mares/Roma Liberdade laoi Fazenda Grande S. Goncalo do Retiro Engomadelra Centro Adm. da Bahia lata/Patamares Bomfim/Ribeira Jardim Cruzeiro Uruguai S%o Caetano Mata Escura Sussuarana ParalelaKstrada Velha
do Aeroporfo ltapoti
Praias do Flamenco/ Aeroporto/Stella Mares Lobato/Pirajh Campinas Pau da Lima Sete de Abril
Mussurunga/S. Cristovao Plataforma Pirajl Piraja/Portoseco Castelo Branco Escada/Periperi Sao Bartolomeu Val&ia Aguas Claras Estrada Cia-Aeroporto coutos
Limite C/Usiba Paripe/Base Naval
23,107 86,983 29,342 37,830 12,227 41,190 2 601 29,083 50,682 38,627 82.961 11,896 is.531 12,708 23,782 122 32,707 16,136 29,983 13,738 21.368 42,416 14,447 6,501 14,927 35,493 926 6,367 10,276 3,796 15,620 651 34,568 74= Islands: Born Jesus, Frades,
Capeta, Vacas Maria Guarda 2,383 75= Madre de Deus 7,943 76c llha de Mare 2,702 Unknown Unregistered 26 167 53 88 57 36 1 280 a2 69 164 51 a2
264 9.8 700 23.9 168 31.5 299 29.4 139 41 .o 93 38.7 12 a.3 3 0.0 227 12.3 392 20.9 271 25.5 616 26.6 111 45.9 167 49.1 17
75
44.7 a.7 35 73.3 92.0 - 36.4 5.9 13 73.3 87.1 10.1 15 a4 29 144 64 56 113 56 15 24 106 2 46 2”: 50 32 247 76 329 139 134 346 148 40 105 314 2 102 61 56 116 1 302 46.9 34.0 38.2 43.8 46.0 41 .a 32.7 37.8 37.5 22.9 33.8 100.0 45.1 52.5 35.7 43.1 -
109 36.1 6.7 2 6 33 3
14 39 35.9 6 16 37.5 48 199 24.2 118 167 70.7
6.0 a.5 5.7 13.8 9.5 9.3 - 5.7 a.9 9.8 9.5 11.5 10.7
13 2 11.0 11.5 10.0 6.4 a.4 ii.8 Ii.8 7.7 6.8 7.4 a.7 6.9 a.1 - - - - 30 28 74 ii! - 70.0 70.0 70.0 70.0 73.3 73.3 - - - 3 70.0 34 70.0 43 70.0 40 70.0 59 73.3 60 73.3
- :: 58 48 2 23 62 62 9 7 - 70.0 43.3 60.0 60 0 73.3 43.3 43.3 43.3 60.0 66.7 12 ii 21 - 7 - - - 43.3 60.0 73.3 66.7 - 66.7 - - - 46.8 86.0 86.0 86.0 99.8 99.8 - 46.9 46.9 46.9 86.0 99.8 92.0 - 96.0 96.0 92.0 92.0 100.0 94.2 96.0 96.0 92.0 94.2 94.2 100.0 100.0 94.2 - 94.2 - - 26.8 7.9 - 0.5 - - - - 2.4 - 1.6 - - - - 3.7 9.5 2.8 2.0 a.7 1.6 - - - - - - 13.8 - a.5 - - - - - - - - - 13.2 - - 0.9 - - 30.5 13.2 10.0 16.6 31.6 2.3 - 30.9 14.3 28.2 13.6 13.1 8.8 2.3 3.8 16.7 - 11.6 4.8 19.8 5.6 25.1 16.1 la.3 5.0 28.8 19.9 - 22.0 7.2 9.4 11.2 - 21.4 is.4 0.9 16.2
Sources: Health InformatIon Center (CIS) of the Bahia State Health Secretariat; Salvador Metropolitan Region Development Company (CONDER): Bahia Sanltatron Enterprise (EMBASA). a The % of people living in households with incomes less than five times the minimum wage.
b - = no information. c Excluded from study.
d The disparity between the number of inhabitants and number of deaths in the two indicated zones (neither of which were included in the study) could be partly due to the fact that the popufabon and mortality data were obtained from different sources.
N