ARTISANAL FISHERIES PRODUCTION IN THE COASTAL ZONE OF ITAIPU,
NITERÓI, RJ, BRAZIL*
Rafael de Almeida Tubino1**;Cassiano Monteiro-Neto1; Luiz Eduardo de S. Moraes2 & Eduardo Tavares Paes2
1
Universidade Federal Fluminense, Departamento de Biologia Marinha Pós-Graduação em Biologia Marinha
(Caixa Postal 100644, 24001-970 Niterói, RJ, Brasil) **[email protected]
2
Instituto Nacional de Pesquisas Espaciais – INPE
Grupo de Sensoriamento Remoto Aplicado à Pesca – Divisão de Sensoriamento Remoto (Av. dos Astronautas, 1.758, Jd. Granja, 12227-010 São José dos Campos, SP, Brasil)
A B S T R A C T
Artisanal fisheries in the coastal zone of Itaipu-RJ play an important role in the local market, but little is known about production and productivity of the fisheries. From April 2001 to March 2003, we monitored a total of 618 landings from the beach-seine (99), the gill nets (“corvineira” - 331, “linguadeira” - 40 and “rede alta” - 25), the hook and line (98), the squid jigging (17), and the spear fishing and trap fisheries (five and three, respectively). The total monitored production was 21866 kg and the catch per unit effort (CPUE) 35.4 kg.trip-1. Considering the number of effective fishing days and the average daily production per fishing gear, the annual production was estimated at 136687 kg (0.2% of the state’s production in 2004). Predominant resources were: Micropogonias furnieri, Trichiurus lepturus, squids (Loligo spp.), clupeiform fishes (Sardinella brasiliensis, Cetengraulis edentulus, Pellona harrowerii and Harengula clupeola), Eucinostomus spp., Cynoscion spp., Menticirrhus spp., Caranx crysos and Selene setapinnis. The combined analysis using hierarchical and non-hierarchical classification methods, separated four fishing gears and five species groups, based on their similarity patterns, identifying gears that most effectively capture the different fish groups. The beach-seine was less selective and most productive fishery in the summer. The “corvineira” was the second most productive fishery with higher yields in the summer and fall. Catches of “linguadeira” included rays and Paralychthys spp., wherereas the “rede alta” caught primarily M. furnieri, Mugil spp. and sharks.
R E S U M O
As pescarias artesanais na zona costeira de Itaipu-RJ desempenham um papel importante no mercado local, mas pouco se conhece sobre a produção e a produtividade da pesca. De abril-2001 a março-2003, nós monitoramos um total de 618 desembarques das pescarias de arrastos-de-praia (99), de redes de emalhe (corvineira - 331, linguadeira - 40 e rede alta - 25), de linha-e-anzol (98), de zangareio (17), e de arpão e puçá (cinco e três respectivamente). A produção monitorada total foi de 21866 kg e a captura por unidade de esforço (CPUE) de 35,4 kg.viagem-1. Considerando o número de dias efetivos de pesca e a produção média diária por arte de pesca, a produção anual foi estimada em 136687 kg (0.2% da produção do estado em 2004). Os recursos predominantes foram: Micropogonias furnieri, Trichiurus lepturus, lulas (Loligo spp.), peixes clupeiformes (Sardinella brasiliensis, Cetengraulis edentulus, Pellona harrowerii e Harengula clupeola), Eucinostomus spp., Cynoscion spp., Menticirrhus spp., Caranx crysos e Selene setapinnis. A análise combinada utilizando métodos de classificação hierárquica e não-hierárquica separou quatro grupos de artes de pesca e cinco de espécies, baseada nos seus padrões de similaridade, identificando as artes de pesca que melhor capturam os diferentes grupos de recursos pesqueiros. O arrasto-de-praia foi a arte de pesca menos seletiva e mais produtiva no verão. A corvineira foi a segunda pescaria mais produtiva com rendimentos maiores no verão e outono. As capturas com linguadeira incluíram raias e Paralychthys spp., enquanto que a rede alta capturou principalmente M. furnieri, Mugil spp. e tubarões.
Descriptors: Artisanal fisheries, Production, CPUE, Coastal zone, Itaipu-RJ, Brazil. Descritores: Pesca artesanal, Produção, CPUE, Zona costeira, Itaipu-RJ, Brasil. __________
INTRODUCTION
Human demand for marine resources is increasing worldwide, especially in large urban centers of developing countries. Under this scenario, small scale artisanal fisheries play an important role for supporting local and regional markets. Reported small scale marine fisheries account for 40% of the marine fish taken for human food (FAO, 1998) and comprise about 50 million fishers (Berkes et al., 2001). Along the Brazilian coast, the artisanal fishery sector plays an important economic, social and cultural role, responsible for a great part of the overall catches (Diegues, 1999). However, data on this sector are frequently scattered and isolated, thus limiting the possibilities for establishing catch and productivity patterns for supporting management strategies and initiatives.
Due to their dynamics and multispecies catches, artisanal fisheries use several fishing gears and affect different fish stocks. Jablonski & Silva (1996) considered that, for the most part, the fishing effort of artisanal fishers is within sustainable limits and are usually adequate for the exploitation of local resources. On the other hand, several authors (Begossi, 1992, 2006; Nehrer & Begossi, 2000; Kant de Lima & Pereira, 1997) demonstrated that most artisanal fishers have complained about the drastic decline of fish
stocks, mostly due to competition with the industrial fleet, but also as a consequence of coastal environment degradation. Furthermore, competition for space and exclusion from their traditional fishing areas, also limited access to the fish stocks and reduced the artisanal production capability.
The coastal region of Itaipu (22°53’14”S, 43º22’48”W) shelters intensive artisanal fisheries, established in the area since the 18th century, and currently involving about 200 fishers. The area is located to the west of the mouth of Guanabara Bay, and forms a semi-sheltered cove protected by three coastal islands (Fig. 1). The coastal water mass is a mix of Guanabara Bay waters, contributions from the Itaipu-Piratininga lagoons, and coastal oceanic waters, seasonally influenced by weak upwelling of the South Atlantic Central Water, following the general pattern for the South Atlantic Bight (Castro-Filho et al., 1987).
This study aims to identify the fisheries catch composition and provide estimates of the total fishing production and productivity. We further used a combined hierarchical and non-hierarchical classification analysis to evaluate similarities between the species composition and productivity from the different fishing gears used, to define seasonal species groups that constituted the artisanal fishery harvests in the Itaipu coastal zone.
43°07’ W
23°05’ S Piratininga
Lagoon
Pai Island
Mãe Island Menina Island
N 0 1Km
MATERIAL AND METHODS
We monitored the artisanal fisheries landings, one to four times a month, at Itaipu, Niterói-RJ, from April 2001 to March 2003 (618 trips in 77 days), recording data on the fishing fleet, fishing gear, catch composition and abundance for estimating fisheries effort, production, CPUE and seasonality. Sampling effort was determined mostly by the availability of the research crew.
Data regarding the catch compositon, the fishing gear used, the area where fishing occurred, and time spent fishing was gathered through interviews with the fishers. Data on fisheries production were obtained from estimates of the total number of boxes landed of a given species, taking that one box weights 22.0 kg of fish. This measure was also checked at times, by weighing randomly selected boxes with a 100 kg scale with 0.5 kg precision. We also weighed individuals of selected species for calibration and length-weight relationships using several precision scale dinamometers.
The fishing areas outlined in Figure 1, were established based in the literature (Kant de Lima & Pereira, 1997; Begossi, 2006), personal observations and fishers interviews in which they were asked to mark, in a nautical chart, fishing grounds for different gears used
Fishing opperations and gears used in the fishing area included the beach seining, the gill netting, the hook and line, squid jigging, spear fishing and a trap fisheries. In order to standardize fishing effort we considered boat trips as our effort unit. Beach seine fishing operations were also considered as boat trips. All trips were monitored at the landing site during the sampling day, by teams of two to three observers. Once a month one beach-seine operation was followed throughout in order to record the full fishing operation, fish sorting, and marketing.
To estimate annual fisheries production, separated by fishing gear and by season, we first calculated the average catch (kg) per trip (CPUE) for each gear within a season. We then estimated the average number of trips (T) based on a standard monitoring day in which we were certain that, for each particular gear, all trips were monitored within that day. To estimate the effective fishing days (DF) we subtracted from the total number of days in each season: (a) the number of cold fronts passing through the region, obtained from climate bulletins. We assumed, based on interviews and personal observations, that for each cold front fishers don’t go out fishing for three days. (b) Sundays and holidays in which fishng does not occur. We then used the following empirical relationship to calculate
production within a season: Production = CPUE * T * DF.
The seasonal groups considered followed approximately the conventional southern hemisphere four seasons definition: Summer – January to March; Fall – April to June; Winter – July to September; and Spring – October to December.
Species were identified according to the specialized literature (Carvalho-Filho, 1999; Figueiredo, 1977; Figueiredo & Menezes, 1978, 1980; Menezes & Figueiredo, 1980; 1985; 2000; Nelson, 1994). Species data were also checked with Fishbase website (www.fishbase.org).
To evaluate the similarity in the catch specific composition among the fishing gears, species catch data from the 610 monitored fishing operations were rearranged on a 22 column (samples – fishing gear by season) by 74 row (species) matrix. Spear fishing and trap fisheries were not considered in this analysis due to their small frequency of occurrence. The squid jigging fishery did not occur in the winter and spring. Only species that presented catches greater than 0.5 kg were included in the matrix.Values within the matrix represent the average catch of a given species, captured by one fishing gear at a certain time of the year (Table 2). Data were log transformed [ln (catch + 1)] and later standardized using the "Ranging for variables with arbitrary zero" procedure proposed by Milligan & Cooper (1988), defined as:
) ( ) (
) (
X Min X Max
X Min X
XP −
−
= , where:
XP = standardized value X = original value, Min(X) = smallest column value, Max(X) = largest column value. After standardization values within each column vary between 0 and 1. The transformed and standardized matrix was submitted to q-mode (grouping samples - columns) and r-mode (grouping species - rows) classification analyses (Legendre & Legendre, 1998). Q-mode classification was conducted using SHAM (Sequential Hierarchical Agglomerative Method), using the Ward method for generating hierarchical dendrograms. This method uses analysis of variance to define clusters by minimizing the sum of squares and maintaining within group variance as homogeneous as possible (Milligan & Cooper, 1987; Rossi-Wongtschowski & Paes, 1993). The analysis was accomplished using the free access software: FITOPAC1 (Shepherd, 1995).
are geometrically as compact as possible around their respective centroids. The method is particularly efficient when classifying widely distributed variables with many null values without the need for establishing a relative scale of dissimilarity (Legendre
et al., 2002). The best number of groups present in a
data set was defined by maximum value of the C-H index (Calinski & Harabasz, 1974) for different partitions (number of groups), where:
(
)
(
)
(
)
−
− −
= −
K n R
K R H C
1
1 2
where, R2 = (SST – SSE)/SST.
SST is the total sum of squared distances to the overall centroid and SSE is the sum of squared distances of the objects to their group’s own centroids. The classification way r was accomplished with the aid of the free software K-MEANS2 (Legendre, 2001), available in:
(http://www.bio.umontreal.ca/casgrain/en/labo/kmeans.html).
Finally, both classifications were jointly analized to verify species groups that were strongly associated with particular fishing gear groups. This approach of combining q-mode and r-mode classifications in two-way tables is usually called nodal analysis (Rossi-Wongtschowski & Paes, 1993).
RESULTS
Monitored Landings
During the sampling period we recorded eight types of fisheries operating different fishing gears. A description of the fisheries methods is given by Kant de Lima & Pereira (1997). The beach-seine fishery operates from shore, at several stations distributed over Itaipu and Camboinhas beaches. Three types of gill net fisheries (“corvineira”, “linguadeira” and “rede alta”) operate within the cove and sometimes behind the islands. The hook and line and the squid jigging are conducted in more sheltered waters, off Itaipu Beach and between the Menina and Mãe Islands. Spear fishing is performed near the rocky coast and around all three islands. Traps (“Puçás”) are mostly used in shallow waters at Itaipu Beach (Fig. 1).
Landings from the “corvineira” gill net fishery were the most common (53.6%) among all monitored trips, followed by the beach-seine (16.0%), hook and line (15.9%), the “linguadeira” and “rede alta” (6.5% and 4.0% respectively), squid jigging (2.5%) and spear fishing (0.8%) (Table 1).
A total of 98 species were captured in the monitored trips. Nevertheless most species occurred sporadically at low abundances. The most important species or species categories caught (>1.0% of the total) were: croaker (Micropogonias furnieri), largehead hairtail (Trichiurus lepturus), squids (Loligo spp.), clupeiform fishes (Sardinella brasiliensis,
Cetengraulis edentulus, Pellona harrowerii and
Harengula clupeola), mojarras (Eucinostomus spp.),
weakfish (Cynoscion jamaicensis, C. leiarchus, and C.
guatucupa), kingfish (Menticirrhus littoralis, M.
americanus), banded croaker (Paralonchurus
brasiliensis), blue runner (Caranx crysos), atlantic
moonfish (Selene setapinnis) and smooth puffer
(Lagocephalus laevigatus) (Table 1).
The total monitored production was 21.8 tons with an average of 35.4 kg.trip-1. The beach-seine was responsible for more than half of the volume caught (10793 kg) and showed the highest CPUE (109 kg.trip-1). Gear selectivity was low capturing several species and individuals of all sizes. The largehead hairtail was the predominant fish in the beach-seine catch, contributing 18.8% of the total monitored production, followed by squids (12.0%), croaker (11.2%), clupeiform fishes (10.5%) and mojarras (9.8%) (Table 1).
Catches from the “corvineira” fishery yielded a total of 8378 kg, representing approximately 38.0% of the total monitored catch, with a CPUE of 25.3 kg.trip-1. The fishery focuses on demersal fishes, especially croaker, which represented about 82.3% of the total “corvineira” catch (Table 1).
Hook and line was the third most important fisheries monitored in the period. The total catch was equal to 2063 kg and CPUE to 21.0 kg.trip-1. The fishery is highly selective capturing mostly the largehead hairtail (Table 1).
Production from both “linguadeira” and “rede alta” gill nets were low (282 kg and 248 kg respectively). The yield from the “linguadeira” fishery was 7 kg.trip-1 and the catch included flounders
(Paralychthys spp.) and croaker, whereas for the “rede
alta” CPUE was 10 kg.trip-1, and caught mostly demersal-pelagic resources (M. furnieri, Mugil spp.,
Rhizoprionodon spp. and Sphyrna lewini) (Table 1).
The squid jigging fishery is highly seasonal and focused in a single resource. Total monitored production was equal to 48 kg and CPUE to 2.8 kg.trip-1 (Table 1). Nevertheless, squids reach a high market value making them an important fishery resource.
Portuguese English Catch FO Catch FO Catch FO Catch FO Catch FO Catch FO Catch FO Catch FO CatchCPUEFO
Corvina Croaker Micropogonias furnieri 1209 43.4 6899 95.2 31 17.5 42 36.0 28 7.1 8208 13.361.7 Espada Largehead hairtail Trichiurus lepturus 2028 50.5 204 21.1 8 7.5 21 24.0 1897 84.7 4158 6.734.3
SARDINHAS Clupeiform fishes *a 1131 33.3 1131 1.8 5.5
Carapicu Majorra Eucinostomus spp. 1062 44.4 11 0.6 0 1.0 1073 1.7 7.6 PESCADAS Weakfish *b 637 22.2 204 36.0 3 10.0 3 12.0 69 6.1 916 1.524.9 PAPA-TERRA Kingfish *c 579 47.5 87 24.5 3 7.5 19 48.0 1 2.0 689 1.123.6 Xerelete Blue runner Caranx crysos 342 24,2 10 2.4 1 12.0 34 7.1 388 0.6 6.8
Mistura Mixed catch 354 17.2 354 0.6 2.8
Galo Atlantic moonfish Selene setapinnis 239 25.3 10 7.9 1 5.0 2 24.0 253 0.4 9.5 Baiacú-arara Smooth puffer Lagocephalus laevigatus 227 28.3 2 0.6 6 4.0 4 3.1 239 0.4 5.5 Roncador Barred grunt Conodon nobilis 183 8.1 0 0.6 0 1.0 184 0.3 1.8
Xixarro Rough scad Trachurus lathami 182 13.1 182 0.3 2.3
Tainha Mullet Mugil spp. 121 24.2 12 2.1 3 2.5 32 36.0 167 0.3 6.6
Palombeta Atlantic bumper Chloroscombrus chrysurus 153 22.2 3 6.3 5 24.0 161 0.3 7.9 BAGRE Marine catfish *d 96 5.1 54 15.1 3 10.0 3 12.0 2 2.0 158 0.310.4 Pampo Florida pompano Trachinotus carolinus 63 20.2 81 19.9 1 2.5 8 20.0 153 0.214.9
BICUDA Barracuda Sphyraena spp. 149 20.2 1 1.2 150 0.2 3.9
Anchova Bluefish Pomatomus saltatrix 70 14.1 61 13.0 2 2.5 12 12.0 1 2.0 145 0.210.2 Gordinho Harvestfish Peprilus paru 64 5.1 33 8.8 2 5.0 1 4.0 101 0.2 6.0
Linguado Flounder *e 9 9.1 37 11.5 32 50.0 1 4.0 79 0.111.0
Coió Flying gurnard Dactylopterus volitans 76 32.3 0 0.9 0 8.0 0 1.0 77 0.1 6.1
Riscadinha Sand drum Umbrina coroides 75 16.2 75 0.1 2.8
COCOROCA Grunt *f 51 32.3 14 14.8 7 14.2 72 0.115.5
Baiacú-espinho Burrfishe Chilomycterus spinosus 54 19.2 0 1.0 54 0.1 3.4 Garoupa Grouper Epinephelus spp. 2 1.0 39 6.0 2 2.5 2 1.0 5 20.0 48 0.1 3.9
Robalo Snook Centropomus sp. 3 2.0 31 7.6 7 7.5 5 20.0 45 0.1 5.7
Abrótea Brazilian codling Urophycis brasiliensis 45 11.2 45 0.1 6.0
Xixarro Bigeye scad Selar crumenophthalmus 43 10.1 43 0.1 1.6
Badejo Black grouper Mycteroperca sp. 1 1.0 36 5.4 1 2.5 3 20.0 1 1.0 41 0.1 4.2 Piraúna Atlantic seabream Archosargus sp. 27 3.0 6 1.2 2 2.5 6 4.0 41 0.1 1.5 Chinelo Leatherjack Aluterus monoceros 30 7.1 1 0.3 4 1.0 35 0.1 1.5
Trilha Dwarf goatfish Upeneusparvus 35 24.2 35 0.1 4.2
Vermelho-caranhoSnapper Lutjanus sp. 19 3.0 8 2.7 1 2.0 27 0.0 2.3
Parati Mullet Mugil sp. 22 18.2 0 0.3 1 2.5 23 0.0 3.2
Manjuba Broadband anchovy Anchoviella lepidentostole 21 1.0 21 0.0 0.2 Sororoca Spanish mackerel Scomberomorus brasiliensis 4 8.1 4 1.2 11 20.0 19 0.0 2.8 Olho-de-cão Atlantic bigeye Priacanthus arenatus 7 14.1 1 1.2 0 2.5 6 24.0 1 1.0 0 20.0 15 0.0 4.4
Cherne Snowy grouper Epinephelus sp. 4 3.0 7 3.0 2 2.0 14 0.0 2.4
Faqueco Crevalle jack Caranx hippos 8 4.0 1 1.2 4 3.1 13 0.0 1.8
Linguado Dusky flounder Syacium papillosum 2 4.0 7 10.0 10 0.0 1.3
Galo-de-penacho Lookdown Selene vomer 7 6.1 2 1.2 1 4.0 9 0.0 1.8
Mamangá-liso Toadfishe Porichthys porosissimus 1 4.0 8 3.6 8 0.0 2.6
Marimbá Silver porgy Diplodus argenteus argenteus 2 10.1 4 5.4 0 5.0 2 4.0 1 3.1 8 0.0 5.5
Serra Atlantic bonito Sarda sarda 4 0.9 4 8.0 8 0.0 0.8
MICHOLE Sand seabass Diplectrum spp. 6 17.2 1 4.1 6 0.0 3.6
Bonito Skipjack tuna Katsuwonus pelamis 6 0.6 6 0.0 0.3
Enxada Atlantic spadefish Chaetodipterus faber 5 3.0 5 0.0 0.5
PARGO Common seabream *g 1 3.0 4 6.3 5 0.0 3.9
Sargo-de-beiço Sheepshead Archosargus probatocephalus 3 1.8 1 2.5 1 20.0 4 0.0 1.3 Peixe-porco Planehead filefish Stephanolepis hispidus 2 21.2 0 3.3 0 8.0 3 0.0 5.7 Mira-céu Southern stargazer Astroscopus y-graecum 0 1.0 0 2.1 3 7.5 3 0.0 1.8
Guaivira Leatherjack Oligoplites saurus 2 4.5 0 2.0 3 0.0 2.9
Xixarro-cobra Round scad Decapterus punctatus 2 9.1 2 0.0 1.5
Salema Atlantic seabream Archosargus rhomboidalis 1 0.3 1 1.0 2 0.0 0.3 Carapeba Caitipa mojarra Diapterus rhombeus 1 15.2 0 1.8 0 4.0 0 1.0 1 0.0 3.7 Cangulo Grey triggerfish Balistes capriscus 1 7.1 0 0.3 0 4.0 1 0.0 1.5
Pirangica Sea chub Kyphosus sp. 1 12.0 1 0.0 1.3
Carango Bonefish Albula vulpes 1 4.0 0 0.3 0 4.0 1 0.0 1.0
Pampo-galhudo Palometa Trachinotus goodei 1 2.0 1 0.0 0.6
Peixe-lagarto Inshore lizardfish Synodus foetens 0 2.0 0 0.3 0 0.0 0.5
Peixe-trombeta Red cornetfish Fistularia petimba 0 5.1 0 0.0 1.0
Peixe-pedra Scorpionfish Scorpaena sp. 0 2.0 0 0.0 0.5
Barriga-cheia Barbel drum Ctenosciaena gracilicirrhus 0 7.1 0 0.0 1.3
9414 7938 110 193 2059 0 0 5 19721 31.9
Tubarão-martelo Hammerhead Sphyrna lewini 150 6.0 25 12.0 175 0.3 3.7 Cação-ferro Sharpnose shark Rhizoprionodon spp. 2 1.0 129 9.7 3 2.5 30 8.0 163 0.3 5.8 Cação-anjo Angel shark Squatina spp. 5 1.0 127 9.1 10 10.0 142 0.2 5.7 Raia-manteiga Stingray Dasyatis sp. 2 1.0 19 2.7 96 17.5 116 0.2 2.8
Raia-viola Guitarfish Rhinobatos sp. 7 2.1 36 17.5 43 0.1 2.3
Raia-viola Lesser guitarfish Zapteryx brevirostris 5 5.1 10 7.5 15 0.0 1.3
Raia-santa Shorttail fanskate Sympterygia spp. 6 12.5 6 0.0 0.8
Raia-borboleta Butterfly ray Gymnura altavela 5 1.0 1 2.5 6 0.0 0.3
Galha-preta Shark Carcharhinus sp. 3 1.2 3 0.0 0.6
18 434 162 55 0 0 0 0 670 1.1
Sirís Crabs Callinectes spp., Arenaeus sp. 57 23.2 3 4.8 4 7.5 34 100.0 1 20.0 98 0.2 8.3
Lagosta-sapateira Slipper lobster Scyllaridae 2 0.9 5 7.5 7 0.0 1.0
57 5 9 0 0 0 34 1 104 0.2
Lula Squid Loligo spp. 1299 54.5 3 2.0 48 100.0 1350 2.212.1
Polvo Octopuses Octopus vulgaris 5 8.1 1 0.3 1 2.5 1 1.0 14100.0 22 0.0 2.6
1305 1 1 0 3 48 0 14 1371 2.2
TOTAL CATCH (kg) 10793 8378 282 248 2063 48 34 20 21866 35.4
TRIPS 99 331 40 25 98 17 3 5 618
CPUE (Kg.trip-1
) 109 25 7 10 21 3 11 4 35
Categories composition:
*a - Sardinella brasiliensis, Cetengraulis edentulus, Pellona harrowerii and Harengula clupeola *b - Cynoscion jamaicensis, C. guatucupa and C. leiarchus
*c - Menticirrus americanus, M. litoralis and Paralonchurus brasiliensis *d - Netuma barba and Genidens genidens
*e - Sphyraena tome and S. guachancho
*f - Haemulon plumieri, Boridia grossidens and Orthopristis ruber *g - Callamus penna and Pagrus pagrus
-1
TOTAL Hook and
line Squid jigging Trap Spear fishing Scientific Names
TOTAL
Rede Alta Corvineira
Gill nets
TOTAL
TOTAL
Linguadeira Beach-seine
CRUSTACEANS
MOLLUSKS TOTAL
TELEOSTS
ELASMOBRANCHS Common Names
Fisheries Cluster Analysis
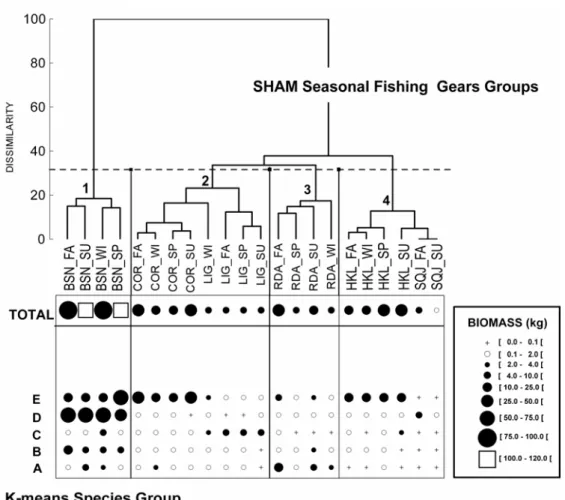
The Q-mode classification analysis of fisheries resulted in four sample groups reflecting the gear type as the primary factor of dissimilarity among groups. Group 1 was characterized by beach-seine catches and the whole group was well differentiated from the rest, attaining the maximum dissimilarity value. Causes of such differences may be attributed to the low specificity of the fisheries, not targeting any specific resource, and the highest diversity of the catch. Also, the beach-seine showed the highest average catch (Table 2, Fig. 2). Group 2 aggregated the “corvineira” and “linguadeira” gill net fisheries, reflecting similarities between bottom oriented fishing gears, despite their differences in mesh size, and consequent selectivity. Group 3 was formed by the “rede alta” fisheries, which concentrated catches on highly mobile pelagic fishes including sharks, mullets
(Mugil spp.), and bluefish (Pomatomus saltatrix) in
the summer. Group 4 clustered together the hook and line and the squid jigging fisheries. The squid jigging is highly selective and oriented exclusively for squids, with no by-catch in the fisheries. Also, the hook and line is quite selective and captures less species than the other fishing gears monitored. Therefore, the association of the squid jigging and hook and line in group 4 probably reflected the large number of absent species or null occurrences shared by both fisheries. The clustering of group 4 could be considered as a classification artifact, yet, it allowed the aggregation of the most selective fisheries, both focused on the capture of pelagic species (Table 2, Fig. 2).
The highest partition of the C-H index in the R-mode classification yielded two groups: one included croaker and largehead hairtail, and the other the remaining species. This classification is trivial and adds very little to the understanding of fisheries patterns. Therefore we considered the second highest partition of the C-H value, which resulted in 5 groups of species or species categories, which still kept the croaker and largehead hairtail as a separate group (Table 2, Fig. 2).
The five groups (A, B, C, D and E) showed distinct species composition and catches associated with the fishing gears used by each one of the fishing methods. For instance, group A included seven species or species categories often captured by the “rede alta” gill net, including sharks Rhyzoprionodon spp. and
Sphyrna spp., and bluefish as the most representative.
Group B comprised 39 elements, most of them caught exclusively in beach-seines, at catches between 5 - 10 kg.trip-1 (Table 2). Representative species were the clupeiform fishes and rough scad (Trachurus lathami). Group C, with 11 species, was less important in beach-seines but predominated in the “linguadeira” catches,
including larger individuals such as sting rays
(Dasyatis spp.) and angel sharks (Squatina spp.).
Group D, had 15 species and predominated in beach-seines. Species occurred almost exclusively in this fishing gear and included squids, mojarras, Brazilian sardine (Sardinella brasiliensis), blue runner, false herring (Harengula clupeola) and stripped weakfish
(Cynoscion guatucupa). Group E represented the two
most abundant and important species, croaker and largehead hairtail, in Itaipu. Both resources were not only abundant and frequent, but were also shared by most of the fisheries conducted in the area such as beach-seine, the hook and line, and nearly all of the gill net fisheries (Table 2, Fig. 2).
Production Estimates
The annual fisheries production, considering 200 effective fishing days was equal to 136687 kg (Table 3). The beach seine fishery accounted for approximately 53.1% of this total, followed by the “corvineira” (27.8%) and the hook and line (13.4%) fisheries. The production estimate of the other fisheries together added up to a total of 7651 kg which represented approximately 5.6% of the total estimated annual production.
Seasonal production estimates revealed a consistent pattern in which summer and fall were the most productive, and winter and spring the least productive periods. Summer alone accounted for 41.9% of the total annual production (Table 3, Fig. 3).
Beach-seine and hook and line showed production peaks in the summer, whereas peak production from the “corvineira” occurred in the fall slightly different from the summer production (Table 3). The production from “rede alta” peaked in the fall and was smallest in the spring, whereas the “linguadeira” peaked in the spring and was the smallest in the winter.
The squid jigging occurs only in the summer and fall following the target species seasonality. The sporadic occurrence and low frequency of the trap fishery and spear fishing, limit the possibilities to infer any seasonal pattern from these fishing modalities (Table 3).
DISCUSSION
Season fa su wi sp fa wi sp su wi fa sp su fa sp su wi fa wi sp su fa su
N = 28 24 19 28 105 98 79 49 11 10 15 4 3 8 2 12 23 28 25 22 6 11
A 0.5 0.1 3.3 1.5 0.0 0.1 0.2 2.1 0.3 1.9 1.3
A 0.1 0.4 0.8 0.1 0.1 0.3 9.0 0.4
A 0.0 2.8 0.1 0.1 0.2 0.2 0.4 0.2 0.5 0.1 4.8 0.0 0.0
A 6.2 0.1 0.0 0.0 0.5 0.5 0.1 0.3 0.1 0.1 0.3
A 0.5 1.0 5.0 0.6
A 0.1 0.1 0.1 0.3 0.1 0.4 0.2 0.2 0.3 0.3
A 0.0 0.0 0.1 0.1 0.4 0.1 0.3 0.3 0.3 0.1 0.0
0.6 9.2 3.4 1.6 1.2 2.2 0.9 1.7 0.6 0.3 0.4 17.5 1.4 7.2 2.4 0.0 0.0 0.3
B 2.7 4.4 0.0
B 3.8
B 1.1 1.8 0.0 0.0
B 1.2 1.5
B 0.0 2.6
B 1.8 0.0 0.1 0.1 0.0
B 1.0 0.0 0.1 0.2 0.8
B 1.8
B 1.1 0.0 0.2 0.1 0.0
B 0.0 0.2 0.9 0.0 0.2
B 0.8 0.5 0.1 0.0 0.0
B 0.1 0.0 0.1 0.0 0.3 0.7
B 0.0 0.8 0.0 0.0 0.1 0.0
B 0.0 0.0 0.0 0.0 0.0 0.0 0.0 0.0 0.0 0.8 0.0 0.0
B 0.2 0.1 0.5 0.0 0.1
B 0.2 0.7
B 0.8
B 0.2 0.0 0.1 0.4
B 0.1 0.0 0.3 0.0 0.0 0.3
B 0.6
B 0.4 0.2 0.1
B 0.0 0.0 0.0 0.0 0.6
B 0.2 0.2 0.0 0.0 0.0 0.1
B 0.0 0.0 0.0 0.3 0.1
B 0.1 0.1 0.3
B 0.0 0.4 0.0
B 0.4
B 0.1 0.1 0.0 0.0 0.0 0.1 0.1 0.0
B 0.1 0.1 0.1 0.0 0.1
B 0.1 0.1 0.1 0.0 0.1 0.0
B 0.0 0.0 0.3
B 0.0 0.2 0.0
B 0.2 0.1
B 0.2
B 0.0 0.0 0.1 0.1 0.0 0.0
B 0.0 0.0 0.2
B 0.1
B 0.0 0.1 0.0 0.0
B 0.0 0.0 0.1 0.0 0.0
12.0 9.7 5.1 6.1 0.4 0.3 0.2 1.1 0.7 0.8 0.2 0.1 0.3 1.1 2.2 1.5 0.3 0.2 0.5 0.0
C 0.1 0.1 0.1 0.3 1.2 4.0 5.3
C 0.1 0.0 1.1 0.5 0.1 0.3 0.2 0.1 0.1 2.3
C 0.0 3.4 0.2 0.1 0.1 0.2 0.1 0.0 0.6 0.1 0.0
C 0.2 0.1 0.1 0.1 0.2 0.1 0.1 0.1 0.8 1.2 1.1 0.2 0.2
C 3.6 0.2 0.1 0.0 0.0 0.1 0.1 0.1
C 0.0 0.0 0.1 0.2 2.4 0.6 0.3
C 0.0 1.5 0.2 0.6 0,0 0.0 0.0 0.1 0.3
C 0.2 0.5 0.2 0.7 0.2 0.2 0.5
C 0.2 0.0 0.4 0.8 0.0 0.0 0.0 0.1 0.1 0.1 0.0 0.1 0.0 0.1 0.0
C 0.1 0.2 0.2 0.8
C 0.1 0.1 0.2 0.2 0.1 0.1 0.1
0.6 1.7 9.0 1.8 1.7 0.9 1.4 0.9 2.1 6.1 6.4 5.7 0.8 0.1 0.1 0.1 0.1 2.3
D 14.4 23.1 1.2 11.4 0.0 1.3 0.1 4.2 2.0
D 14.0 17.9 1.1 7.8 0.1 0.0 0.0
D 2.3 12.4 3.4 2.3
D 1.5 5.6 11.1 0.0 0.0 0.0 0.1 0.1
D 8.4 4.4 3.7 0.2
D 5.4 3.5 5.7 0.0 0.0 0.0 0.1 0.2 0.1 1.3 0.2
D 65.0 5.1 2.8 1.9
D 0.0 0.5 8.7 2.2 0.0 0.1 0.0 0.0 0.1 0.0 0.0 0.1
D 1.8 0.6 8.1 0.3 0.0 0.4 0.1 0.1
D 0.4 1.8 5.7 0.8 0.0 0.0 0.0
D 3.4 2.5 0.4 0.0 0.0 0.0 0.0 0.4
D 0.0 1.8 1.9 2.3 0.0 0.0 0.0
D 0.5 0.0 0.3 1.5 0.1 0.7 0.0 0.1 0.2 1.0
D 1.0 1.0 0.1 0.9 0.0 0.0 0.0 0.0
D 0.0 0.1 0.1 0.1 0.0 0.0 0.0 0.0 0.7 0.1 0.0 0.0
57.6 72.3 50.9 43.2 0.3 0.9 0.1 0,0 0.1 0,0 1.3 0.3 0.9 0.2 1.9 1.4 0.2 0.2 0.1 4.2 2.0
E 4.5 3.6 16.8 53.5 0.3 0.8 0.7 0.8 0.5 0.1 0.1 0.1 2.3 1.3 15.7 15.2 23.8 23.5 E 12.3 19.2 4.5 11.4 25.8 14.1 15.6 32.1 1.5 0.6 0.5 0.2 9.1 1.3 0.5 0.4 0.0 0.7
16.8 22.8 21.3 64.9 26.2 14.9 16.3 32.9 2.0 0.7 0.6 0.2 9.1 1.4 2.3 1.8 16.1 15.2 24.6 23.5
87.5 115.6 89.6 117.5 29.8 19.1 18.7 36.6 5.6 7.9 7.6 7.3 27.9 4.8 11.8 7.7 17.9 15.6 25.6 25.9 4.2 2.0
Pomatomus saltatrix Cynoscion acoupa Mugil platanus Rhyzoprionodon spp.
Mycteroperca spp. Total SG A Sphyrna spp. Centropomus spp.
Umbrina coroides Herring Trachurus lathami Pellona harrowerii
Archosargus sp. Selar crumenophtalmus Cetengraulis edentulus Chilomocterus spinosus Upneus parvus Scomberomus brasiliensis Marine catfish Aluteros spp.
Mugil curema Scomberomorus spp. Lutjanus sp. Diplodus argenteus
Selene vomer Kyphosus sp. Anchoviella lepidentostole Urophicis brasiliensis
Caranx hippos Sarda sarda Sympterigia spp. Genidens genidens
Slipper lobster Epinephelus sp. Cynoscion jamaicensis Boridia grossidens
Astrocopus ygraecum Sphyraena sp. Cynoscion leiarchus Octopus vulgaris Diplectrum formosum Porichthis porosissimus Gymnura altavela Chaetodipterus faber Stephanolepis hispidus Total SG B Katswuomus pelamis Haemulon sp.
Netuma barba Linguados Dasyatis sp. Cynoscion spp.
Crabs Squatina sp. Peprilus paru Rhynobatos sp.
Epinephelus sp. Total SG C Ortopristes ruber Zapteryx brevirostris
Harengula clupeola Cynoscion guatucupa Loligo spp. Eucinostomus argenteus Mixed catch Selene setapinnis Sardinella brasiliensis Caranx crysos Chloroscombrus chrisurus Sphyraena tome Lagocephalus laevigatus Conodon nobilis Priacanthus arenatus Total SG D Trachinotus carolineus Dactylopterus volitans
Total SG E TOTAL Trichiurus lepturus Micropogonias furnieri Species/ Categories SG Squid jigging Hook and line
Corvineira Beach-seine
Table 2: Average catch (kg) of the 74 most important species or species categories recorded by fishing gear per season (fa - fall; su - summer; wi - winter; sp - spring). from April/2001 to March/2003 at Itaipu-RJ. SG - species group; FGG - fishing gear group. N - trips per fishing gear per season. 0.0 = values less than 0.1.
FGG 1 FGG 2 FGG 3 FGG 4
Fishing Gear Groups
Rede Alta Linguadeira
Fig. 2. Comparison among the grouping of the fishing gears for seasons (mode-Q) using analysis of grouping type SHAM and grouping of species (mode-R) using analysis of grouping type K-means. Fishing gears: BSN – beach-seine, COR – corvineira, LIG – linguadeira, RDA – rede alta, HKL – hook and line and SQJ – squid jigging. Seasons: FA – fall, SU – summer, SP – spring and WI – winter.
Table 3. Estimates of annual and seasonal fisheries production (kg), by fishing gear at Itaipu-RJ, Brazil. T = average number of trips per day; CPUE = kg.trips-1.
Seasons
T CPUE Daily Total T CPUE Daily Total T CPUE Daily Total T CPUE Daily Total
Beach-seine 4 96 384 20349 2 95 190 9143 2 121 243 11176 5 121 603 31966 72633
Corvineira 8 30 240 12729 8 20 159 7631 7 19 131 6038 6 37 220 11663 38060
Linguadeira 1 8 8 437 1 6 6 272 3 8 23 1060 2 7 15 772 2541
Rede alta 1 28 28 1487 1 8 8 404 1 5 5 226 1 12 12 632 2749
Hook and line 2 18 36 1909 1 16 16 750 4 26 102 4707 8 26 207 10977 18343
Trap 1 5 5 255 1 14 14 749 1005
Squid jigging 2 4 8 441 3 2 6 315 756
Spear fishing 1 4 4 173 1 5 5 207 1 4 4 220 600
Total 37 705 37352 26 388 18628 36 509 23414 47 1081 57293 136687
Total Days 91 92 92 90
Cold Fronts 25 31 33 25
Sundays, Holidays 13 14 13 12
Effective Fishing Days 53 48 46 53
Production Production Annual
Production
Fishing Gear Production
Spring Summer
Winter Production
0
10000
20000
30000
40000
50000
60000
Fall
Winter
Spring
Summer
Seasons
P
ro
duc
ti
on (kg
)
Fig. 3. Seasonal variation of estimated production (kg) of the fisheries in the coastal zone at Itaipu (RJ), from April/01 to March/03.
The classification analysis provided an important tool for identifying species groups associated with the different fishing modalities used in the area on a seasonal basis. Also, the classification suggests a strong association between the different fisheries and their catch. This partition is quite clear as we look at the three different gill net fisheries. The large diversity in the types of fishing gears and specific equipments used towards the exploitation of certain fish resources (e.g. “corvineira” - croaker; “linguadeira” - flounders and angel shark; and “rede alta” – pelagic sharks, mullets and bluefish) result in a multi-specific fisheries showing high overlap regarding the use of the most important fish resources such as the croaker, the largehead hairtail and squids.
The use of several fishing gears and the exploitation of different fishing areas amplify the access to resources, increasing total production. However, Kant de Lima & Pereira (1997) observed that in the early 60’s the introduction of the gill net fisheries raised conflicts with the traditional beach-seiners, which suggested that many of the migrating stocks would not come into the beach-seining area due to gill nets set offshore in neighboring waters. For instance, the mullet beach-seine fishery disappeared from the area in the mid 80’s, and fishers blamed it on the gill nets. Whether this hypothesis is true, still remains to be tested.
The estimated total annual production for the area represents approximately 0.7% of the Guanabara Bay fisheries production, following Jablonski et al. (2006), and 0.2% of the Rio de Janeiro total production in 2004 (0.8% from artisanal production) - (IBAMA, 2005). In spite of its small contribution, the fisheries production at Itaipu is locally significant, supplying restaurants and kiosks, but also attracting buyers from the Niterói fish market, when large catches are made or special resources are captured.
In spite of the low yields presented from “linguadeira”, “rede alta”, squid jigging, traps and spear fishing, their catches included flounders, guittarfish, mullets, squids, crabs, octopus and groupers, usually reaching high price in the local market, representing important alternative resources compared, for instance, with the beach-seine catches.
Magro (2005), indicated that, in spite of the lack of information about the artisanal and sport fishing, catches of largehead hairtail with hook and line are considerable in the State of Rio de Janeiro, and peak abundance in the spring and summer seems to be linked to recruitment periods (Bellini, 1980). Still, the harvest of this species appears to be resilient and conservative over time, as Kant de Lima & Pereira (1997) observed in the late 70’s, local fishers harvesting similar large catches in January.
The high squid yields in the fall and summer were associated with persistent and abundant spawning groups near the islands. A similar fact had been previously observed near the Arvoredo Island in the State of Santa Catarina (Perez et al., 1997). According to local fishers, the squid harvest occurs from December to February, associated with the occurrence of cold and clear waters near the coast (Lima & Pereira, 1997).
The clupeiform fishes constitute an exclusive fishing resource of the beach-seine. In spite of their low economic value, they represent a resource of interest, for instance, when the Brazilian sardine occurs in great volumes. The production peak in the fall, matches the highest frequency of sardine schools in coastal waters of Rio de Janeiro State, after reproduction (Paiva & Motta, 2000).
ACKNOWLEDGMENTS
We thank the fishers of Itaipu for their collaboration in obtaining the fishing data. Special thanks to Mr. Aurelino Mattos de Souza (Mestre Cambuci) for sharing his ideas and insights about his lifelong experience as a local fisher. Thanks also to everyone at NUFEP, Núcleo Fluminense de Estudos e Pesquisas and Department of Anthropology at UFF. Financial support came from the Ministry of Science and Technology (PADCT-MCT), Fundação Carlos Chagas de Amparo à Pesquisa – FAPERJ. CAPES and CNPq provided fellowships at different levels for the authors and students involved in the project. Finally we thank the students at the Necton Biology and Fisheries Ecology Laboratory, specially our technician Davilma Antonio Borges for her unconditional help on many of the less glamorous tasks of a fisheries lab; Laís de Carvalho Chaves, Tarsila Ferreira Seara and Kathlyn Erin Levasseaur who helped in the translation of the manuscript.
REFERENCES
BEGOSSI, A. The use of optimal foraging theory to understand fishing strategies: a case from Sepetiba Bay (State of Rio de Janeiro, Brazil). Hum. Ecol., v. 20, p. 463-475, 1992.
BEGOSSI, A. Temporal stability in fishing spots: conservation and co-management in Brazilian artisanal coastal fisheries. Ecology and Society, v. 11, n. 1, p. 5., 2006 Disponível em: <http://www.ecologyandsociety.org>. Acesso em:05 Jun. 2006.
BERKES, F. et al. Managing small-scale fisheries. Alternative directions and methods. Ottawa: IDRC, 2001. 320 p.
CALINSKI, T.; HARABASZ, J. A dendrite method for cluster analysis. Commun. Stat., v. 3, p. 1–27, 1974. CARVALHO-FILHO, A. Peixes: costa brasileira. São Paulo:
Melro, 1999. 320 p.
CASTRO-FILHO, B. M.; MIRANDA, L. B.; MIYAO, S. Y. Condições hidrobiológicas na plataforma continental ao largo de Ubatuba: variações sazonais e de média escala. Bolm Inst. Oceanogr., S.Paulo, v. 35, n. 2, p. 135-151, 1987.
COSTA, P. A .S.; HAIMOVICI, M. A pesca de lulas e polvos no litoral do Rio de Janeiro. Ciência Cult., S Paulo, v. 42, n. 12, p. 1124-1130, 1990.
DIEGUES, A. C. Human populations and coastal wetlands: conservation and management in Brazil. Ocean coast. Mgmt., v.42, p. 187-210, 1999.
FAO. Integrated Coastal Area Management and Agriculture, Forestry, and Fisheries. Rome: Food and Agriculture Organization of the United Nations, 1998. 183 p.
FIGUEIREDO, J. L. Manual de peixes marinhos do sudeste do Brasil. I. Introdução: cações, raias e quimeras. São Paulo: Museu de Zoologia da Universidade de São Paulo, 1977. 104 p.
FIGUEIREDO, J. L.; MENEZES, N. A. Manual de peixes marinhos do sudeste do Brasil. II. Teleostei (1). São Paulo: Museu de Zoologia da Universidade de São Paulo, 1978. 110 p.
FIGUEIREDO, J. L.; MENEZES, N. A. Manual de peixes marinhos do sudeste do Brasil. III. Teleostei (2). São Paulo: Museu de Zoologia da Universidade de São Paulo, 1980. 90 p.
IBAMA. Estatística da pesca - Brasil - Grandes regiões e unidades da federação. Brasília: Ministério do Meio Ambiente - Instituto Brasileiro do Meio Ambiente e dos Recursos Naturais Renováveis, 2005. 138 p. 2004. JABLONSKI, S.; SILVA, C. E. M. Inventário da Pesca no
estado do Rio de Janeiro. Rio de Janeiro: Departamento de Oceanografia – UERJ, 1996. 200 p.
JABLONSKI, S.; AZEVEDO, A. F.; MOREIRA, L. H. A. Fisheries and conflicts in Guanabara Bay, Rio de Janeiro, Brazil. Braz Arch. Biol. Tech., v. 49, n. 1, p. :79-91, 2006.
LIMA, R. K. DE; PEREIRA, L. F. Pescadores de Itaipu: meio ambiente, conflito e ritual no litoral do Estado do Rio de Janeiro. Niterói, RJ: [s.n.], 1997. 331 p.
LEGENDRE, P. Program K-means User’s Guide. Pierre
LEGENDRE, P. et al. Acoustic seabed classification:
improved statistical method. Can. J. Fish. aquact. Sci.,
v. 59, p. 1085-1089, 2002.
LEGENDRE, P.; LEGENDRE, L. Numerical Ecology. 2.
ed. Amsterdam: Elsevier, 1998. 853 p.
MAGRO, M.; CERGOLE, M. C.;
ROSSI-WONGTSHOWSKI, C. L. D. B. Síntese de
conhecimento dos principais recursos pesqueiros costeiros potencialmente explotáveis na costa
sudeste-sul do Brasil: Peixes. Avaliação do potencial sustentável
de recursos vivos na zona econômica exclusiva – REVIZEE. Rio de Janeiro: Grafline, 2000. 143 p.
MENEZES, N. A.; FIGUEIREDO, J. L. Manual de peixes
marinhos do sudeste do Brasil. IV. Teleostei (3). São
Paulo: Museu de Zoologia da Universidade de São Paulo, 1980. 96 p.
MENEZES, N. A.; FIGUEIREDO, J. L. Manual de peixes
marinhos do sudeste do Brasil. V. Teleostei (4). São
Paulo: Museu de Zoologia da Universidade de São Paulo, 1985. 105 p.
MENEZES, N. A.; FIGUEIREDO, J. L. Manual de peixes
marinhos do sudeste do Brasil. V Teleostei (5). São
Paulo: Museu de Zoologia da Universidade de São Paulo, 2000. 90 p.
MILLIGAN, G. W.; COOPER, M. C. A study of
standardization of variables in cluster analysis. J.
Classific, v. 5, p. 181-204, 1988.
MILLIGAN, G. W.; COOPER, M. C. Methodological
review: clustering methods. Appl. Psychol. Meas., v. 11,
p. 329-354, 1987.
NELSON, J. S. Fishes of the World. 3. ed. New Jersey: John
Wiley, 1994. 599 p.
NEHRER, R.; BEGOSSI, A. Fishing at Copacabana (Rio de Janeiro): local strategies in a global city. Ciencia Cult., S Paulo, v. 52, n. 1, p. 26-30, 2000.
PAIVA, M. P.; MOTTA P. C. S. Cardumes da
sardinha-verdadeira, Sardinella brasiliensis (Steindachner), em
águas costeiras do estado do Rio de Janeiro, Brasil.
Revta bras. Zool., v. 17, n 2, p. 339-346, 2000.
PEREZ, J. A. A. Biomass dynamics of the squid Loligo plei
and the development of a small-scale seasonal fishery off southern Brazil. Bull. mar. Sci., v. 71, n. 2, p. 633-651, 2002.
PEREZ, J. A. A. et al. A pesca de lulas na Ilha do Arvoredo:
Características e relações ecológicas. Verão de 1996.
Notas Técnicas da Facimar, Itajaí, SC, v. 1, p. 9-21,
1997.
PEREZ, J. A. A.; PEZZUTO, P. R. Valuable shellfish species in the by-catch of shrimp fishery in southern Brazil: spatial and temporal patterns. J. Shellfish Res., v. 17, n. 1, p. 303-309, 1998.
REIS, E. G. Classificação das atividades pesqueiras na costa do Rio Grande do Sul e qualidade das estatísticas de
desembarque. Atlântica, Rio Grande, v. 15, p. 107-114,
1993.
ROSSI-WONGTSCHOWSKI, C. L. D. B.; PAES, E. T. Padrões espaciais e temporais da comunidade de peixes demersais do Litoral norte do estado de São Paulo,
Ubatuba, Brasil. Publ. Esp. Inst. Oceanogr. USP, n. 10,
p. 169-186, 1993.
SACCARDO, S. A.; ROSSI-WONGTSCHOWSKI, C. L. D. B. Biologia e avaliação do estoque da sardinha Sardinella brasiliensis: uma compilação. Atlântica, Rio Grande. v. 13, n. 1, p. 29-43, 1991.
SHEPHERD, G. J. Fitopac 1. Manual do Usuário. Campinas,
SP: Depto. de Botânica, IB, UNICAMP, 1995. 17 p. Smith, I. R. A research framework for traditional fisheries.
ICLARM Stud. Rev., n. 2, 45 p, 1979.
VAZZOLER, A. E. A. de M.; SOARES, L. S. H.; CUNNINGHAM, P. T. M. Ictiologia da costa brasileira.
In: LOWE-MCCONNEL, R. H. (Ed.). Estudos
Ecológicos de comunidades de peixes tropicais. São
Paulo: Editora Universidade de São Paulo, 1999. p. 424-468.
VAZZOLER, A. E. A. de M. Síntese do conhecimento sobre
a biologia da corvina Micropogonias furnieri
(Desmarest, 1823), da costa do Brasil. Atlântica, Rio
Grande, v. 13, n. 1, p. 55-74, 1991.
Sources of Unpublhished Material
BELLINI, A. T. Biologia e bionomia de Trichiurus lepturus (Linneus, 1758) (Trichiuridae; Perciformes; Teleostei), da costa brasileira, entre Cabo Frio (23°00 S) e Torres (29°21 S). 1980. 97p. Dissertação (Mestrado) - Instituto Oceanográfico, USP, São Paulo.