Article
Printed in Brazil - ©2017 Sociedade Brasileira de Química0103 - 5053 $6.00+0.00
*e-mail: [email protected]
Impact of HNO
3Solution Treatment of South Brazil Coal Matrices on Their
Chemical Composition and Humic Acids Yield
Deborah P. Dick,*,a Janaina B. da Costa,a Anderson José B. Leitea and
Eduardo A. Brocchib
aInstituto de Química, Universidade Federal do Rio Grande of Sul (UFRGS),
91501-970 Porto Alegre-RS, Brazil
bDepartamento de Engenharia Química e de Materiais,
Pontifícia Universidade Católica do Rio de Janeiro (PUC-Rio), 22451-900 Rio de Janeiro-RJ, Brazil
In this study, changes on the chemical composition and on the humic acids yield of coal matrices promoted by 25% HNO3 treatment were investigated, by means of elemental, thermogravimetric analyses, and Fourier transform infrared spectroscopy (FTIR). The “run of mine” (ROM) matrix C-MTR (ROM coal) showed the highest C content (41%), highest C/N ratio (76) and lowest ash content (54%) of the studied samples. In contrast, coal tailings presented a higher degree of aromaticity. Treatment with HNO3 solution increased N content, but not that of C. Therefore, the C/N ratio of all samples decreased to values between 11 and 20. The insertion of N occurred in the aromatic structures, while the oxidation occurred in both the aromatic and aliphatic chains. HNO3 treatment increased the humic substances content and the largest increase being observed in the coal tailings (16 to 31% increment in comparison to the untreated sample). The generated humic acids showed in general a chemical composition similar to that of soil humic acids, but a greater aromaticity degree.
Keywords: humic substances, coal oxidation, FTIR spectroscopy, TGA
Introduction
Coal deposits in South Brazil represent about 90% of the national coal resources, but its use as a fuel source or in the metallurgical industry is highly restricted due to its low rank and high ash content.1 In Brazil, about 75% of
the mined material is discarded after beneficiation process. The great amount of produced coal tailing is usually stored in open piles and a strong acidification of the surrounding environment is observed due to the formation of acid mine drainage.2,3
A sustainable fate for this coal residue is the production of humic substances (HS) that, besides being a source of C and N to microorganisms and plants, plays an important role in chemical and physical properties of the soil.4
Environmental benefits of HS are mainly related to their high complexing capacity for metal ions that results from the oxygen-containing functional groups present in their structure associated to their high specific surface.5,6
The use of oxidative chemical methods for increasing the yield of humic acids (HA) of coal and similar carbonaceous samples is well known and it is widely reported in the scientific literature since 1930.7-10 However, systematic
studies that investigate the effects of these methods in the chemical composition of both the bulk coal sample and of their HS are less frequent. Usually, spectroscopic and chemical characterization is focused on the coal HA since the purification of this fraction is easily attainable.10-12 The
difficulty in analyzing the chemical composition of the organic fraction of coal matrices arises from the presence of inorganic components. To overcome the interference of the inorganic matrix in the spectroscopic, thermic, pyrolitic and chemical analyses, the treatment with diluted hydrofluoric acid (HF) solution has been used in soil samples in order to concentrate carbon and remove paramagnetic compounds.13,14 According to Rumpel et al.,14 no major
alteration of the chemical composition of soil organic matter, as assessed by 13C nuclear magnetic resonance
Oxidation of carbonaceous matrices employing nitric acid solution with different concentrations (5 to 25%) has been used with both fossil coal and biochar.11,15
Fong et al.11 tested three different reagents (HNO 3, H2O2
and KMnO4) for the oxidation of low rank coal samples
from Indonesia. The obtained HA from the different methods were compared in light of their gravimetric yields and chemical characteristics determined by spectroscopic techniques. The oxidized coal with 10% HNO3 solution
produced a higher HA yield which showed a greater
exchangeable acidity (−COOH and OH-phenolic)
when compared to HA from samples treated by other
methods.Besides increasing the oxygen-containing
groups in the coal structure due to the oxidation of alkyl groups,11 it is proposed that the treatment with nitric acid
promotes the carboxylic and nitro substitution on the aromatic ring.16
Considering the high waste generation from coal mining activity in Southern Brazil, the development of strategies for a sustainable destination for these wastes is interesting from both economic and ecological points of view. The residues remaining after coal beneficiation for energetic purposes may still contain a reasonable amount of organic fraction that is susceptible of oxidation, and thus capable to generate HS. In this context, the main purpose of this work was to evaluate the potential of coal tailing samples from South Brazil to produce HS, after treating the samples with HNO3 solution, and to investigate
the resulting chemical composition alterations. Besides the HA yield determination, the chemical composition of four coal samples and of the extracted HA were investigated before and after treatment with HNO3 solution
by means of elemental analyses, thermogravimetric and FTIR spectroscopy. Three samples of coal tailings from representative mines from Santa Catarina State were studied and, for comparison purposes, one sample of “run of mine” (ROM) was also included in the study.
Experimental
Coal matrices
The studied samples belong to the Paraná Basin, a large sedimentary basin situated in central eastern South America, including parts of Brazil, Argentina, Paraguay and Uruguay.17 Four coal matrices were collected in a
mining region in Santa Catarina State and consisted of: a ROM coal and its tailing sample (C-MTR and R-MTR, respectively) from the “Bonito” layer in Criciúma County (28º40’S, 49°28’W); a pyrite-rich coal tailing from the “Barro Branco” layer (R-FOR) (Forquilinha County,
28°44’S, 49°28’W) and a coal tailing sample (RBC) from the “Bonito” layer located in Treviso County (28°30’S, 49°27’W). All samples were air dried, ground in an agate mortar and dried at 60 °C for 12 hours.
Treatment with HNO3 solution
Samples were treated with 25% HNO3 solution
according to Trompowsky et al.15 The experimental
procedure was conducted on a system under reflux of the Soxhlet type. In 500 mL flask, 2.0 g sample and 100 mL of HNO3 solution were added. The system was kept under
reflux for 4 hours at a temperature of 60 °C. Next, the flask containing the acid solution was left to stand overnight for cooling and sedimentation of the samples. The supernatant was separated by centrifugation and the acid extract was collected and its volume measured. The solid sample was washed three times with distilled water and transferred to a pre-weighed beaker and dried in an oven at 60 °C. After drying, the sample was cooled in a desiccator. The yield of the nitration was calculated gravimetrically. In order to reduce nitric acid wastes, the same procedure was performed with a 11% HNO3 solution following the
recommendation of Fong et al.11 However, the yield using
11% HNO3 solutionwas always lower than that obtained
with 25% HNO3 solution and therefore the results obtained
with the less concentrated solution will not be presented and discussed.
Sample demineralization with 10% HF solution
Prior to thermogravimetric and FTIR analysis, the coal matrices (HNO3 untreated and HNO3 treated) were
demineralized with 10% HF solution to remove the inorganic components and concentrate the organic matter.13
Using a plastic container, coal matrices (10 g) were treated with 30 mL of a 10% (m/m) HF solution. After 2 h of mechanical agitation with subsequent centrifugation (1529 × g, 10 min), the supernatant was removed and discarded. This procedure was repeated six times. The remaining sample was washed five times with deionized water and dried at 60 °C in a vacuum oven.
Elemental analysis, infrared spectroscopy, and thermogravimetric analysis
The elemental composition (C, H, N) of the bulk and of the HF treated coal matrices (HNO3 untreated and HNO3
content was determined gravimetrically after heating the sample at 750 °C for 4 h.
Chemical characterization by elemental analysis was performed on the coal matrices (HNO3 untreated and
HNO3 treated; bulk and HF treated). Fourier transform
infrared spectroscopy analysis (FTIR) was performed on a Shimadzu FTIR 8300 in KBr pellets (1 mg sample: 100 mg KBr) employing 32 scans and 4 cm-1 resolution,
at a spectra range between 4000 and 400 cm-1. Attribution
of absorption bands followed Tan18 and Farmer19 and
the aromaticity index (I1630/I2920)20 was calculated. The
relative intensities (RI) of the main absorption bands were calculated according to Gerzabek et al.,21 by dividing the
corrected intensity of a given peak (e.g., approximately
2920, 1720, 1630, 1540, 1080 cm-1) by the sum of
the intensities of selected bands multiplied by 100%. The limits (cm-1) for determining the base line of each
band were established as follows: (base1/peak/base2) = 3100/2920/2800; 1800/1720/1700; 1700/1630/1500; 1600/1540/1490; 1200/1080/900.21
Thermogravimetric (TGA) analyses of 10% HF treated samples (HNO3 untreated and HNO3 treated) were carried
out with a thermo-gravimetric analyzer (TGA Q5000IR-TA instruments) using 10 mg of sample. Firstly, the initial weight was stabilized at 45 °C, and the heating curve was obtained with a heating rate of 20 °C min−1 up to 105 °C
(holding time of 5 min), followed by a heating rate of 10 °C min−1 up to 1000 °C.22 Thermo-decomposition curves
were divided into five main regions of temperature, whose limits varied among the samples. Two thermogravimetric index (TGI) were calculated from the thermo-decomposition curve (see Results and Discussion section).
Extraction and quantification of humic substances (HS)
Extraction of HS was performed in the coal matrices (both HNO3 untreated and HNO3 treated) according
to Swift,23 and quantified based on Dick et al.24 Thirty
milliliters of 0.5 mol L-1 NaOH were added to 1 g of
sample, and the suspension was stirred for 3 h. The alkaline extract was separated by centrifugation (1529 × g, 10 min) and stored in a polyethylene flask. This procedure was repeated until the extract became colorless (total of 6 extractions). The final volume of alkaline extract was measured, and an aliquot (5 mL) was separated for HS quantification. The alkaline solution was acidified to pH 2.0 using 4.0 mol L-1 HCl and, after standing 24 h,
it was centrifuged to separate the supernatant FA, from HA (pellet). The final volume of the FA extract was measured. C concentration in the soluble HS (CHS) and
FA (CFA) extracts was determined by the absorbance at
580 nm (Shimadzu UV-160 A) following oxidation with K dichromate in an acid medium at 60 °C for 4 h. The HA concentration (CHA) was calculated as follows:
CHA = CHS− CFA (1)
Determination of humic acids yield and chemical composition
HA were extracted from the coal matrices C-MTR,
R-MTR, R-FOR and RBC, both HNO3 untreated and
nitrated. After separation of the FA, HA were purified with 5%/5% HCl/HF solution for 2 h under mechanical shaking (three times).24 The purified HA were washed three times
with distilled water, frozen overnight, and dried at 60 °C in vacuum oven. The dried samples were maintained in a desiccator with silica gel for further analysis. Purified HA were characterized by elemental analysis and infrared spectroscopy (FTIR).
Results and Discussion
Elemental composition and ash content of coal matrices
C-MTR sample, (ROM coal) contained 41% C and 0.55% N (Table 1). These results, associated with the high ash content (Table 1), characterize a low rank coal as it was expected for the coal basin of the Santa Catarina State.1 The
C content of the three coal tailings varied between 6.8 and 16.2% and that of N between 0.16 and 0.29% (Table 1).
R-MTR sample showed lower levels of C and N and higher ash content than its respective ROM coal, C-MTR (Table 1). The beneficiation process of coal separates the fraction with higher calorific power (higher C content) from that with lower C content, and therefore these results were expected.
In general, the contents of N were consistent with those commonly observed in Southern Brazil coals.1 C/N values
varied between 42 and 76%, which is coherent for N-depleted samples. However, the coal tailings presented the lowest C/N values and it seems that the beneficiation of coal promotes a relative enrichment in the N-containing structures.
After treatment with 10% HF solution, all samples showed higher contents of C, H and N, indicating that the inorganic components were partially removed and consequently the organic fraction was enriched. The decrease of the ash content after 10% HF confirmed the solubilization of the mineral fraction (Table 1). For C-MTRHF and R-MTRHF samples, ash content decreased
to 13 and 18%, respectively, while in the R-FORHF and
RBCHF samples the ash content was still relatively high
the dissolution of the inorganic fraction can be associated to the mineral heterogeneity of the studied samples, which was not investigated in our study.
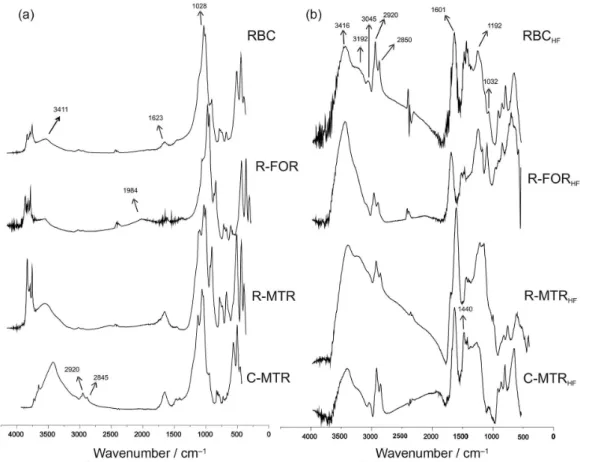
Infrared spectroscopy of coal matrices before and after treatment with 10% HF solution
The most important features of the FTIR spectra of the coal matrices (Figure 1a)are: (i) three bands between 3709-3690 cm-1 due to O
−H stretching of Al−OH and
Si−OH groups; (ii) a band at 3411 cm-1 due to O
−H
stretching; (iii) a couple of peaks at 2920 and 2845 cm-1
due to aliphatic C−H stretching; (iv) a band at 1623 cm-1
attributed to angular deformation of hydration water; (v) a prominent band at 1028 cm-1 attributed to Si
−O stretching;
(vi) a couple of bands at 560 and 472 cm-1 attributed to Fe
−O
stretching of Fe2O3.For sample C-MTR, which displays the
greatest C content, the bands of the inorganic groups were comparatively less intense than other matrices spectra, in comparison to those of the organic groups (Figure 1a).
After treatment with 10% HF solution, bands corresponding to the minerals at 3709-3690 cm-1 and
1623 cm-1 decreased, thus enabling the identification of
organic functional groups (Figure 1b). In Figure 1b, the main identified bands and their assignments were: a peak at 3416 cm-1 due to OH groups; bands at 3192-3045 cm-1
attributed to stretching of the aromatic C−H groups; bands at 2920-2850 cm-1 due to the C
−H stretching of aliphatic;
band at 1601 cm-1 due to the stretching of C=C of aromatics;
band at 1440 cm-1 due to C
−H deformation of aliphatic;
peak at 1032 cm-1 assigned to the stretching of the mineral
fraction of Si−O.
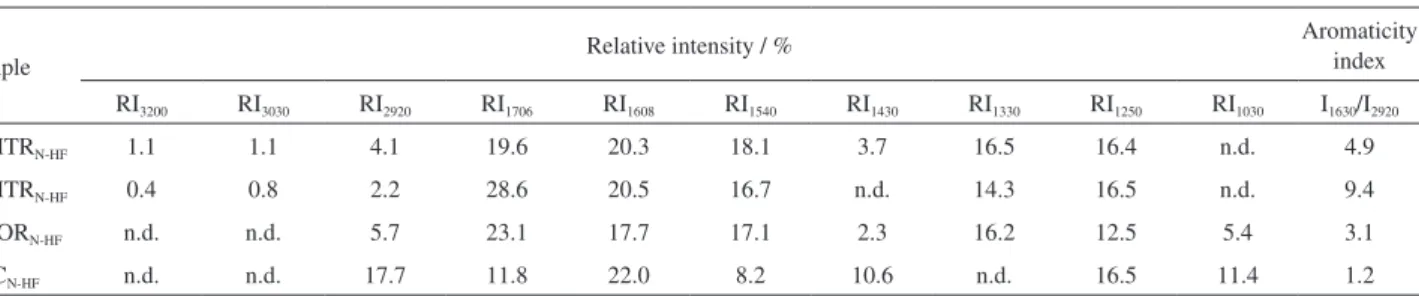
C-MTRHF sample showed higher values for RI2920 and
RI1430 and lower ones for RI3200 and RI1608 than R-MTRHF
sample (Table 2), indicating that the ROM coal sample has comparatively higher proportion of aliphatic groups than the respective coal tailing. Enrichment of aromatic
groups in the coal tailing after beneficiation of ROM coal is confirmed by the higher value of I1630/I2920 presented by
R-MTRHF sample. R-FORHF and RBCHF samples showed
values of relative intensities and of I1630/I2920 similar
to R-MTRHF (Table 2), suggesting a similar chemical
composition among the studied tailings.
Thermal behavior of coal matrices treated with 10% HF solution
Thermal decomposition behavior of the studied matrices treated with 10% HF solution was relatively similar. The
Table 1. Elemental composition, C/N ratio and H/C atomic ratio of coal matrices C-MTR, R-MTR, R-FOR and RBC before and after treatment with 10% HF solution
Sample C / % N / % H / % C/N H/C Ash / %
C-MTR 41.20 ± 0.09a 0.55 ± 0.08 2.05 ± 0.37 75 ± 1.1 0.60 ± 0.11 54
R-MTR 16.21 ± 0.88 0.29 ± 0.01 1.52 ± 0.01 56 ± 0.3 1.12 ± 0.07 62
R-FOR 6.75 ± 0.34 0.16 ± 0.01 0.78 ± 0.04 42 ± 2.1 1.40 ± 0.07 78
RBC 11.74 ± 1.11 0.27 ± 0.06 1.00 ± 0.01 43 ± 0.6 1.02 ± 0.03 84
C-MTRHF 64.48 ± 7.46 1.19 ± 0.20 3.72 ± 0.18 54 ± 2.8 0.69 ± 0.05 18
R-MTRHF 62.12 ± 5.36 1.07 ± 0.08 3.73 ± 0.23 58 ± 0.4 0.72 ± 0.02 13
R-FORHF 25.80 ± 0.70 0.46 ± 0.03 1.34 ± 0.26 56 ± 0.7 0.62 ± 0.01 49
RBCHF 15.10 ± 0.40 0.36 ± 0.20 9.30 ± 0.30 42 ± 2.8 0.74 ± 0.00 46
amean (n = 2) ± standard deviation; HF: samples demineralized with 10% HF solution.
main temperature (T) regions of decomposition are described as follows. For T < 105 °C, the weight loss varied between 1.0 and 6.5% (data not shown), corresponding to the desorption of hydroscopic water from the organic matter.25 Mass loss in the temperature range 105 to 435 ºC
(∆m1) varied between 4.5 to 6.2%, and was assigned to the decomposition of more thermolabile structures, such as alkyl and O-alkyl structures, phenolic and carboxylic groups.25 In the second T range, 435 to 535 °C (
∆m2), the
weight loss varied between 4.6 and 13.7% corresponding to less thermolabile structures, such as aromatic structures. In the third T range, 535-800 °C (∆m3), the weight loss may be assigned to higher thermostable structures, including condensed aromatic structures.
An additional thermogravimetric analysis was performed up to 1000 °C. The weight loss in the region of 800 to 1000 °C (∆m4) (data not shown) corresponds to
the decomposition aromatic structures more complex than those decomposed in ∆m3 region.
The proportion of remaining mass for T > 800 °C was 70-82% and for all samples, it was higher than the value obtained for the respective ash content (Table 1). Remaining mass for T > 1000 °C ranged between 51 and 77% (Table 3) and it was also superior to the ash content. It is inferred therefore, that after being heated up to 1000 °C, all samples still contained organic fraction in its structure. This extremely
high thermal resistant fraction is probably composed of highly condensed structures that are typical for coal matrices.26
Thermogravimetric index [(TGI I), (∆m3 + ∆m2) / ∆m1],22
is usually employed in the study of soil organic matter and it refers to the thermal lability of the organic fraction up to T = 800 °C. In this study, a second index was also calculated, TGI II [(∆m4 + ∆m3 + ∆m2) / ∆m1] which includes the
decomposition up to 1000 °C. TGI I ranged from 2.63 to 5.04 and the highest value was found for the sample R-MTRHF
(Table 3). TGI II index was always superior to the TGI I and decreased in the same order as TGI I: RMTRHF > CMTRHF ~
RFORHF > RBCHF. According to our data, R-MTR contained
a greater proportion of thermostable structures in the region 30 to 1000 °C compared to the other samples. The proportion of highly thermostable organic structures (T > 1000 °C) can be estimated by the difference between the remaining mass at this temperature and the ash content. With exception of the R-FORHF sample, to which this difference was 7%, values
ranged from 32 to 44% (data not shown). Therefore, it is inferred that samples C-MTRHF, R-MTRHF and RBCHF have
around 33-44% of highly thermostable organic structures, and are therefore highly condensed. TGI I values obtained in this study are well above those usually observed for soil organic matter22 (0.30 to 1.50) and this fact is coherent with
the presence of more complex and condensed structures in the coal matrices in comparison to soil samples.27,28 Table 2. Relative intensities (RI) and aromaticity index for the coal matrices C-MTR, R-MTR, R-FOR and RBC treated with 10% HF solution
Sample Relative intensity / %
Aromaticity index
RI3200 RI2920 RI1706 RI1608 RI1540 RI1430 RI1250 RI1030 I1630/I2920
C-MTRHF 1.2 27.8 n.d. 34.6 n.d. 15.7 15.7 2.3 1.1
R-MTRHF 2.5 13.7 n.d. 48.4 n.d. 9.4 21.3 3.4 2.0
R-FORHF 2.5 13.5 n.d. 49.0 n.d. 9.5 21.9 3.0 2.2
RBCHF 2.1 18.6 n.d. 42.3 n.d. 17.7 13.7 3.3 2.0
n.d: not detected; HF: samples demineralized with 10% HF solution.
Table 3. Mass residue for T > 800 °C and for T > 1000 °C, and thermogravimetric indexes (TGI I and TGI II) of the HF-treated coal matrices C-MTR, R-MTR, R-FOR and RBC, before and after HNO3 treatment
Sample Residue (T > 800 °C) / % Residue (T > 1000 °C) / % TGI I TGI II
C-MTRHF 71 62 3.43 4.85
R-MTRHF 62 51 5.04 7.16
R-FORHF 65 56 3.05 4.32
RBCHF 83 78 2.63 3.71
C-MTRN-HF 49 49 1.77 2.27
R-MTRN-HF 41 41 4.54 5.48
R-FORN-HF 59 36 1.23 2.59
RBCN-HF 77 67 2.20 3.70
Yield of HNO3 treatment and elemental composition of nitrated coal matrices
Nitration yield with 25% HNO3 solution ranged
between 67 and 92% (Table 4). Two samples showed a decrease of C content after treatment (C-MTRN and
R-MTRN) while in the samples R-FORN and RBCN no
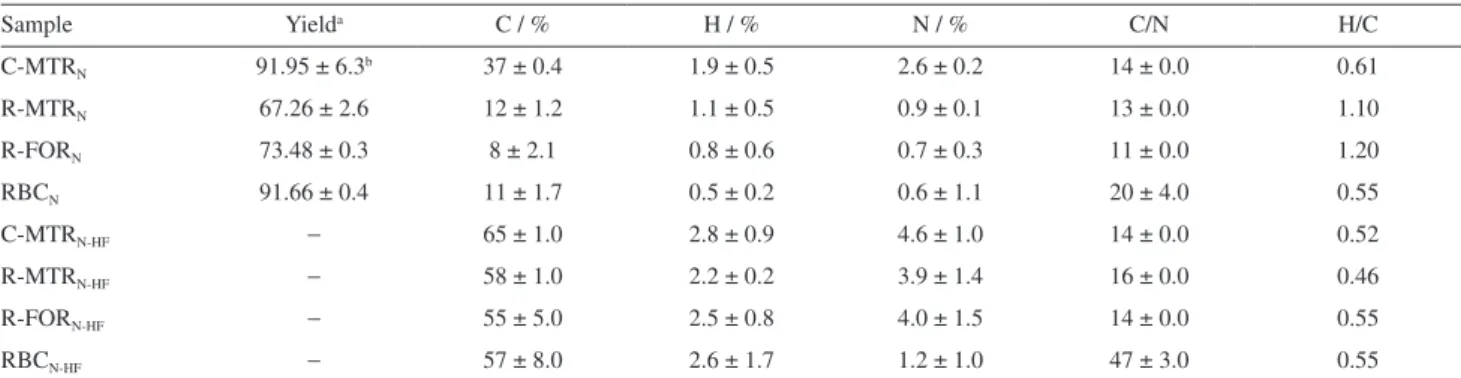
relevant change was observed (Tables 1 and 4). In all samples, an increase of N content occurred (Table 4) indicating the incorporation of N in the matrix structure. As a consequence, the C/N ratio decreased to values that ranged from 11 to 20 (Table 4). The treatment with 10% HF solution of the nitrated samples promoted an increase in the contents of C, H and N (Table 4), as it was observed previously with the HNO3 untreated samples
(Table 1).
H/C ratio of the demineralized nitrated samples ranged from 0.46 to 0.55 (Table 4). This result does not indicate an increase of aromatic condensation after HNO3 treatment
since this treatment does not promote this reaction. Considering that the concentration of N increased after the nitration, it is proposed that the inclusion of N in the structure occurs without the opening of the aromatic ring and thereby decreasing the H/C ratio.
Changes in chemical composition of coal matrices after
25% HNO3 treatment
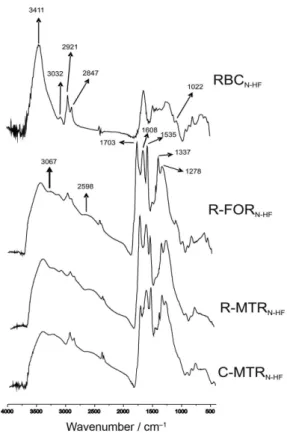
FTIR spectra of the HF-treated samples after HNO3
treatment enabled the identification of the major changes promoted by the nitration (Figure 2). The main difference between spectra from Figures 1b and 2 is the presence of carbonyl groups (1700 cm-1) and of the C
−N bonds
(1535 cm-1) in the latter.
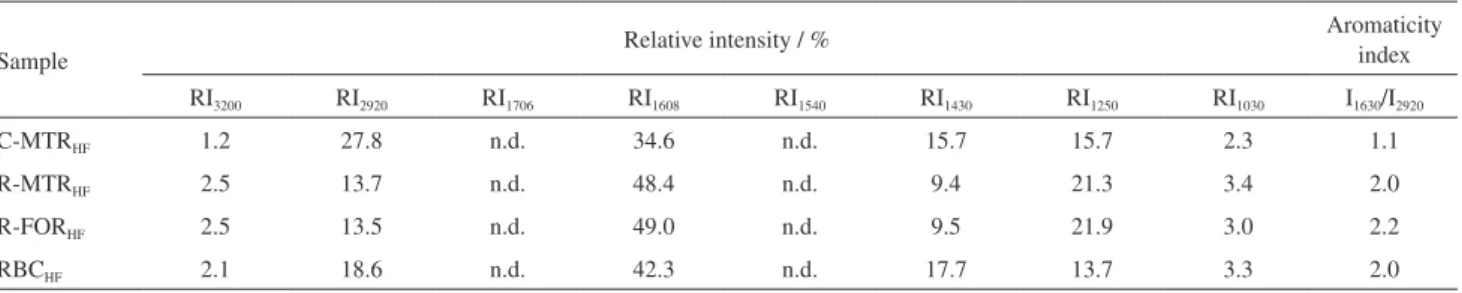
In comparison to the HNO3 untreated samples (Table 2),
the nitrated matrices show higher values for RI1706 and RI1540
(Table 5) confirming the functionalization and nitration of the structure. Also, I1630/I2920 index increases after reaction
with HNO3, although both values of RI2920 and RI1608
decrease after this treatment. These results confirm that both insertion of N and oxidation of sample occurred without breaking the aromatic ring.
The nitrated samples C-MTRN and R-MTRN showed
higher values for RI3200 and RI3045, and lower value of RI2920
than the other two samples (Table 5). These results, along with the highest I1630/I2920 index, suggest greater aromatic
condensation in the former, which is confirmed by the lower value of H/C of C-MTRN-HF and R-MTRN-HF compared to
R-FORN-HF and RBCN-HF samples.
RBCN-HF sample showed the lowest value of RI1540 of the
analyzed group indicating a low yield of N insertion in the structure, which is confirmed by the higher C/N presented by this sample (Table 4) after nitration.
Comparing the values of relative intensities from Tables 2 and 5, it follows that the value of RI3200 decreases
after nitration in all samples, indicating a decrease in the proportion of −C−H groups of aromatics. This result supports the hypothesis that the insertion of NO2 occurred
in the aromatic ring.
Thermal behavior of the samples treated with 25% HNO3
solution
Weight loss for T < 105 °C ranged between 1.7 to 7.9% (data not shown) indicating low humidity content in the samples. Thermal behavior of the nitrated samples differs from that of untreated samples in the temperature interval of 105-440 °C, where two regions were identified: 105-220 °C (∆m1 I) and 220-440 °C (∆m1 II). The occurrence of these two regions can be associated with the insertion of functional groups and/or oxidation of the structure, which increase the thermolability.
Table 4. Yield of HNO3 treatment of the bulk sample, elemental composition, C/N and H/C ratios of coal matrices C-MTR, R-MTR, R-FOR and RBC before and after treatment with 10% HF
Sample Yielda C / % H / % N / % C/N H/C
C-MTRN 91.95 ± 6.3b 37 ± 0.4 1.9 ± 0.5 2.6 ± 0.2 14 ± 0.0 0.61
R-MTRN 67.26 ± 2.6 12 ± 1.2 1.1 ± 0.5 0.9 ± 0.1 13 ± 0.0 1.10
R-FORN 73.48 ± 0.3 8 ± 2.1 0.8 ± 0.6 0.7 ± 0.3 11 ± 0.0 1.20
RBCN 91.66 ± 0.4 11 ± 1.7 0.5 ± 0.2 0.6 ± 1.1 20 ± 4.0 0.55
C-MTRN-HF − 65 ± 1.0 2.8 ± 0.9 4.6 ± 1.0 14 ± 0.0 0.52
R-MTRN-HF − 58 ± 1.0 2.2 ± 0.2 3.9 ± 1.4 16 ± 0.0 0.46
R-FORN-HF − 55 ± 5.0 2.5 ± 0.8 4.0 ± 1.5 14 ± 0.0 0.55
RBCN-HF − 57 ± 8.0 2.6 ± 1.7 1.2 ± 1.0 47 ± 3.0 0.55
ayield of treatment with 25% HNO
For the nitrated samples, TGI I values were lower
than those in the HNO3 untreated samples (Table 3),
confirming the increase of thermolability after treatment with nitric acid. This is further supported by TGI II values and consistent with the lower C/N value (Table 4) after treatment with 25% HNO3.
Proposal for reactions occurring during treatment with HNO3 solution
Concerning the chemical reactions that occurred during 25% HNO3 treatment our results can be summarized as
follow. After nitration, the H/C ratio decreases or remains constant, indicating that there was no rupture of the aromatic ring during the process. The value of RI2920 related
to the C−H aliphatic bond decreased (Tables 2 and 5), indicating that the proportion of these functional groups also decreases. On the other hand, the relative intensity of the carbonyl, RI1706, increases indicating that an oxidation
of structure occurred. Also the relative intensity of C−N
bond from NO2 group conjugated with the aromatic
ring (RI1540) increases and RI3200 decreases indicating the
insertion of N in the aromatic structure. Thermostability of
the samples decreases after treatment with HNO3 solution,
and that can be associated with the functionalization of the structure. Therefore, our findings are in agreement with the mechanism proposed by Fong et al.11 In that mechanism, the
presence of sulfuric acid is necessary as a reaction catalyzer. Our samples are pyrite (FeS2) rich,1 which in turn, when in
the presence of an oxidizing agent under heating, generates sulfuric acid, and thus acting as a catalyzer.2
Distribution of humic substances in coal matrices and characteristics of generated humic acid
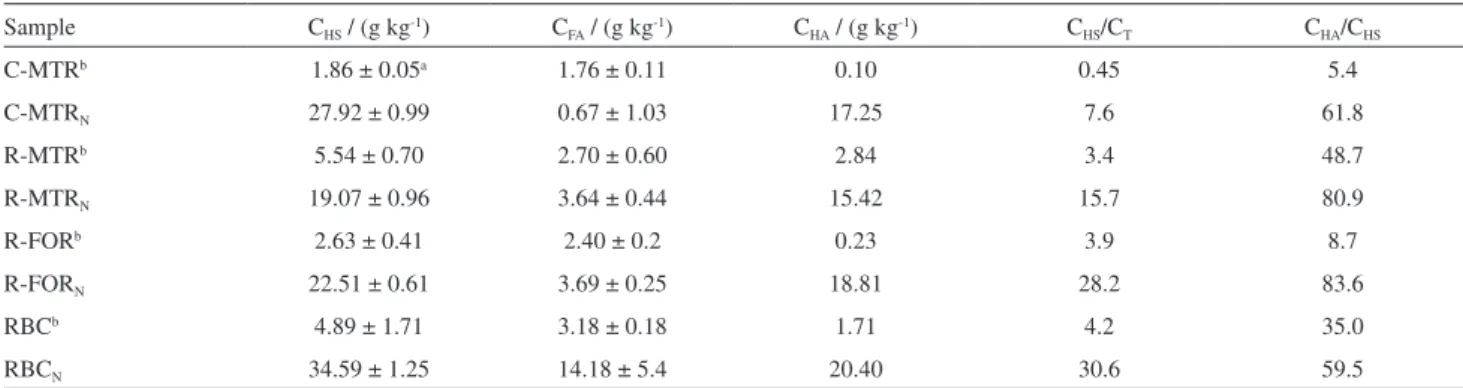
Humic substances content (CHS) of the HNO3 untreated
samples varied between 1.86 and 5.54 g kg-1 accounting
for 0.5 to 4.2% of the total carbon present in the sample (Table 6). These results are consistent with carbonaceous matrices where carbon is predominantly in the reduced form.29 In these samples, the C
HA levels were relatively low
and did not exceed the value of 2.8 g kg-1.
The coal tailing R-MTR showed higher levels of CHS and
a greater value for CHS/CT than the respective ROM coal. It
seems that the coal tailing resulting from the beneficiation process is a more oxidized fraction, in spite of its greater proportion of inorganic fraction in comparison to the ROM coal. This enrichment is mainly in the HA fraction, as the ratio CHA/CHS is greater in the three samples of coal tailings
compared to the ROM coal (Table 6).
CHS content increased after the nitration in all samples
and ranged from 19 to 34.6 g kg-1 (Table 6). C
HS/CT ratio
consequently increased, ranging between 7.6 and 31%. Although, showing the greatest HS enrichment after nitration, C-MTR sample showed the smallest CHS/CT
ratio, indicating greater resistance in generating humic substances after the reaction with HNO3. Increase in the
HS content after treatment with HNO3 was observed in
both FA and HA fractions. However, the HA enrichment was more pronounced in the HA fraction. The proportion CHA/CHS ranged from 5 to 48% in the original carbonaceous
samples, and after reaction with HNO3 these values passed
to values ranging from 62 to 84% (Table 6).
Figure 2. FTIR spectra of nitrated coal matrices C-MTR, R-MTR, R-FOR and RBC after 10% HF treatment.
Table 5. Relative intensities (RI) and aromaticity index of coal matrices C-MTRN-HF, R-MTRN-HF, R-FORN-HF and RBCN-HF
Sample Relative intensity / %
Aromaticity index
RI3200 RI3030 RI2920 RI1706 RI1608 RI1540 RI1430 RI1330 RI1250 RI1030 I1630/I2920
C-MTRN-HF 1.1 1.1 4.1 19.6 20.3 18.1 3.7 16.5 16.4 n.d. 4.9
R-MTRN-HF 0.4 0.8 2.2 28.6 20.5 16.7 n.d. 14.3 16.5 n.d. 9.4
R-FORN-HF n.d. n.d. 5.7 23.1 17.7 17.1 2.3 16.2 12.5 5.4 3.1
RBCN-HF n.d. n.d. 17.7 11.8 22.0 8.2 10.6 n.d. 16.5 11.4 1.2
Contents of C and N of the extracted HA after nitration were similar between samples, and ranged between 54.0 and 58.4% and 3.7 and 3.9%, respectively (Table 7). The C/N ratio ranged between 14 and 16. These values are consistent with the values usually observed for HA in soil.30,31
The FTIR spectra of HA extracted from the nitrated matrices showed, in general, the same pattern as the spectra of the nitrated coal samples (Figure 3). The main differences were: a shift of the band of C=O stretching from 1703 to 1713 cm-1 and of the band of C=C stretching from 1603 to
1613 cm-1. These shifts to higher wavenumbers suggest
the occurrence of less condensed functionalized aromatics group in the HA in comparison to the nitrated coal matrices. The presence of the band in 1526 cm-1 shows that during
treatment with 25% HNO3 solution, the incorporation of
NO2 in the coal structure occurred in the HA fraction as
already seen in other coals from Southern Brazil.31,32
The values of relative intensities of HA were, in general, similar between samples R-FOR and RBC (Table 8), indicating that after treatment with HNO3 solutiontheHA
of these samples showed a similar chemical composition. These results corroborate the C/N data (Table 7). HA C-MTRN showed lower values for RI1713 and RI1610 and
greater value of RI1526 than those of the HA R-MTRN
sample (Table 8). These findings together with the C/N values indicate that HA of coal tailing, which has a higher
proportion of aromatic groups, was more susceptible to oxidation, but incorporated less N than the HA of respective ROM coal. Additionally, the ratio I1630/I2920
was higher for HA R-MTR sample, following the same behavior observed for the organic fraction of the nitrated carbonaceous matrices (Table 5). The aromaticity index of HA (I1630/I2920) ranged from 6.5 to 15 and is greater than the
aromaticity index usually observed for soil HA.31
Conclusion
Nitration of the coal matrices resulted in an increase in nitrogen content, and promoted the oxidation of the coal structure, leading to its functionalization. Nitrogen insertion occurred mainly in the aromatic rings.
Treating carbonaceous matrices with 25% HNO3
solution under reflux for generating humic substances was satisfactory since it increased the proportion of extractable HS from 3 to 9 times.
Increase in the humic substances content after treatment with HNO3 was found mostly in the fraction of humic
acids (62 to 84%), into whose structure the nitro group was inserted. The generated humic acids showed, in general, similar chemical composition to HA of soils, but a greater degree of aromaticity.
Based on the higher yields obtained with the coal tailings, it is inferred that these residues, when nitrated, may represent a promising source for humic substances. The use of nitrated coal tailings as a soil fertilizer or conditioner should though be further investigated by bioassays.
Acknowledgments
The authors thank CNPq and FAPERJ for financial support and to Prof Ivo André Homrich Schneider (Engineering School, UFRGS) for the coal matrices supply.
Table 6. Content of C allocated in humic substances (CHS), in fulvic acids (CFA) and humic acids (CHA), proportion of CHS compared to C of the total sample (CHS/CT) and proportion of CHA of HS (CHA/CHS) in the HNO3 untreated and nitrated coal matrices C-MTR, R-MTR, R-FOR and RBC
Sample CHS / (g kg-1) C
FA / (g kg-1) CHA / (g kg-1) CHS/CT CHA/CHS
C-MTRb 1.86 ± 0.05a 1.76 ± 0.11 0.10 0.45 5.4
C-MTRN 27.92 ± 0.99 0.67 ± 1.03 17.25 7.6 61.8
R-MTRb 5.54 ± 0.70 2.70 ± 0.60 2.84 3.4 48.7
R-MTRN 19.07 ± 0.96 3.64 ± 0.44 15.42 15.7 80.9
R-FORb 2.63 ± 0.41 2.40 ± 0.2 0.23 3.9 8.7
R-FORN 22.51 ± 0.61 3.69 ± 0.25 18.81 28.2 83.6
RBCb 4.89 ± 1.71 3.18 ± 0.18 1.71 4.2 35.0
RBCN 34.59 ± 1.25 14.18 ± 5.4 20.40 30.6 59.5
aMean (n = 2) ± standard deviation; bHNO
3 untreated; N: HNO3 treated.
Table 7. Elemental composition of humic acids (HA) extracted from nitrated coal matrices C-MTR, R-MTR, R-FOR and RBC
Sample C / % N / % C/N
C-MTRN 56.8 3.94 14
R-MTRN 58.4 3.72 16
R-FORN 54.0 3.92 14
References
1. Kalkkreuth, W.; Holz, M.; Kern, M.; Machado, G.; Mexias, A.; Silva, M. B.; Willett, J.; Finkelman, R.; Burger, H.; Int. J. Coal Geol. 2006,68, 79.
2. Campos, M. L.; Almeida, J. A.; Silveira, C. B.; Gatiboni, L. C.; Albuquerque, J. A.; Mafra, A. L.; Miquelluti, D. J.; Filho, O. K.; Santos, J. C. P.; Rev. Ciênc. Agrovet.2010, 9, 198. 3. Machado, L. A.; Schneider, I. A. H.; Rev. Esc. Minas (Ouro
Preto, Braz.)2008,61, 329.
4. Clasen, H. A. C.; Lessa, R. T.; Kaemmerer, M.; Koetz, P. R.;
Rev. Bras. Agro.1998, 1, 35.
5. Canellas, L. P.; Santos, G. A.; Moraes, A. A.; Rumjanek, V. M.; Olivares, F. L.; Rev. Bras. Cienc. Solo2000, 24, 741. 6. Passos, R. R.; Ruiz, H. A.; Mendonça, E. S.; Cantarutti, R. B.;
Souza, A. P.; Rev. Bras. Cienc. Solo2007, 31, 1119.
7. Smith, R. C.; Howard, H. C.; J. Agric. Food Chem.1935, 57, 512.
8. Fuchs, W.; Polansky, T. S.; Sandhoff, A. G.; Ind. Eng. Chem. Res.1943, 35.
9. Angelo, L. C.; Mangrich, A. S.; Montovani, K. M.; Santos, S. S; J. Soils Sediments 2014, 14, 353.
10. Linhares, C. R.; Lemke, J.; Auccaise, R.; Duó, D. A.; Ziolli, R. L.; Kwalpinski, W.; Novotny, E. H.; Pesq. Agropec. Bras. 2012,
47, 693.
11. Fong, S. S.; Seng, L.; Majri, N. B.; Mat, H. B.; J. Braz. Chem. Soc.2007, 18, 34.
12. Araujo, J. R.; Archanjo, B. S.; Souza, K. R.; Kwalpinski, W.; Falcão, N. P. S.; Novotny, E. H.; Achete, C. A.; Biol. Fertil Soils
2014, 50, 1223.
Figure 3. FTIR spectra of HA extracted from the nitrated coal matrices C-MTR, R-MTR, R-FOR and RBC.
Table 8. Relative intensities and aromaticity index of HA in the nitrated coal matrices C-MTR, R-MTR, R-FOR and RBC
Sample Relative intensity / %
Aromaticity index
RI3070 RI2929 RI1713 RI1610 RI1526 RI1338 RI1248 RI1080 I1630/I2920
HA C-MTRN 0.7 2.1 29 21 18 13 13 n.d 10
HA R-MTRN 0.8 1.6 32 24 16 10 14 n.d 15
HA R-FORN 0.8 3.1 33 20 15 11 11 3.9 6.5
13. Gonçalves, C. N.; Dalmolin, R. S. D.; Dick, D. P.; Knicker, H.; Klamt, E.; Koegel-Knabner, I.; Geoderma2003, 116, 373. 14. Rumpel, C.; Rabia, N.; Derenne, S.; Quenea, K.; Eusterhues,
K.; Kögel-Knabner, I.; Mariotti, A.; Org. Geochem. 2006, 37, 1437.
15. Trompowsky, P. M.; Benites, V. M.; Madari, B. E.; Pimenta, A. S.; Hockaday, W. C.; Hatcher, P. G.; Org. Geochem.2005, 36, 1480.
16. Fong, S. S.; Seng, L.; Mat, H. B.; J. Braz. Chem. Soc.2007, 18, 41.
17. Milani, E. J.; Melo, J. H. G.; Souza, P. A.; Fernandes, L. A.; França, A. B.; Bol. Geoc. Petrobras2007, 15, 265.
18. Tan, K. H.; Humic Matter in Soil and the Environment: Principles and Controversies;Marcel Dekker: New York, USA, 2003.
19. Farmer, V. C.; Infrared Spectra of Minerals; Mineralogical Society: London, UK, 1974.
20. Chefetz, B.; Hatcher, P.; Hadar, Y.; Chen, Y.; J. Environ. Qual.
1996, 25, 776.
21. Gerzabek, M. H.; Antil, R. S.; Kögel-Knabner, I.; Knicker, H.; Kirchmann, H.; Haberhauer, G.; Eur. J. Soil Sci.2006, 57, 485. 22. Benites, V. M.; Mendonça, E. S.; Schaeffer, C. E. G. R.;
Novotny, E. H.; Reis, E. L.; Ker, J. C.; Geoderma2005, 127, 104.
23. Swift, R. S. In Methods of Soil Analysis Part 3-Chemical Methods; Spark D. L., ed.; SSSA and ASA: Madison, WI, 1996, p. 1001.
24. Dick, D. P.; Gomes, J.; Rosinha, P. B.; Rev. Bras. Cienc. Solo
1998, 22, 603.
25. Critter, S. A. M.; Airoldi, C.; J. Braz. Chem. Soc.2006, 17, 1250.
26. Silva, I. R.; Mendonça, E. S. In Fertilidade do Solo; Novais, R. F.; Alvarez, V. H.; Barros, N. F.; Fontes, R. L. F.; Cantarutti, R. B.; Neves, J. C. L., eds.;, SBCS: Viçosa, 2007, p. 275. 27. Speight, J. G.; Mineral Matter, Handbook of Coal Analysis;
John Wiley & Sons: New Jersey, USA, 2005.
28. White, C. M.; Smith, D. H.; Jones, K. L.; Goodman, A. L.; Jikich, S. A.; LaCount, R. B.; DuBose, S. B.; Ozdemir, E.; Morsi, B. I.; Schroeder, K. T.; Energy Fuels2005, 19, 659. 29. Miranda, C. C.; Canellas, L. P.; Nascimento, M. T.; Rev. Bras.
Cienc. Solo2007, 31, 905.
30. Schiavo, J. A.; Busato, J. G.; Martins, M. A.; Canellas, L. P.;
Sci. Agric.2009, 66, 353.
31. Dick, D. P.; Mangrich, A. S.; Menezes, S. M. C.; Pereira, B. F.;
J. Braz. Chem. Soc.2002, 13, 177.
32. Dias, B. O.; Silva, C. A.; Soares, E. M. B.; Bettiol, W.; Guerreiro, M. C.; Belizário, M. H.; Rev. Bras. Cienc. Solo. 2009, 33, 885.
Submitted: November 20, 2015 Published online: August 9, 2016