Article
J. Braz. Chem. Soc., Vol. 27, No. 3, 566-574, 2016. Printed in Brazil - ©2016 Sociedade Brasileira de Química 0103 - 5053 $6.00+0.00
A
*e-mail: [email protected]
Determination of Aspirin Using Chemiluminescence System of
Tris(1,10 phenanthroline)Ruthenium(II)-Cerium(IV)
Ali Mokhtari,*,a Mohsen Keyvanfard,b Iraj Emami,c Nastaran J. Delouei,d Hatameh F. Pishkhani,a Aida Ebrahimia and Hossein Karimiane
aDepartment of Science, Golestan University, 4913815739 Gorgan, I.R. Iran
bDepartment of Chemistry, Majlesi Branch, Islamic Azad University, 8631656451 Isfahan, I.R. Iran
cDepartment of Physics, Isfahan University of Technology, 8415644673 Isfahan, I.R. Iran
dDepartment of Chemistry, Payame Noor University, 3971189451 Behshahr, Iran
eDepartment of Engineering, Golestan University, 4913815739 Gorgan, I.R. Iran
A new chemiluminescence (CL) method has been proposed for the simple determination of aspirin (acetylsalicylic acid, ASA). The method is based on the enhancement effect of ASA in the CL reaction of tris(1,10 phenanthroline)ruthenium(II), Ru(phen)32+, with cerium(IV) (CeIV) in acidic medium. Under optimum conditions, the CL intensity was proportional to the concentration of the drug in solution over the range 0.72-72.00 µg mL−1 ASA. The limit of detection (S/N = 3) was 0.45 µg mL−1. In the method proposed, limit of detection was at least 30 times lower than the therapeutic concentration of ASA. The percent of relative standard deviation for determination of 10 replicates at level of 28.8 µg mL−1 of ASA was 5.8% and the minimum sampling rate was 30 samples per hour. Effects of some ingredients were investigated and the proposed method was
applied successfully for the determination of ASA in pharmaceutical formulations and plasma samples. A time resolve CL approach was used to reduce the effect of interferences from cysteine and ascorbic acid in plasma samples. The possible CL reaction mechanism was also discussed.
Keywords: chemiluminescence, tris(1,10 phenanthroline)ruthenium(II), aspirin, plasma, tablets
Introduction
Acetylsalicylic acid (ASA), commonly known as aspirin, is an analgesic, anti-inflammatory, and antipyretic drug and is one of the most widely used anionic drugs in the world.1 It is a member of a family of chemicals called salicylates. ASA has become a cornerstone of the therapy of cardiovascular disease, reducing the rate of adverse clinical events in high-risk patients by 25%.2 ASA irreversibly inhibits cyclooxygenase-1 activity in circulating platelets, and as a consequence, reduces the synthesis of thromboxane A2 (TXA2), a potent platelet activator.3,4 Its structure is shown in Figure 1.
The monitoring of the ASA is important for quality assurance in pharmaceutical industry and for obtaining optimum therapeutic concentrations in body fluids to minimize the risk of toxicity. Therapeutic concentration for ASA is in the range of 20-200 µg mL−1, it is toxic
from 300 µg mL−1 and its fatal concentration is above 400-500 µg mL−1.5 Therefore, it is important to develop simple and sensitive methods for the determination of this drug.
Various methods for its determination have been employed by using different techniques including e l e c t r o c h e m i s t r y,6 - 8 h i g h p e r f o r m a n c e l i q u i d chromatography (HPLC),9-12 spectrophotometry,13-16 capillary electrophoresis,17 fluorescence spectrometry18,19 and mass spectrometry.20,21 Only one chemiluminescence (CL) method has been reported for the determination of ASA up to now. It was based on the CL system of lucigenin-H2O2 and used for the analysis of ASA in capsules.22
O
OH O O
CL is an attractive mean of detection because it presents low detection limits, a wide linear working range and uses relatively simple instrumentation. For these reasons, CL has received much attention in various fields, especially combination with separation methods, for analysis of drugs in biological samples.23-29 CL relying on the effects related to the chemical reaction only, i.e., without the need of external energy supply, has been found to be more advantageous than other luminescence methods.30 Ruthenium(II) complexes, such as tris(2,2-bipyridyl)-ruthenium(II), Ru(bpy)32+, and tris(1,10-phenanthroline)-ruthenium(II), Ru(phen)32+, are among the most frequently used reagents for the generation of CL.31
Developing new CL methods for analysis of pharmaceuticals is important because of some problems that may limit the application of some CL systems. Firstly, a CL reagent is not always limited to just one unique analyte that leads to interference effects in methods without a separation stage. Type and extent of interferences is different in each CL system. Another problem is the dependence of the CL emission on several environmental factors such as temperature, solvent, ionic strength, pH, and other species present in the system which should be dealt with during HPLC or capillary electrophoretic separation procedures as well as during flow injection analysis (FIA).32-34 Hence, one CL procedure may be appropriate but another may not be suitable for coupling with a separation method. For example, luminol and lucigenin reactions occurs often in alkaline medium, but RuII complexes like Ru(phen)
32+ were often oxidized in acidic media.
Luminol, lucigenin, aryl oxalates, acridinium esters, dioxetanes and Ru(phen)32+ are all synthetic compounds which find application in chemical analysis. The energy for the creation of the electronically excited state comes from the chemical reaction. For emission in the visible region, a reaction liberating at least 40-70 kcal mol−1 is required. Such energetic reactions are generally redox reactions. The liberation of this much energy comes from bond breakage or electron transfer. In systems involving bond breakage (as with luminol, lucigenin, peroxyoxalates, dioxetanes), the CL molecule can be used only once. Some electron transfer reactions such as Ru(phen)32+ result in CL emission without bond breakage or rearrangement, so that those systems can be recycled as is common with some types of electrogenerated chemiluminescence. Therefore, Ru(phen)32+ CL can be used as a sensitive transducer for chemical and biosensors.35
In this study, a new method based on the CL of Ru(phen)32+ is proposed for the determination of ASA. The weak CL light emission was generated during oxidation of Ru(phen)32+ by cerium(IV) (CeIV) in sulfuric acid medium
and the emission intensity was greatly enhanced in the presence of ASA. The proposed method was successfully used for the quantification of ASA in pharmaceuticals and human plasma samples.
Experimental
Materials
All the solutions were prepared using reagent grade chemicals and doubly distilled water. Methanol was HPLC-grade (Caledon, Canada). ASA standard solution (720.0 µg mL−1) was daily prepared by dissolving 0.0720 g of ASA (Merck) in 0.5 mL methanol and diluting to the mark with distilled water in 100.0 mL volumetric flasks. Working solutions were prepared by appropriately diluting the stock solution when used. Ru(phen)32+ solution (1.0 × 10⁻² mol L−1) was prepared by dissolving 0.3640 g of dichlorotris (1,10-phen) ruthenium(II) hydrate (Sigma-Aldrich) in 50.0 mL water. CeIV solutions (5.0 × 10⁻³-5.0 × 10⁻² mol L−1) were prepared by dissolving proper amount of ceric ammonium nitrate (Riedel-de Haën) in proper volumes of 1.0 mol L−1 H
2SO4 and diluting to the mark with distilled water in 100.0 mL volumetric flasks. In this way, H2SO4 concentrations of 0.1, 0.2, 0.35, 0.5 and 0.65 mol L−1 were prepared. ASA pharmaceuticals were purchased from local drugstores. Plasma samples were taken from the health center of Gorgan (Iran).
Preparation of tablets
Ten tablets of each drug were weighed and powdered. An accurately weighed portion of the powder, including active ingredients equivalent to one tablet dosage, was transferred into a 100.0 mL volumetric flask containing 20.0 mL H2O and 2.0 mL methanol. The mixture was sonicated for 10 min. Then the volume was adjusted to 100.0 mL with water and the suspension was filtered. An appropriate volume of the sample solution was further diluted with water so that the final ASA concentration was in the working range.
Procedure for plasma samples
our study. Only a deproteination process was carried out and extraction procedure was not necessary.37 Before adding appropriate volumes of methanol to plasma samples, it was given enough time for the frozen plasma to gradually melt at the room temperature (25 °C). Each time, 0.5 mL of plasma sample and appropriate volume of standard solution of ASA were transferred into a centrifuge tube including 2 mL methanol and the mixture centrifuged at 5000 rpm for 15 min. The protein-free supernatant was transferred into a small conical flask and evaporated to dryness under a stream of nitrogen at room temperature. The dry residue was transferred into a 25.0 mL flask using double distilled water and the mixture was diluted to the mark.
Apparatus
CL analysis was applied using a 0.50 cm light path length quartz cell. The CL signal was measured with a CL analyzer with photomultiplier tube (PMT, Hamamatsu, model R212, Japan) using a low pass filter which its output was connected to a data processing system with a Pentium IV computer. A schematic block diagram of the used instruments is shown in Figure 2.
General procedure
An aliquot (0.40 mL) of standard solution consisting of ASA with 0.40 mL of 2.0 × 10⁻³ mol L−1 of Ru(phen)
32+ were transferred into the 0.50 cm path light length quartz cell. Then, the cell was placed at its location in front of the photomultiplier tube (PMT) and the program was started. After a few seconds, 0.20 mL of acidic CeIV was injected into the cell by a microsyringe and the peak-like CL emission was recorded by a computer (with interval
times of 100 ms). Those data information were collected into Excel software.
Software
All computations were performed using Matlab (The Math-Works Inc., Natick, MA, USA).
Results and Discussion
Proposed CL mechanism
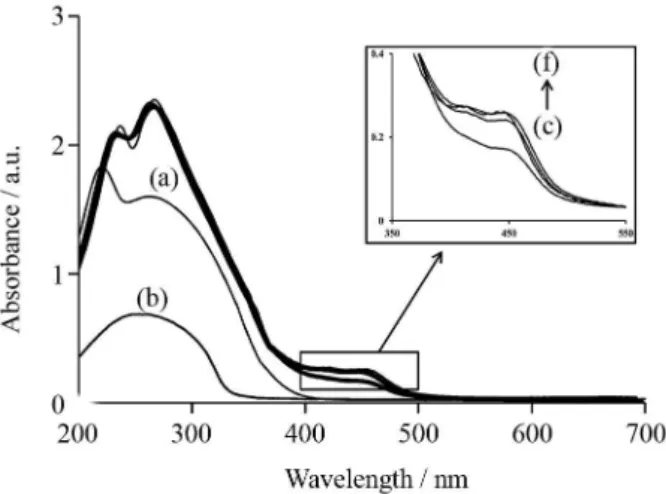
Solution of Ru(phen)32+ is orange and its color changes to green immediate after mixing with oxidizing agent, CeIV solution, and production of Ru(phen)33+.38,39 During about 3 min after mixing of Ru(phen)32+ with CeIV, the color of the mixture changes slowly from green to orange. In Figure 3, UV-Vis spectra are shown for acidic CeIV (Figure 3a) and the mixture of Ru(phen)32+-CeIV with one minute interval times (Figures 3c to 3f).
As can be seen in Figure 3, absorbance in the range 400-500 nm, which is related to Ru(phen)32+ complex, decreases immediately after mixing the Ru(phen)32+ solution with CeIV solution (Figure 3c) and it increases slowly to its equilibrium value after about 3 min (Figures 3d to 3f). The reason is that, the resulting Ru(phen)33+ produced in the reaction of Ru(phen)32+ with acidic CeIV, is a powerful oxidant and oxidizes water into O2 and protons.40 Therefore, it returns slowly to its reduced state. If there was a reducing agent in the reaction media, it can reduce Ru(phen)33+ very fast. The electrons from reducing agent transfer to the π*-orbital of phenanthroline ligand and the Figure 3. UV-Vis spectrum of (a) CeIV; (b) ASA; (c to f) mixture of Ru(phen)32+-CeIV with 1 min intervals. Conditions: (a) CeIV: 2.0 × 10⁻³ mol L−1 in 0.035 mol L−1 of H
2SO4; (b) ASA: 7.2 µg mL−1; (c to f) 2 mL Ru(phen)32+: 1.0 × 10⁻⁴ mol L−1 and 1.0 mL CeIV: 2.0 × 10⁻³ mol L−1 in 0.035 mol L−1 of H
2SO4.
Figure 2. Schematic block diagram of the CL instrument. PMT:
Ru(phen)32+ π* metal-to-ligand charge transfer (MLCT) excited state can be produced.41 The excited electron then undergoes intersystem crossing to the lowest triplet state of Ru(phen)32+, from where emission occurs.42
In order to confirm the mechanism proposed above, some CL pathways might be investigated for the Ru(phen)32+-CeIV-ASA CL system, involving the formation of CeIII*,43 oxidation products in excited state and [Ru(phen)32+]*.44
No detectable CL intensity obtained for the mixture of CeIV-ASA. This suggests that oxidation products and CeIII* are not main emitters.The CL spectrum was scanned with a spectrofluorimeter (Spectrolab, model Spectro-96) using batch mode, a fast scan (15000 nm min−1) and with turned off excitation lamp. The CL spectra were acquired as shown in Figure 4 for Ru(phen)32+-CeIV (Figure 4a), and Ru(phen)32+-CeIV-ASA (Figure 4b).
It was clearly indicated that the maximum emission for both mixtures was ca. 595 nm, which is same as maximum fluorescence emission (λex = 325 nm) of [Ru(phen)3]2+ at 595 nm (inset in Figure 4). This indicated that the CL spectra were independent of ASA and the emitter is [Ru(phen)3]2+.
In acidic medium, ASA gets hydrolysed to salicylic acid (SA).45,46 Oxidation of SA in acid solutions gives rise to phenoxyl radicals,47,48 which can transfer an electron to an oxidizer,49 such as Ru(phen)
33+. In this manner, the main reaction product is 1,4-benzoquinone.45,48,49 According to the above discussion, the following mechanism is proposed for the CL reaction of ASA (Scheme 1).
Kinetic curve of the CL reaction
The method is based on rapid reduction of Ru(phen)33+
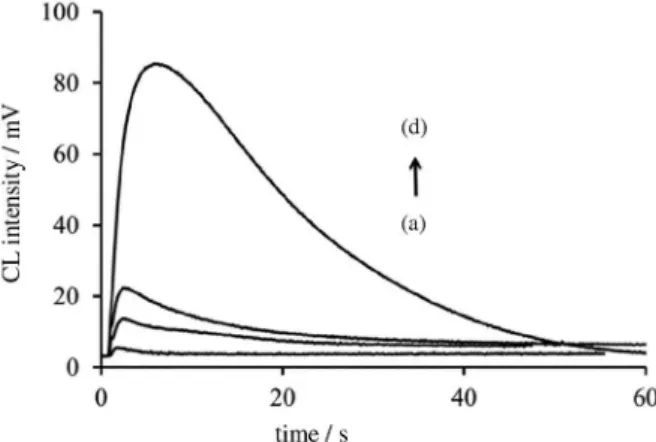
produced in the reaction between Ru(phen)32+ and acidic CeIV by ASA results in strong CL. ASA could yield a reducing intermediate that can reduce the Ru(phen)33+ to the excited state Ru(phen)32+ that subsequently emits light. Typical CL responses of ASA are shown in Figure 5.
Maximum CL response of ASA appeared about 5 s after injection of CeIV solution. For obtaining the analytical signal, response from the blank at second 5 after injection of CeIV solution, was subtracted from CL peak height of each sample.
Influence of chemical variables
Influence of Ru(phen)32+, CeIV and H2SO4 concentrations on the sensitivity were investigated in the presence of 28.8 µg mL−1 ASA.
The influence of concentration of Ru(phen)32+ on the sensitivity was studied in the range of 1.0 × 10⁻³-7.0 × 10⁻³ mol L−1 by injecting concentration of 2.0 × 10⁻² mol L−1 of CeIV prepared in 0.20 mol L−1 of H2SO4. The CL signal increased with increasing Ru(phen)32+ concentration until 2.0 × 10⁻³ mol L−1 and then decreased. Therefore, concentration of 2.0 × 10⁻³ mol L−1 was selected as the optimum concentration for the complex of Ru(phen)32+.
Scheme 1.
Figure 5. Typical CL profiles for different concentrations of ASA
including: (a) blank; (b) 14.4; (c) 28.8 and (d) 576 µg mL−1.
Figure 4. CL spectra of (a) Ru(phen)32+-CeIV; (b) Ru(phen)32+-CeIV-ASA mixtures. Conditions: (a) CeIV: 3.5 × 10⁻² mol L−1 in 0.35 mol L−1 of H
CeIV is an oxidant in this CL system, whose concentration affects the CL intensity. The oxidation potential of CeIV is related to the acidity of solution.50 Because of the interdependence between CeIV and H
2SO4 concentrations that influence the CL signal, we used a 3-level full factorial design and response surface methodology (RSM) for simultaneous optimization of CeIV and H
2SO4 concentrations. Before undertaking any optimization study, it is important to delineate clearly the boundaries of conditions controlling the analysis. Therefore, initial preliminary experiments using the classical single factor at a time method served to detect the respective working ranges of these two variables. So the influence of concentration of CeIV on the CL sensitivity was investigated in the range 5.0 × 10⁻³ to 5.0 × 10⁻² mol L−1 of CeIV in 0.20 mol L−1 of H
2SO4. For this variable, sensitivity increased to concentration of 3.5 × 10⁻² mol L−1 and then decreased at higher concentrations.
The influence of concentration of H2SO4 on the CL intensity was also studied in the range 0.1 to 0.65 mol L−1 of H2SO4. The CL response increased with increasing the concentration of H2SO4 to 0.35 mol L−1 and then decreased.
After detecting respective working ranges of the variables, a 3-level full factorial design was designed for the experiments. The coded levels of the variables together with their real experimental values are given in Table 1 and experiments are listed in Table 2.
In order to describe the way in which the variables are related and the way in which they influence the CL intensity, RSM was used to assemble the model. Therefore, the CL intensities obtained from the experimental design were fit to the following parametric equation (full second order polynomial):
ICL = b0 + b1X1 + b2X2 + b3X1X2 + b4X12 + b5X22 (1)
where ICLis the CL intensity, b0 is the intercept, Xs are the two chemical variables, b1 and b2 are the linear parameters, b3 represents the interaction parameter and, b4 and b5 are the quadratic parameters. Table 3 gives the estimates of 6 parameters, contained in equation 1, obtained by the matrix least squares.
Analysis of the residuals from the regression model and the lack of fit test revealed that the second order polynomial model, tentatively assumed, would be an adequate description of the surface over the region studied.
The operational optimum was determined using a grid method on equation 1, while gradually varying factor levels from −1 to +1. The levels corresponding to the maximum
response were selected as optimum levels. The optimum levels and their respective actual values are shown in Table 4.
Analytical features
Under optimum conditions, standard solutions of ASA were subjected to the optimized CL system for obtaining the working range. CL response was found to be linear in the concentration ranges of 0.72-72.00 µg mL−1. The correlation equation between CL intensity and concentration of ASA
Table 1. Factor levels of the 3-level full factorial design
Coded level CeIV / (mol L−1) H
2SO4 / (mol L−1)
−1 0.01 0.20
0 0.02 0.35
+1 0.03 0.50
Table 2. Design matrix and CL intensities for the 3-level full factorial design experiments
Experiment No. CeIV (X
1) H2SO4 (X2)
CL intensity / mV
1 0.01 0.50 3.5
2 0.02 0.35 9.5
3 0.02 0.50 7.2
4 0.01 0.20 4.1
5 0.02 0.20 7.4
6 0.01 0.35 7.0
7 0.03 0.35 5.1
8 0.03 0.20 4.2
9 0.03 0.50 4.2
10 0.02 0.35 9.7
CL: chemiluminescence.
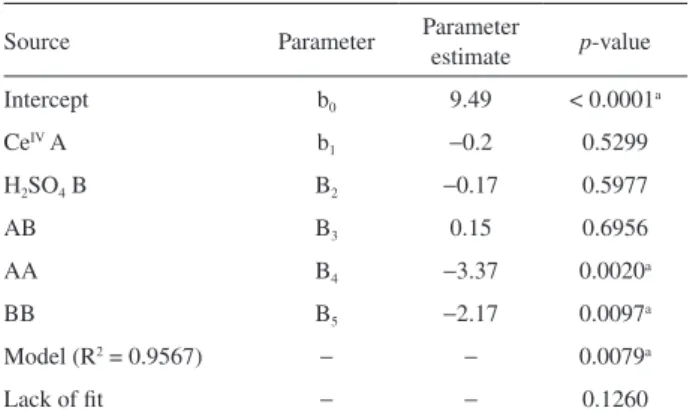
Table 3. Estimation of 6 parameters included in equation 1 by matrix
least squares
Source Parameter Parameter estimate p-value
Intercept b0 9.49 < 0.0001a
CeIV A b
1 −0.2 0.5299
H2SO4 B B2 −0.17 0.5977
AB B3 0.15 0.6956
AA B4 −3.37 0.0020a
BB B5 −2.17 0.0097a
Model (R2 = 0.9567) − − 0.0079a
Lack of fit − − 0.1260
in linear range was: ICL = −0.20 + 0.49 CASA (R2 = 0.9981) where CASA is concentration of ASA (µg mL−1). The limit of detection (LOD) was calculated as 3σ/m where σ is the
standard deviation existing in 10 times determination of the blank response at second 5, and m is slope of the correlation equation between CL intensity and concentration of ASA. The LOD obtained was 0.45 µg mL−1. The reproducibility was investigated using 28.8 µg mL−1 of ASA (n = 10) and the percent of relative standard deviation (%RSD) was 5.8%. The minimum sampling rate could be about 30 samples per hour.
Influence of interfering substances
In order to validate the possible analytical application of the method, interference effect of some ions, excipients in pharmaceutical preparations and amino acids were studied by recovering 14.4 µg mL−1 of ASA in the presence of each substance. The tolerance of each substance was taken as the largest amount yielding an error of less than 5% in the analytical signal of 14.4 µg mL−1 ASA (n = 10). The results are shown in Table 5.
Application
In order to evaluate the applicability of the proposed method, ASA tablets were analyzed to determine their ASA contents. The recovery of ASA from human plasma was also investigated.
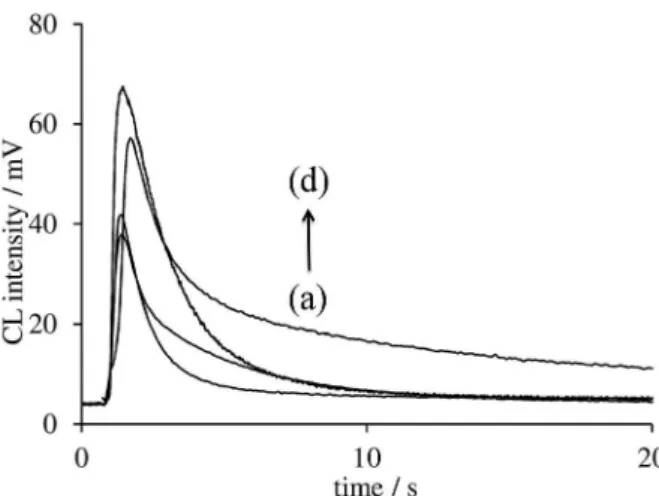
We used a time resolved CL approach for reducing the effect of some interfering substances such as ascorbic
acid and cysteine in plasma samples. It was found that a blank plasma sample (without spiking ASA), prepared as mentioned in the Experimental section, has a sharp peak which its maximum appears at 0.9 s after injection of CeIV solution and CL response decreases rapidly to baseline after about 10 s. In the CL system proposed in this study, ASA had a broad time profile with detectable response at 10 s after injection of CeIV solution. Therefore, for reducing the effect of some interfering substances such as ascorbic acid and cysteine in plasma samples, CL intensity at 10 s after injection of CeIV solution was chosen as the analytical signal in application studies (instead of CL intensity at 5 s after injection of CeIV solution when maximum response of ASA appears). As can be seen in Figure 6, CL kinetic profiles of plasma, ascorbic acid and cysteine have not detectable responses at second 10 after injection of CeIV solution.
The results are shown in Table 6.
The obtained results from analyzing of tablets were also certified using the reference method described in the British Pharmacopoeia (BP).51 Statistical analysis of the results using Student’s t-test and the variance ratio F-test showed no significant difference between the performance of two methods as regards to accuracy and precision. The results are presented in Table 7.
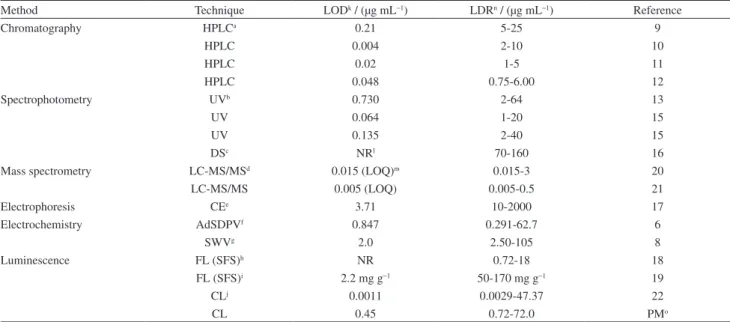
Response characteristics
In Table 8 some response characteristics of the proposed method are compared with recently reported methods.
As is quite obvious from Table 8, CL system of lucigenin-H2O2 and mass spectrometry are more sensitive than the proposed method. All other methods have a narrower linear dynamic range or higher LODs than the proposed method. Although, analytical techniques coupled with a separation
Table 4. The optimum levels and their respective actual values obtained by RSM
Variable Coded level Actual value / (mol L−1)
CeIV −0.030 0.0197
H2SO4 −0.035 0.345
Table 5. Effect of foreign substances on the determination of 14.4 µg mL−1 ASA
Substance Substance to ASAa
Urea, lactose, sucrose, glucose, fructose, saccharin, starch, valine, leucine, serine, threonine, cystine, K+, Na+, Cl−, Zn2+, SO
42−
500
HCO3−, CO32−, PO43−, proline, alanine, glycine, methanol,
mannitol 50
Fe2+, Mg2+ 10
Citric acid, cysteine, ascorbic acid 0.1
aMolar ratio of substance to aspirin.
method, besides chemical information for ASA, provide multi analyte information about related species, compounds and metabolites presented in the sample; however, each of these methods often offers its own set of advantages and disadvantages. There are some disadvantages, such as several time-consuming manipulations, special training, or requirement of comparatively expensive equipment and they are not readily amenable to be cost-effective or to miniaturize instrumentation.
As mentioned in the Introduction section, each CL system has its own set of advantages and disadvantages. For example, in the lucigenin-H2O2 CL system,22 the authors in the interference study recovered ASA (25 µg mL−1) in presence of each substance. They found that methanol and starch had interference at concentrations higher than 10-fold and ions like Na+ and K+ have interference effect at concentration higher than 50-fold of ASA. In their method effect of amino acids was not investigated. The proposed method in our study is not as sensitive as lucigenin-H2O2 system, however, its sensitivity is high enough for the
Table 6. Determination of ASA in real samples
Real sample Added / (µg mL−1)
Founda /
(µg mL−1) Recovery / % Tablet (80 mg)b 0.00 2.55 ± 0.22 −
4.00 6.51 ± 0.39 99.0 12.00 14.24 ± 0.77 97.4 20.00 22.00 ± 0.62 97.3 Tablet (325 mg)c 0.00 4.37 ± 0.31 −
4.00 8.13 ± 0.47 94.0 12.00 17.06 ± 0.65 105.8 20.00 25.26 ± 1.03 104.5 Tablet (100 mg)d 0.00 2.88 ± 0.19 −
4.00 6.98 ± 0.47 102.5 12.00 14.66 ± 0.65 98.2 20.00 23.17 ± 1.03 101.5
Plasma 2.00 2.15 ± 0.16 107.5
4.00 3.97 ± 0.44 99.3 8.00 7.55 ± 0.61 94.4 aMean values of four replications; baspirin 80 mg tablet, Amin Darou Co., Iran; caspirin 325 mg tablet, Jalinus Pharm. Co., Iran; daspirin 100 mg tablet Pars Darou Co., Iran.
Table 7. Analysis of three formulations containing ASA using the proposed method and the reference method
Sample Nominal value / mg Analytical results a
t-testc F-testd CL method / mg BP methodb / mg
Tablet 80 79.7 ± 6.9 84 ± 3.8 1.54 3.3
Tablet 325 341.4 ± 24.2 329.4 ± 8.2 1.34 8.7
Tablet 100 96.0 ± 6.3 102.1 ± 3.1 2.45 4.1
aMean values of four replications; bBritish Pharmacopoeia method: based on acid/base titration using 0.5 mol L−1 NaOH as reactant and 0.5 mol L−1 HCl as titrant; cStudent’s t-test calculated, theoretical value = 3.182 (p = 0.05); dF-test calculated, theoretical value = 9.28 (p = 0.05).
Table 8. Response characteristics of the proposed method in comparison with other recently methods for the determination of ASA
Method Technique LODk / (µg mL−1) LDRn / (µg mL−1) Reference
Chromatography HPLCa 0.21 5-25 9
HPLC 0.004 2-10 10
HPLC 0.02 1-5 11
HPLC 0.048 0.75-6.00 12
Spectrophotometry UVb 0.730 2-64 13
UV 0.064 1-20 15
UV 0.135 2-40 15
DSc NRl 70-160 16
Mass spectrometry LC-MS/MSd 0.015 (LOQ)m 0.015-3 20
LC-MS/MS 0.005 (LOQ) 0.005-0.5 21
Electrophoresis CEe 3.71 10-2000 17
Electrochemistry AdSDPVf 0.847 0.291-62.7 6
SWVg 2.0 2.50-105 8
Luminescence FL (SFS)h NR 0.72-18 18
FL (SFS)i 2.2 mg g−1 50-170 mg g−1 19
CLj 0.0011 0.0029-47.37 22
CL 0.45 0.72-72.0 PMo
determination of ASA in biological fluids (LOD was at least 30 times lower than the therapeutic concentration of ASA). Ions like Na+, K+ and substances like starch that had some interferences in the lucigenin-H2O2 CL system, haven’t interference in this proposed method at concentration lower than 500-fold of ASA. Moreover, interference effect of more substances including some amino acids was investigated.
The proposed method was also used for the determination of ASA in plasma samples using time resolved technique at 10 s after injection of CeIV solution for reducing the potential interference of some substances such as ascorbic acid and cysteine.
Conclusions
A new method based on the CL of Ru(phen)32+ and acidic CeIV was developed for the quantification of ASA. The method is simple and adequately sensitive for the determination of ASA in pharmaceuticals and human plasma. Some common sugars and ions had not significant interference effect in the quantification of ASA indicating high accuracy and suitability for determining of ASA in human fluids and quality assurance in drug formulations.
Acknowledgements
The authors are grateful to the Golestan University for financial support.
References
1. Yamamoto, E.; Takakuwa, S.; Kato, T.; Asakawa, N.; J. Chromatogr. B: Anal. Technol. Biomed. Life Sci. 2007, 846,
132.
2. Altman, R.; Carreras, L.; Diaz, R.; Figueroa, E.; Br. Med. J.
1994, 308, 81.
3. Cattaneo, M.; Arterioscler., Thromb., Vasc. Biol. 2004, 24,
1980.
4. Mason, P. J.; Freedman, J. E.; Jacobs, A. K.; Mol. Rev. Cardiovasc. Med. 2003, 5, 156.
5. Schulz, M.; Schmoldt, A.; Pharmazie 2003, 58, 447.
6. Sanghavi, B. J.; Srivastava, A. K.; Electrochim. Acta 2010, 55, 8638.
7. Supalkova, V.; Petrek, J.; Havel, L.; Krizkova, S.; Petrlova, J.; Adam, V.; Potesil, D.; Babula, P.; Beklova, M.; Horna, A.; Sensors 2006, 6, 1483.
8. Sartori, E. R.; Medeiros, R. A.; Rocha-Filho, R. C.; Fatibello-Filho, O.; J. Braz. Chem. Soc. 2009, 20, 360. 9. Shah, D.; Bhatt, K.; Mehta, R.; Shankar, M.; Baldania, S.;
Gandhi, T.; Indian J. Pharm. Sci. 2007, 69, 546.
10. Gandhimathi, M.; Ravi, T.; Abraham, A.; Thomas, R.; J. Pharm. Biomed. Anal. 2003, 32, 1145.
11. Gandhimathi, M.; Ravi, T.; Indian J. Pharm. Sci. 2007, 69, 123. 12. Akay, C.; Degim, I. T.; Sayal, A.; Aydin, A.; Ozkan, Y.; Gul, H.;
Turk. J. Med. Sci. 2008, 38, 167.
13. Murtaza, G.; Khan, S. A.; Shabbir, A.; Mahmood, A.; Asad, M.; Farzana, K.; Malik, N. S.; Hussain, I.; Sci. Res. Essays 2011, 6, 417.
14. Moţ, A. C.; Soponar, F.; Medvedovici, A.; Sârbu, C.; Anal. Lett.
2010, 43, 804.
15. Ruiz-Medina, A.; Fernández-de Córdova, M. L.; Ortega-Barrales, P.; Molina-Díaz, A.; Int. J. Pharm. 2001, 216, 95.
16. El-Yazbi, F. A.; Hammud, H. H.; Assi, S. A.; Spectrochim. Acta, Part A 2007, 68, 275.
17. Chen, H. L.; Fan, L. Y.; Chen, X. G.; Hu, Z. D.; Zhao, Z. F.; Hooper, M.; J. Sep. Sci. 2003, 26, 863.
18. Wei, Y.; Li, X.; Ma, D.; Guangpuxue Yu Guangpu Fenxi 2005, 25, 588.
19. Moreira, A. B.; Dias, I. L.; Neto, G. O.; Zagatto, E. A.; Kubota, L. T.; Anal. Chim. Acta 2004, 523, 49.
20. Gajula, R.; Pilli, N. R.; Ravi, V. B.; Maddela, R.; Inamadugu, J. K.; Polagani, S. R.; Busa, S.; Sci. Pharm. 2012, 80, 923.
21. Bae, S. K.; Seo, K. A.; Jung, E. J.; Kim, H. S.; Yeo, C. W.; Shon, J. H.; Park, K. M.; Liu, K. H.; Shin, J. G.; Biomed. Chromatogr.
2008, 22, 590.
22. Wabaidur, S.; Alam, S.; Alothman, Z.; Eldesoky, G.; Luminescence 2014, 29, 684.
23. Nalewajko-Sieliwoniuk, E.; Malejko, J.; Mozolewska, M.; Wołyniec, E.; Nazaruk, J.; Talanta 2015, 133, 38.
24. Wu, H.; Chen, M.; Fan, Y.; Elsebaei, F.; Zhu, Y.; Talanta 2012,
88, 222.
25. Sun, Y.; Zhang, Z.; Zhang, X.; Spectrochim. Acta, Part A 2013,
105, 171.
26. Lin, Z.; Sun, X.; Hu, W.; Yin, Y.; Chen, G.; Electrophoresis
2014, 35, 993.
27. Liu, Y.; Liu, Y.; Zhou, M.; Huang, K.; Cao, J.; Wang, H.; Chen, Y.; J. Chromatogr. A 2014, 1340, 128.
28. Liu, Y. M.; Mei, L.; Liu, Y. Y.; Zhou, M.; Huang, K. J.; Chen, Y. H.; Ren, S. W.; Electrophoresis 2014, 35, 972.
29. Adcock, J. L.; Terry, J. M.; Barrow, C. J.; Barnett, N. W.; Olson, D. C.; Francis, P. S.; Drug Test. Anal. 2011, 3, 139.
30. Cao, W.; Gong, P.; Liu, W.; Zhuang, M.; Yang, J.; Drug Test. Anal. 2013, 5, 242.
31. Luaces, M.; Martínez, N.; Granda, M.; Valdés, A.; Pérez-Conde, C.; Gutiérrez, A.; Talanta 2011, 85, 1904.
32. Baeyens, W.; Schulman, S.; Calokerinos, A.; Zhao, Y.; Campana, A. M. G.; Nakashima, K.; De Keukeleire, D.; J. Pharm. Biomed. Anal. 1998, 17, 941.
33. Ocaña-González, J. A.; Ramos-Payán, M.; Fernández-Torres, R.; Navarro, M. V.; Bello-López, M. Á.; Talanta 2014, 122, 214.
35. Lee, W.-Y.; Microchim. Acta 1997, 127, 19.
36. Samari, F.; Hemmateenejad, B.; Shamsipur, M.; Anal. Chim. Acta 2010, 667, 49.
37. Aly, F. A.; Al-Tamimi, S. A.; Alwarthan, A. A.; Talanta 2001,
53, 885.
38. Yoshida, R.; Ueki, T.; NPG Asia Mater. 2014, 6, e107.
39. Hong, D.; Jung, J.; Park, J.; Yamada, Y.; Suenobu, T.; Lee, Y.-M.; Nam, W.; Fukuzumi, S.; Energy Environ. Sci. 2012, 5, 7606.
40. Hara, M.; Waraksa, C. C.; Lean, J. T.; Lewis, B. A.; Mallouk, T. E.; J. Phys. Chem. A 2000, 104, 5275.
41. Wallace, W. L.; Bard, A. J.; J. Phys. Chem. 1979, 83, 1350. 42. Bolton, E.; Richter, M. M.; J. Chem. Educ. 2001, 78, 47.
43. Campiglio, A.; Analyst 1998, 123, 1571.
44. Tokel-Takvoryan, N. E.; Hemingway, R. E.; Bard, A. J.; J. Am. Chem. Soc. 1973, 95, 6582.
45. Subrahmanyam, E.; Bhat, K.; Sherigara, B.; Kalluraya, B.; Indian J. Chem., Sect. A: Inorg., Bio-inorg., Phys., Theor. Anal.
Chem. 2001, 40, 171.
46. David, B.; Troy, D. B.; Beringer, P.; Remington: the Science and Practice of Pharmacy; Lippincott Williams & Wilkins: Philadelphia, USA, 2006.
47. Reszka, K. J.; Britigan, L. H.; Britigan, B. E.; J. Pharmacol. Exp. Ther. 2005, 315, 283.
48. Hiremath, C. V.; Kiran, T. S.; Nandibewoor, S. T.; J. Mol. Catal. A: Chem. 2006, 248, 163.
49. Zhang, W.-D.; Xu, B.; Hong, Y.-X.; Yu, Y.-X.; Ye, J.-S.; Zhang, J.-Q.; J. Solid State Electrochem. 2010, 14, 1713.
50. Nie, L.; Ma, H.; Sun, M.; Li, X.; Su, M.; Liang, S.; Talanta
2003, 59, 959.
51. British Pharmacopoeia, vol. I & II; British Pharmacopoeia Commission: London, 2009.
Submitted: August 21, 2015