Full Terms & Conditions of access and use can be found at
http://www.tandfonline.com/action/journalInformation?journalCode=iphb20
Download by: [CAPES] Date: 07 November 2017, At: 09:57
Pharmaceutical Biology
ISSN: 1388-0209 (Print) 1744-5116 (Online) Journal homepage: http://www.tandfonline.com/loi/iphb20
Polyphenol profile by UHPLC-MS/MS,
anti-glycation, antioxidant and cytotoxic activities of
several samples of propolis from the northeastern
semi-arid region of Brazil
Jadriane de Almeida Xavier, Iara Barros Valentim, Fabiana O. S. Camatari,
Alberto M. M. de Almeida, Henrique Fonseca Goulart, Jamylle Nunes de
Souza Ferro, Emiliano de Oliveira Barreto, Bruno Coelho Cavalcanti, Carla B.
G. Bottoli & Marília Oliveira Fonseca Goulart
To cite this article: Jadriane de Almeida Xavier, Iara Barros Valentim, Fabiana O. S. Camatari, Alberto M. M. de Almeida, Henrique Fonseca Goulart, Jamylle Nunes de Souza Ferro, Emiliano de Oliveira Barreto, Bruno Coelho Cavalcanti, Carla B. G. Bottoli & Marília Oliveira Fonseca Goulart (2017) Polyphenol profile by UHPLC-MS/MS, anti-glycation, antioxidant and cytotoxic activities of several samples of propolis from the northeastern semi-arid region of Brazil, Pharmaceutical Biology, 55:1, 1884-1893, DOI: 10.1080/13880209.2017.1340962
To link to this article: http://dx.doi.org/10.1080/13880209.2017.1340962
© 2017 The Author(s). Published by Informa UK Limited, trading as Taylor & Francis Group.
View supplementary material
Published online: 20 Jun 2017. Submit your article to this journal
Article views: 309 View related articles
RESEARCH ARTICLE
Polyphenol profile by UHPLC-MS/MS, anti-glycation, antioxidant and cytotoxic
activities of several samples of propolis from the northeastern semi-arid region
of Brazil
Jadriane de Almeida Xaviera, Iara Barros Valentimb, Fabiana O. S. Camataria, Alberto M. M. de Almeidac, Henrique Fonseca Goulartd, Jamylle Nunes de Souza Ferroe, Emiliano de Oliveira Barretoe,
Bruno Coelho Cavalcantif, Carla B. G. Bottoligand Marılia Oliveira Fonseca Goularta
a
Instituto de Quımica e Biotecnologia, Universidade Federal de Alagoas (UFAL), Maceio, AL, Brazil;bInstituto Federal de Educac¸~ao, Ci^encia e
Tecnologia de Alagoas (IFAL), Rua Mizael Domingues, Maceio, AL, Brazil;cEmpresa Baiana de Desenvolvimento Agrıcola S.A (EBDA), Salvador,
BA, Brazil;dLaboratorio de Pesquisas em Recursos Naturais, Centro de Ci^encias Agrarias (CECA), UFAL, Rio Largo, AL, Brazil;eLaboratorio de Biologia Celular, UFAL, Maceio, AL, Brazil;fDepartamento de Fisiologia e Farmacologia, Laboratorio Nacional de Oncologia Experimental, Universidade Federal do Ceara, Fortaleza, CE, Brazil;gInstituto de Quımica, Universidade de Campinas, Campinas, SP, Brazil
ABSTRACT
Context:Propolis has promising biological activities. Propolis samples from the Northeast of Bahia, Brazil – sample A from Ribeira do Pombal and B, from Tucano – were investigated, with new information regarding their biological activities.
Objective:This paper describes the chemical profile, antioxidant, anti-glycation and cytotoxic activities of these propolis samples.
Material and methods:Ethanol extracts of these propolis samples (EEP) and their fractions were analyzed to determine total phenolic content (TPC); antioxidant capacity through DPPH·, FRAP and lipid peroxida-tion; anti-glycation activity, by an in vitroglucose (10 mg/mL) bovine serum albumine (1 mg/mL) assay, during 7 d; cytotoxic activity on cancer (SF295, HCT-116, OVCAR-8, MDA-MB435, MX-1, MCF7, HL60, JURKAT, MOLT-4, K562, PC3, DU145) and normal cell lines (V79) at 0.04–25lg/mL concentrations, for 72 h. The determination of primary phenols by ultra high-pressure liquid chromatography coupled to tandem mass spectrometry (UHPLC-MS/MS) and volatile organic compounds content by gas chromatography-mass spectrometry (GC-MS) were also performed.
Results:The EEP polar fractions exhibited up to 90% protection against lipid peroxidation. The IC50value for anti-glycation activity of EEP was between 16.5 and 19.2lg/mL, close to aminoguanidine (IC50¼7.7lg/mL). The use of UHPLC-MS/MS and GC-MS allowed the identification of 12 bioactive phenols in the EEP and 24 volatile compounds, all already reported.
Conclusions: The samples present good antioxidant/anti-glycation/cytotoxic activities and a plethora of biologically active compounds. These results suggest a potential role of propolis in targeting ageing and diseases associated with oxidative and carbonylic stress, aggregating value to them.
ARTICLE HISTORY Received 3 October 2016 Revised 13 May 2017 Accepted 7 June 2017
KEYWORDS
biologically active phenols; chemical profile; content of organic volatiles
Introduction
Propolis is a natural gummy and balsamic resin, obtained from resinous substances, collected by honey bees from flowers, buds and plant exudates. It has been attracting scientific attention due to its biological and pharmacological properties, which are related to its chemical composition (Silva-Carvalho et al. 2015). It varies according to the botanical origin of the resinous sub-stances, season of the year and environmental conditions at the site of collection. For these reasons, there are many different types of propolis, with considerable chemical diversity (Huang et al. 2014). The standardization of propolis with respect to its chemical composition is difficult (Silva-Carvalho et al.2015), but it is urgently required.
Food, nutraceuticals and other products rich in antioxidants can protect an organism against reactive oxygen species (ROS)
and advanced glycation/lipoxidation end product (AGE/ALE) accumulation (Boisard et al. 2014). AGEs and ALEs are formed through specific condensation reactions between nucleophiles, like amino groups of free amino acids or their residues in pepti-des, aminophospholipids or proteins, and electrophiles, such as oxidized products from excess ROS, for instance, carbonyls of reducing sugars, oxidized lipids and/or others, generating well-defined sets of covalent adducts (Chinchansure et al. 2015; Barbosa et al.2016). The adverse role of these AGE precursors is observed in a wide spectra of pathogenic conditions, including microvascular and macrovascular diseases such as nephropathy, retinopathy, peripheral neuropathy and arteriosclerosis in dia-betes mellitus (Lo et al. 2006; Uribarri et al. 2015). The identifi-cation of anti-glyidentifi-cation agents to prevent the formation of these compounds holds great promise as they can be used for supple-mentary treatment of the complications of diabetes mellitus,
CONTACTMarılia Oliveira Fonseca Goulart [email protected] Instituto de Quımica e Biotecnologia, Universidade Federal de Alagoas, Campus A.C. Sim~oes, Tabuleiro do Martins, 57072-970 Maceio, AL, Brazil
Supplemental data for this article can be accessed here.
ß2017 The Author(s). Published by Informa UK Limited, trading as Taylor & Francis Group.
This is an Open Access article distributed under the terms of the Creative Commons Attribution License (http://creativecommons.org/licenses/by/4.0/), which permits unrestricted use, distri-bution, and reproduction in any medium, provided the original work is properly cited.
PHARMACEUTICAL BIOLOGY, 2017 VOL. 55, NO. 1, 1884–1893
https://doi.org/10.1080/13880209.2017.1340962
such as microangiopathy or microneuropathy (Lo et al. 2006; Ramkissoon et al. 2012a; Uribarri et al. 2015). Much effort has been expended to search for dietary plants that can effectively inhibit AGE formation that also have antioxidant properties (Ramkissoon et al. 2012a, 2012b). Compounds offering both properties have been reported to show greater efficacy for treat-ing diabetes mellitus versus compounds targettreat-ing an individual pathway (Duraisamy et al.2003). As such, on-going screening of natural compounds that offer combined antioxidant and anti-gly-cation properties with relatively low toxicity are promising candi-dates for the development of functional additives aimed at reducing protein glycation for the treatment and management of oxidative stress-related diseases, diabetic complications and other AGE-associated diseases (Elosta et al. 2012; Ramkissoon et al.
2012a,2012b,2013; Sahebi and Divsalar2016). In addition, a few studies report the ability of propolis to prevent fluorescent AGE formation (Orsolic et al. 2012; Boisard et al. 2014; Sahebi and Divsalar2016).
In Brazil, due to its wide biodiversity that produces different biological properties and different chemical compositions of propolis, many uses have been reported (Pereira et al. 2002). Propolis has been used as a food supplement and as a source of bioactive compounds, including polyphenols, flavonoid aglycones, phenolic acids and their esters, as well as phenolic aldehydes and ketones (Toreti et al. 2013; Huang et al. 2014). Some studies indicate that propolis exhibits antitumor activity and can be used, for instance, in the treatment of skin cancer, lung cancer and tumors of the throat and brain (Slavov et al. 2014). The ethanolic extract of red propolis has been able to inhibit the growth of cancerous cells of human laryngeal epidermoid carcin-oma cells (Hep-2) and human cervical adenocarcincarcin-oma (HeLa) (Frozza et al. 2013). Eleven chemical components isolated from the water extract of Chinese propolis were tested using human tumor cell lines of breast (MCF-7, MDA-MB-231), lung (A549) and HeLa. Chemical constituents from propolis: pinobanksin, caffeic acid benzyl ester, caffeic acid phenethyl ester, apigenin, pinocembrin, chrysin and galangin significantly inhibited the proliferation of four tumor cell lines (Xuan et al.2016).
Brazilian propolis is classified into 13 different groups accord-ing to their geographical origin, chemical composition and vege-tal source. Park et al. (2000) classified types according to their appearance, coloration, UV–VIS absorption spectra and chemical profile using thin-layer chromatography, high-performance chro-matography and biological properties. However, the chemical profile analysis was performed only comparing differences in the chromatograms obtained, without identification of compounds, or chemical markers for each type of propolis. Thus, it is import-ant to study and characterize samples produced in distinct regions according to their chemical markers (Toreti et al.2013).
In the present study, two propolis samples from the Northeast of Bahia, referred as sample A from the Ribeira do Pombal region, and sample B, from Tucano, were investigated for their chemical profiles, antioxidant and anti-glycation capacities and cytotoxic activity against several cancer cell lines, in comparison with normal cell lines. To our knowledge, this is the first report on propolis from these regions. The anti-glycation properties of these propolis samples also, up to now have not been examined.
Materials and methods
Chemicals
Folin–Ciocalteau (FC) reagent, ethanol, methanol, 2,20
-diphenyl-1-picrylhydrazyl radical (DPPH
), 2,4,6-tripyridyl-s-triazine
(TPTZ), 2,2-azobis(2-amidinopropane) dihydrochloride (AAPH), apigenin, caffeic acid, cinnamic acid, coumaric acid, chloro-genic acid, ferulic acid, gallic acid, sinapic acid, syringic acid, vanillic acid, kaempferol, catechin, epicatechin, epigallocatechin, formononetin, luteolin, quercetin, rutin, 3,4-dihydroxybenzoic acid, 3-(4,5-dimethylthiazol-2-yl)-2,5-diphenyltetrazolium brom-ide (MTT) and TroloxVR
were purchased from Sigma Aldrich (Steinheim, Germany) and used as received. Sodium carbonate and DMSO (dimethylsulfoxide) were supplied by Vetec Quımica Fina Ltda (Rio de Janeiro, Brazil) and TroloxVR
by Merck (D€usseldorf, Germany). 4,4-Difluoro-5-(4-phenyl-1,3-butadienyl)-4-bora-3a,4a-diaza-S-indacene-3-undecanoic acid (C11-BODIPY581/591) was obtained from Molecular Probes (Ontario, Canada). All reagents were of analytical grade and the stock solutions and buffers were prepared with Milli-Q purified water.
Propolis samples
Samples of crude propolis produced by Apis mellifera bees were collected in May 2014 from Ribeira do Pombal (10910S; 38410W; 245.50 m, sample A) and Tucano (11190S; 38700W; 414.45 m, sample B) in the state of Bahia. The collection of sam-ples was carried out by competent collectors from the beekeeper cooperative. The samples were stored in amber glass vials in a freezer until further use.
Preparation of the ethanol extracts of propolis (EEP) and their fractions
Propolis samples (8 g) were extracted with 80% (v/v) ethanol (100 mL) in a water bath at 70C for 30 min and, after filtration, concentrated in a rotaevaporator, resulting in dry extracts, designed as EEPA, from sample A, and EEPB, from sample B. These extracts were resuspended in methanol (100 mL). The methanol solution was further fractioned by liquid–liquid extrac-tion with hexane and chloroform. For a better separaextrac-tion in CHCl3, water was added (20 mL). This treatment led to three fractions: a hexane fraction (Hex-fr), a chloroform fraction (Chlo-fr) and a hydromethanol fraction (HMet-fr). All extracts were concentrated in a rotaevaporator, adequately labeled and stored in amber glass vials under refrigeration. The experimental steps performed with the two propolis samples are displayed in
Figure 1.
Estimation of total polyphenolic content
The total phenolic contents (TPCs) of the extracts (EEPs and fractions) were determined using FC reagent, as described by Cicco et al. (2009) with the following modifications: aliquots (120lL) of ethanolic solutions of propolis (25lg/mL) were placed in test tubes, followed by the addition of 180lL of water. About 300lL of FC reagent were added to each tube. After 2 min, 2400lL of a 5% (w/v) sodium carbonate solution were added. The mixture was shaken and heated at 40
C in a water bath for 20 min. The tubes were then rapidly cooled and the developed color was read at 760 nm in a MultiSpec–1501 UV–Vis spectrophotometer (Shimadzu, Tokyo, Japan). The con-centration of phenolic compounds was estimated using a calibra-tion curve constructed with gallic acid (GA) in ethanol (0.7–7.0 mg/L) as a polyphenol reference (n¼3). The results are
expressed as mg of GA equivalents/g dry extract. The same pro-cedure was performed using 120lL of water, as a blank.
Radical scavenging ability toward DPPH·(RSA-DPPH )
The antioxidant capacities of the EEPs and fractions were meas-ured in terms of their radical scavenging ability (RSA), using the DPPH method (Sanchez-Moreno et al. 1999). The residue obtained from 0.30 mL of the extract dissolved in ethanol was mixed with 2.70 mL of DPPH
solution (40lg/mL in methanol) to give a final sample concentration of approximately 25lg/mL. The mixture was then homogenized and stored in the dark prior to analysis. The percentage of DPPH
radical-scavenging activity (RSA% – DPPH
) of each sample was calculated as follows: RSA%¼(1 AC/AD)100, where AC is the absorbance of the solution when the sample was added at a particular level and AD is the absorbance of the original DPPH
solution. The IC50 (half maximal inhibitory concentration) was calculated graphically, using a calibration curve, in the linear range by plotting the extract concentration versus the corresponding scavenging effect
(I%, inhibition percentage), over 30 min. The value of I% was calculated using the equation: I%¼[(A0 – A1)/A0]100, where A0is the absorbance of the control and A1 the absorbance in the presence of the extract or fraction.
FRAP assay
The assay was performed, according to the method described by Benzie and Strain (1996) with some modifications. In brief, the FRAP reagent was prepared by mixing 2.5 mL of a solution of TPTZ (10 mmol/L) in 40 mmol/L HCl, 2.5 mL of FeCl3 (20 mmol/L) and 25 mL of 0.30 mol/L acetate buffer (pH 3.6). Sample aliquots (90lL) were mixed with 270lL of distilled water and 2.7 mL of FRAP reagent and then incubated at 37C for 30 min, resulting in a final concentration of 25lg/mL of EEPs or fractions. The absorbance of the reaction mixture was measured, at 595 nm, and a calibration curve was prepared with TroloxVR (0.04–7.50 mg/L). The results are expressed as trolox equivalent antioxidant capacities (TEAC), in mg of Trolox/g of dry extract.
Concentraon in a rotaevaporator
EEP, ethanol 80% (v/v) Crude propolis GC-MS
Folin, DPPH, FRAP
Lipid Peroxidaon
An-glycaon
Cytotoxicity
UHPLC-MS/MS
Resuspended in methanol (100 mL)
Liquid–liquid extracon with hexane (1:1)
Chloroform fracon
Methanol fracon Folin, DPPH, FRAP
Lipid Peroxidaon
UHPLC-MS/MS
Hexane fracon
Water (20 mL)
Liquid–liquid extracon with chloroform (1:1)
Folin, DPPH, FRAP Lipid Peroxidaon UHPLC-MS/MS
Hydromethanol fracon
Folin, DPPH, FRAP Lipid Peroxidaon UHPLC-MS/MS
Figure 1. Simplified flow chart of the experiment performed with the two samples of propolis (EEPA and EEPB). 1886 J. A. XAVIER ET AL.
Lipid peroxidation measurements
Unilamellar vesicles of soy phosphatidylcholine (1 mmol/L) were prepared by extrusion (MacDonald et al. 1991) (100 nm pore diameter membrane, at 25C) in 10 mL of phosphate buffer (50 mmol/L), pH 7.4, with the additional incorporation of 0.1lmol/L of the peroxyl-sensitive fluorescent probe C11-BODIPY581/591 (Drummen et al. 2002). The particle size was measured by Nanotrac-Zetatrac, NPA151-31A-0000-D30-10M model (Microtrac, York, PA), being around 100 nm.
Fluorescence measurements were carried out at 37C, using a RF-5301PC spectrofluorophotometer (Shimadzu, Tokyo, Japan). In a 1-mL quartz cuvette, adequate amounts of unilamellar ves-icle suspension, phosphate buffer (pH 7.4) and the sample (EEPs or fractions) (final concentrations of 25lg/mL) or positive con-trols (TroloxVR
, 100lmol/L) were mixed. Ethanol and buffer were used as negative controls. The reaction was initiated with the addition of 100lL of AAPH (100 mmol/L). The fluorescence decay (kexc¼580 nm, kem¼600 nm) was continuously monitored over 30 min.
Anti-glycation activity
This assay was performed in triplicate according to the method described by Beaulieu et al. (2009) and Melo et al. (2015) with some modifications. Initially, the incubation medium consisting of BSA (1 mg/mL), glucose (10 mg/mL) and fructose (10 mg/mL) was prepared in sodium phosphate buffer (100 mmol/L pH 7.4). Seven different concentrations of ethanol solutions of the dry extracts of EEPA or EEPB (2.5–100lg/mL) were analyzed to determine the IC50. To determine whether the EEP interfered with fluorescence, an extract blank containing glucose (100 mmol/L) and fructose (100 mmol/L) in 100 mmol/L phos-phate buffer was prepared for each dilution. A negative control, containing glucose (10 mg/mL), fructose (10 mg/mL), BSA (1 mg/ mL) and the vehicle in 100 mmol/L phosphate buffer and a posi-tive control, containing aminoguanidine (0.78–50lg/mL), were also prepared and assayed.
The samples were incubated in the dark at 37
C with con-stant stirring for 7 d and the formation of AGE was quantified, using a RF-5301PC spectrofluorophotometer (Shimadzu, Tokyo, Japan) at kex¼355 and kem¼440 nm. The analyses were car-ried out in triplicate. The IC50 was calculated graphically, using a regression analysis by plotting the extract concentra-tion versus the corresponding inhibition percentage (I%). The I% for formation of AGE was calculated as follows: I%¼(Fnegative control Fexperimental corrected/Fnegative control)100, where Fnegative control is the fluorescence for the negative con-trol and Fexperimental corrected is the experimental fluorescence corrected for the experimental treatments.
In vitrocytotoxic assay
Macrophage
The cytotoxic effects of EEPA and EEPB on macrophage line J774 were investigated using the MTT assay method (Mosmann
1983). Macrophages were grown according to Thomas et al. (1997) and distributed in a 96-well plate (1.5105cells/well and incubated overnight [37C]). Adherent cells were treated with samples of the EEPA or EEPB, dissolved in PBSþDMSO (0.037%) at concentrations from 1, 10, 25, 50 or 100lg/mL in culture medium RPMI-1640, supplemented with 10% foetal bovine serum and were then further cultured for 24 h (37C).
Thereafter, the medium was replaced with fresh RPMI medium containing 5 mg mL 1 of MTT. After an additional 4 h incuba-tion at 37C, the supernatant was discarded and the DMSO solu-tion (150lL/well) was added to each culture plate. After 15 min incubation at room temperature, the absorbance of solubilized MTT formazan product was spectrophotometrically measured, at 540 nm. Four individual wells were assayed per treatment and MTT reduction activity was determined as a percentage of con-trol cells ([absorbance of treated cells/absorbance of untreated cells]100).
Cancer cell lines
The EEPA and EEPB (0.04–25lg/mL) were tested for cytotoxic activity against selected human cancer cell lines: SF295 (glioblast-oma), HCT-116 (colon), OVCAR-8 (ovarian), MDA-MB435 (melanoma), MX-1 (breast), MCF7 (breast), HL60 (promyelocytic leukemia), JURKAT (acute T cell leukemia), MOLT-4 (acute T cell leukemia), K562 (chronic myelogenous leukemia), PC3 (pros-tate) and DU145 (pros(pros-tate). The extracts were incubated with the cells for 72 h. All cell lines were kindly donated by the National Cancer Institute (Bethesda, MD). Cytotoxicity was quantified through the ability of living cells to reduce the yellow dye 3-(4,5-dimethyl-2-thiazolyl)-2,5-diphenyl-2H-tetrazolium bromide (MTT, Sigma Aldrich, St. Louis, MO) to a purple formazan prod-uct and absorbance was measured at 595 nm (DTX-880, Beckman Coulter), as described by Mosmann (1983). Also, to investigate the selectivity of samples toward a normal proliferat-ing cell, non-cancer Chinese hamster lung fibroblasts (V79 cells), kindly provided by Dr. Henriques JAP (Federal University of Rio Grande do Sul, Porto Alegre, Brazil), and L929 mouse fibroblasts, purchased from the Rio de Janeiro Cell Bank (Federal University of Rio de Janeiro, Rio de Janeiro, Brazil) were used. Human can-cer cells were maintained in RPMI 1640 medium, and the V79 and L929 murine cell lines were cultivated under standard condi-tions in MEM with Earle’s salts. For lymphocyte isolation, hep-arinized blood (from healthy, nonsmoker donors who had not taken any medication at least 15 d prior to sampling) was col-lected, and peripheral blood lymphocytes (PBLs) were isolated by a standard method of density-gradient centrifugation on Histopaque-1077, and had their growth stimulated with 2% phy-tohemaglutinin. All culture media were supplemented with 10% (cancer cells and murine fibroblasts) or 20%(lymphocytes) foetal bovine serum, 2 mmol/L glutamine, 100lg/mL penicillin and 100lg/mL streptomycin at 37C, under 5%CO
2.
Identification of phenolic compounds by UHPLC-MS/MS
Chromatographic analyses of the EEPs, Hex-fr, Chlo-fr and HMet-fr (1 mg/mL) were performed in an Acquity UPLC System from Waters (Milford, CT), equipped with a binary solvent deliv-ery system, degasser, autosampler and column heater. Chromatographic separations were performed using an Acquity BEH C18 column (100 mm2.1 mm), with a 1.7-lm particle size from Waters. MS/MS detection was performed using a Xevo TQD tandem quadrupole mass spectrometer from Waters (Manchester, UK), coupled with an electrospray ionization inter-face (ESI), operating in the negative ion mode. The source parameters were capillary voltage: 4.5 kV, source temperature: 120
C and desolvation gas temperature: 400
C, with nitrogen flow rates of 30 and 600 L/h for the cone and desolvation gases, respectively. Mobile phase components were eluent A: ultrapure water containing 0.1% formic acid and eluent B: acetonitrile.
The flow rate was 0.2 mL/min and 2lL of samples were injected, with a linear gradient starting at 3%B, increasing to 100% B in 10 min. For identification, the multiple reaction monitoring (MRM) mode was employed to confirm the presence of phenolic compounds in the sample, along withm/ztransitions of the pre-cursor ions and product ions.
Phenolic standards (19) were monitored: apigenin, caffeic acid, cinnamic acid, coumaric acid, chlorogenic acid, ferulic acid, gallic acid, sinapic acid, syringic acid, vanillic acid, kaempferol, catechin, epicatechin, epigallocatechin, formononetin, luteolin, quercetin, rutin and 3,4-di-hydroxybenzoic acid. These com-pounds were chosen due to their pharmacological potential and/ or have already been identified in other types of propolis.
Characterization of propolis samples by headspace GC-MS
The headspace extraction was carried out at 40C for 2 h using 1.0 g of triturated propolis sample (A or B) in an amber glass tube, with a volume of 15.0 mL. The volatiles were collected with a solid phase microextraction (SPME) device of fused silica (FS) having 100lm diameter with a 10lm coating of a thin film (75lm) of polydimethylsiloxane (PDMS). The analysis of the constituents was performed with a Shimadzu GC-17A gas chromatograph (Shimadzu, Tokyo, Japan) coupled to a quadrupole mass spec-trometer, GCMSQP5050A. Injection in splitless mode used helium as the carrier gas, at a flow rate of 1.0 mL/min. The injector tem-perature was 220C. A fused-silica capillary column (5% phe-nyl–95% polydimethylsiloxane, 30 m0.25 mm, 0.25lm) was employed in the separation of the compounds. The oven tempera-ture was programed to increase from 60C to 240C, at a rate of 3
C/min. Electron ionization (70 eV) was used and the mass scan ranged from 30 to 300 Da. The temperatures of the ion source and the GC-MS interface were 200
C and 230
C, respectively. Volatile compounds were identified by analysis of the spectra, comparing these mass spectra with reported ones, mainly by ana-lysing the features of the molecular ion and base peaks, relating them to other spectra of the database available in Wiley MS (Wiley Class 5000, sixth edition) GCM Solutions and through the comparison of Kovats indices calculated by injecting a series of standard alkanes (C7–C30), using retention indices reported in the literature. Quantitative analysis method was performed by peak area normalization method for their relative contents. The analyses were carried out in triplicate.
Statistical analysis
All the analyses were carried out in triplicate and the results were reported as mean ± standard deviation. Analysis of variance
and least significant difference tests were conducted to identify differences among the means,p-value<0.05 was regarded as
sig-nificant. Statistical analysis was performed using GraphPad Prism 5.01 (GraphPad Software, San Diego, IL).
Results and discussion
EEP and fractions
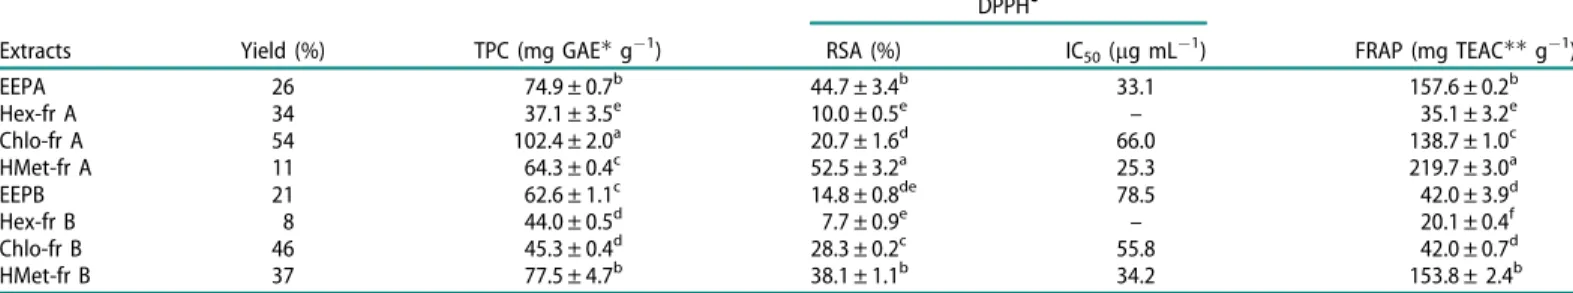
The percent yields of each EEP were EEPA 26%(w/w) and EEPB 21% (w/w), with the calculation based on the weight of crude propolis. When the EEPs were subjected to liquid–liquid frac-tionation with hexane, chloroform and methanol, three fractions were obtained: Hex-fr, Chlo-fr and HMet-fr with yields calcu-lated from the crude weight of EEP (Table 1). The labels A and B are related to the origin of the propolis, as previously stated.
Determination of TPC and antioxidant capacity
Table 1 displays the values obtained for the TPC, using the FC method and the antioxidant capacity obtained through DPPH and FRAP methods.
The FC assay is often used as a measure of TPC in natural products. Generally, there is a positive correlation between this method and other antioxidant capacity measurements. However, FC is known to be non-selective to phenolic compounds, as it can be reduced by non-phenolic compounds such as vitamin C and reducing agents (Prior et al. 2005; de Oliveira et al. 2009). The TPC values ranged from 37.1 to 102.4 mg GAE/g for sample A and between 44.0 and 77.5 mg GAE/g for sample B.
EEPA, Chlo-fr A and HMet-fr B showed the highest TPC: 74.9, 102.4, and 77.5 mg GAE/g, respectively. Hexane extracts showed the lowest values of TPC, as expected, since hexane is less efficient for extraction of polar phenolic compounds from propolis.
DPPH
and FRAP methods are used for the evaluation of antioxidant capacity (Prior et al. 2005; de Oliveira et al. 2009). DPPH
is a stable radical in solution and this assay is routinely, used for assessment of free radical scavenging potential of antiox-idants, through single electron transfer (SET) or by radical quenching via H atom transfer (HAT). The FRAP assay measures the ability of antioxidants to reduce ferric ion in the complex [Fe(III)(TPTZ)2]3þ to [Fe(II)(TPTZ)2]2þ through electron trans-fer and cannot detect compounds that act by HAT (Duraisamy et al.2003; Prior et al.2005; Craft et al.2012; Castro et al.2014). HMet-frA and EEPA, through analysis by the DPPHmethod, showed higher radical sequestrating ability with values of 52.5 and 44.7%, respectively, together with HMet-fr B, with a value of Table 1. Yields of fractions after liquid/liquid extraction, total phenols content (TPC) and values of FRAP and DPPH
(RSA% and IC50) for the EEPs and fractions.
DPPH
Extracts Yield (%) TPC (mg GAEg 1) RSA (%) IC
50(lg mL 1) FRAP (mg TEACg 1)
EEPA 26 74.9 ± 0.7b 44.7 ± 3.4b 33.1 157.6 ± 0.2b
Hex-fr A 34 37.1 ± 3.5e 10.0 ± 0.5e – 35.1 ± 3.2
e
Chlo-fr A 54 102.4 ± 2.0a 20.7 ± 1.6d 66.0 138.7 ± 1.0c
HMet-fr A 11 64.3 ± 0.4c 52.5 ± 3.2a 25.3 219.7 ± 3.0a
EEPB 21 62.6 ± 1.1c 14.8 ± 0.8de 78.5 42.0 ± 3.9d
Hex-fr B 8 44.0 ± 0.5d 7.7 ± 0.9e
– 20.1 ± 0.4f
Chlo-fr B 46 45.3 ± 0.4d 28.3 ± 0.2c 55.8 42.0 ± 0.7d
HMet-fr B 37 77.5 ± 4.7b 38.1 ± 1.1b 34.2 153.8 ± 2.4b
EEPA was obtained from propolis of Ribeira do Pombal and EEPB from propolis collected at Tucano. Hex-fr: hexane fraction; Chlo-fr: chloroform fraction; HMet-fr: hydromethanol fraction.
Gallic acid equivalents.Trolox equivalent antioxidant capacity. 1
Values are mean ± SD. Means with different letters within a column are significantly different (p<0.05). 1888 J. A. XAVIER ET AL.
38.1%, statistically similar to EEPA (Table 1). The other fractions of samples A and B showed lower values. The IC50 is related to the concentration that can reduce DPPH
by 50%. Thus, the lower the concentration, the more efficient the sample is. HMet-fr A showed the lowest IC50 value, of 25.3lg/mL, followed by EEPA and HMet-fr B with 33.1 and 34.2lg/mL, respectively (Table 1).
With regard to the FRAP method, HMet-fr A, EEPA and HMet-fr B also showed higher values, 219.7, 157.6 and 153.8 mg TE/g dry extract, respectively.
FromTable 1, it is possible to observe that EEP and the more polar fractions exhibit higher antioxidant capacity and that extracts from sample A are more promising as antioxidants than those from sample B.
Table 2 reports antioxidant capacity data of different samples of propolis. Some literature results could not be included, since the results were expressed differently. For instance, when caffeic acid was used instead of gallic acid as a standard compound. It is possible to observe (Table 2) that the values of TPC, FRAP and DPPH
(IC50) are close to most of the values found in the litera-ture for other propolis samples, with the exception of some sam-ples from Turkey and Brazil (Group 6) that presented lower results.
Lipid peroxidation measurements
The scavenging free radical capacities do not necessarily correlate with the ability of inhibiting lipid peroxidation. Thus, it is important to evaluate this protective effect through a specific test (Ferreira et al.2013).
The assay was performed using a peroxyl radical-mediated lipid peroxidation membrane model (soy lecithin unilamellar lip-osomes), loaded with the peroxyl radical-sensitive fluorescent probe C11-BODIPY581/591, as described in Materials and methods section.
Figure 2displays lipid peroxidation protection (%) as a func-tion of time (total time of 30 min) for the whole samples and fractions of propolis, in comparison with the positive and nega-tive controls.
It can be observed that in the blank, in the absence of an anti-oxidant, liposomal lipid peroxidation induced by AAPH (gener-ator of peroxyl radical) occurs, which causes the fluorescence decay. The positive control, TroloxVR, as might be expected, inhib-ited lipid peroxidation, offering about 95%membrane protection. All studied extracts showed protection of the membrane from lipid peroxidation. A lower protection of approximately 60% was observed in the Hex-fr B, HMet fr-B and HMet-fr A extracts, while the EEPA, Chlo-fr A, EEPB and Chlo-fr B extracts offered membrane protection similar to TroloxVR within 15 min and, after 30 min, showed about 90%protection, and thus proved to be the most promising result in this study. Comparing the values of
Table 1 with those results of lipid peroxidation, it is possible to conclude that EEPA and EEPB show better results than their fractions.
Anti-glycation activity
There is strong evidence of the involvement of AGEs in the pathophysiology of degenerative chronic diseases. Their incidence and growing concern, around the world, have stimulated research toward the discovery of natural and synthetic compounds capable of inhibiting their potentially harmful effects on health (Ramkissoon et al.2012a; Barbosa et al.2016).
The anti-glycation activity is related to the ability to prevent AGE formation (Chinchansure et al. 2015), determined by meas-uring the fluorescence intensity of BSA-glucose or fructose solu-tions in the presence or absence of the extracts (Ramkissoon et al.2013).
Compounds with antioxidant activity, such as quercetin, gallic acid, luteolin, among others, have been proven to exhibit anti-glycation effects (Chinchansure et al. 2015). As such, in vitro anti-glycation activities for EEPA and EEPB were evaluated.
Anti-glycation activity of EEPA and EEPB represented by IC50 values was 16.5 ± 0.4 and 19.2 ± 1.1lg/mL, respectively. For the pure compound, aminoguanidine, used as an anti-glycation standard, the IC50 value was 7.7 ± 0.6lg/mL and this value was only 2.5 times lower than the values for the crude EEPA and EEPB extracts. Our results are better than the ones obtained by Table 2. Comparative results of TPC, DPPH
and FRAP among extracts of propolis from different regions.
Propolis samples (local) TPC (mg GAE g 1) DPPH
IC50(lg mL 1
) FRAP (mg TE g 1) References
Bahia, Brazil 37.1–102.4 25.3–78.5 20.1–219.0 Present work
Sergipe, Brazil, red 151.5 270.1 – Frozza et al. (2013)
Brazil, green – – 674.0 Skaba et al. (2013)
Canada 65.9–199.3 26.4–101.7 – Cottica et al. (2015)
France 238.6–292.1 – – Boisard et al. (2014)
Brazil, group 12 169.6 – – Cabral et al. (2012)
Brazil, group 6 14.8 – – Cabral et al. (2012)
Minas Gerais, Brazil, green – 24.1 – Szliszka et al. (2013)
China 174.7 32 – Yang et al. (2011)
Turkey 9.2–48.7 – 24.1–59.5 Barlak et al. (2011)
0 5 10 15 20 25 30 35 0
10 20 30 40 50 60 70 80 90 100
EEPA Hex-fr A EEPB Chlo-fr B Chlo-fr A HMet-fr A HMet-fr B Ethanol Trolox
Lipid pe
roxidat
ion protect
ion
(%)
Time (min)
Figure 2. Lipid peroxidation protection (%) provided by the ethanol extracts of propolis and fractions (25lg mL 1), positive control (Trolox 100lM) and the negative control, ethanol. Liposome plus C11-BODIPY581/591 were added in all cases.
Boisard et al. (2014), who studied anti-glycation activity of French poplar propolis and found IC50¼30lg/mL.
Some studies have already evaluated the action of propolis on the inhibition of glycation and as a complementary treatment of diabetes mellitus. Sahebi and Divsalar (2016) investigated the effects of the ethanolic extract of Iranian propolis (EEIP), on the glycation of human haemoglobin by glucose. They demonstrated that haemoglobin glycated by glucose reduced the free amino group content and increased amyloid structures and haeme deg-radation. The utilization of EEIP prevented these changes and decreased the extent of glycation in a concentration-dependent manner.
El-Sayed et al. (2009) have shown that Brazilian green prop-olis extract offered promising antidiabetic and hypolipidemic effects in streptozotocin-induced diabetic rats. Oladayo (2016) studied the effect of ethanolic extract of Nigerian propolis on plasma glucose, showing that it decreased glycated haemoglobin A1c (HbA1c) and some blood lipids such as very low-density lipoprotein (VLDL) and high-density lipoprotein (HDL), in type 1 diabetic rats. They observed a significant reduction in gly-caemia increase, in the rate of HbA1c formation, and in amelio-rated diabetic dyslipidaemia, shown by increasing HDL levels.
The excellent anti-glycation activity of the present EEPA and EEPB makes them exciting candidates for reducing protein glyca-tion, acting as a supplementary therapy for diseases associated with excessive accumulation of AGE, especially for complications of diabetes mellitus (Babu et al. 2013; Singh et al. 2013). Additional studies are, however, mandatory to identify the mech-anism of biological action, as well as thein vivoresponse in suit-able model organisms, before a clinical application.
Cell viability assay
The results revealed that both anti-glycation and antioxidant activities of EEPA and EEPB (Table 1) indicate them to be prom-ising natural products for use as nutraceuticals. A preliminary cell viability assay was performed to determine the cytotoxic effect of different concentrations of the extracts, looking for safety of the present propolis.
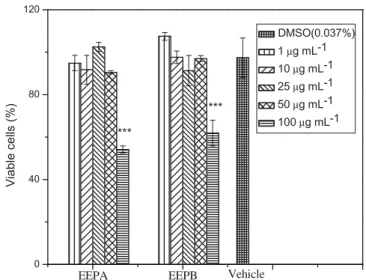
Cytotoxicity of EEPA and EEPB extracts on murine macro-phages, important cells of the immune system, was evaluated, by observing the reduction of MTT. It is possible to observe, in
Figure 3, that the treatment of these cells for 24 h with the extracts up to a concentration of 50lg/mL did not decrease their viabilities. However, when cells were treated with the extracts at a concentration of 100lg/mL, there was a significant reduction (p<0.001) in the viability of macrophages by 55% and 62%,
respectively.
Szliszka et al. (2013) investigated the ethanolic extract of Brazilian green propolis and obtained a similar result. The green propolis extract did not influence cell viability and did not exert a cytotoxic effect at concentrations<50lg/mL, so this is the
rec-ommended concentration for further studies.
Cytotoxicity toward human cancer cell lines was also investi-gated. Table 3 lists the results for EEPA and EEPB. The evalu-ation was conducted in accordance with the protocol of the National Cancer Institute (NCI), which recommends that IC50 values 30lg/mL should be considered significant for crude extracts of plant origin as well as IC50values 4lg/mL for pure substances (Geran et al.1972).
The evaluated samples showed cytotoxicity only on leukemia cell proliferation, showing a certain selectivity. Interestingly, the
two samples studied had no toxic effects on non-tumor cells (PBMC, V79 and L929), with IC50>25lg/mL.
Phenolic compounds identified in extracts of propolis from samples A and B
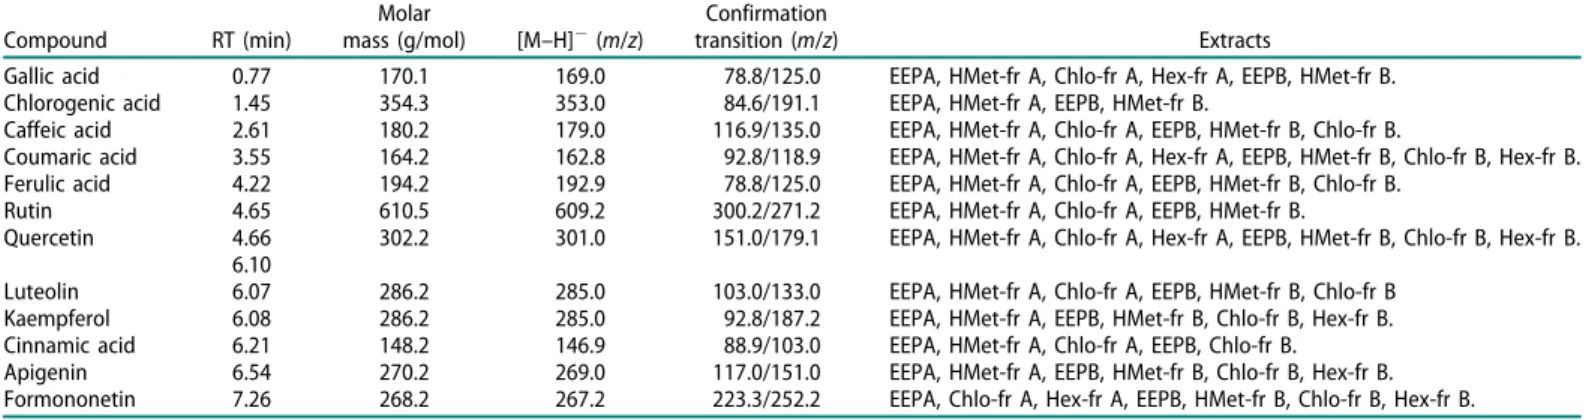
The identification of phenolic compounds in propolis extracts (1 mg/mL) was performed using UHPLC-ESI-MS/MS. Qualitative results are presented inTable 4. The identification of compounds was achieved by matching retention times (tR) and MS/MS frag-mentation patterns, with authentic reference standards. A total of 19 standard compounds in different samples of propolis were monitored, from which, 12 were identified in the present extracts.
Several earlier studies have confirmed the variety in the chem-ical composition of different propolis samples. Righi et al. (2013) characterized the chemical profile of the propolis from different Brazilian locations. They have identified caffeic acid, quinic acid, naringenin, quercetin, ferulic acid, luteolin, apigenin and chrysin in propolis from Parana, Minas Gerais, Goias, Bahia, and Piauı. Fernandes-Silva et al. (2013) analyzed the constituents of the Brazilian green propolis from Minas Gerais and Parana states. All samples showed prenylated phenylpropanoids, such as artepil-lin C, caffeoylquinic acid and flavonoids, such as kaempferide.
0 40 80 120
***
EEPA EEPB
V
iable c
e
lls (
%
)
DMSO(0.037%)
1 µg mL-1 10 µg mL-1 25 µg mL-1 50 µg mL-1 100 µg mL-1
Vehicle ***
Figure 3. Effect of EEPA and EEPB on viability of macrophages (lineage J774), using MTT assay. Cells were treated with EEPA and EEPB (1, 10, 25, 50 or 100lg mL 1) and exposed for 24 h. Data were expressed as % viable cells and were shown as mean ± SEM.p<0.001 versus other concentrations. Negative con-trol was the solvent used to dissolve the extracts.
Table 3. Cytotoxic activity expressed by IC50in lg/mL (95% CI) of EEPA and EEPB, in cancer cell lines, after 72 h exposure, obtained by nonlinear regression for all cell lines from three independent experiments.
Cell lines EEPA EEPB
HL-60 15.42 (13.69–17.84) 19.24 (17.51–21.03) JURKAT 17.30 (15.76–19.22) 14.85 (13.59–16.21) MOLT-4 14.06 (12.83–15.74) 16.28 (15.73–17.52) K562 22.18 (21.94–23.47) 20.37 (19.82–21.56)
PC3 >25 >25
DU145 >25 >25
HCT-116 >25 >25
MCF7 >25 >25
OVCAR-8 >25 >25
MDA-MB435 >25 >25
SF295 >25 >25
MX-1 >25 >25
1890 J. A. XAVIER ET AL.
However, luteolin 5-O-methyl ether was detected only in samples from Parana. From brown propolis, classified as Propolis Type 6, collected in Entre Rios, Bahia, methyl cinnamate, sitosterol cin-namate and ananixanthone were identified (Dos Santos et al.
2017).
In Chinese propolis, Yang et al. (2013) identified rutin, quer-cetin, genistein, curcumin, luteolin and galangin. Morlock et al. (2014) reported the presence of coumaric acid, chrysin, pinocem-brin, galangin, apigenin and narigenin in German propolis. Piccinelli et al. (2013) found kaempferol, apigenin and derivatives of caffeic acid in Algerian propolis. Quercetin was found in Indian propolis (Thirugnanasampandan et al.2012).
Caffeic, coumaric and ferulic acids have been shown to inhibit the proliferation of tumor cells of human lung (A549) and adenocarcinoma (HT29-D4), and significantly reduced super-oxide radical anion production by these cells (Bouzaiene et al.
2015). Gallic acid presented inhibitory effect on proliferation and induction of apoptosis in human breast carcinoma (MCF-7) cells (Wang et al.2014).
Compounds such as caffeic and chlorogenic acids are inhibi-tors of AGEs formation in BSA/glucose (fructose) (Chinchansure et al. 2015) and BSA/methylglioxal systems (Gugliucci et al.
2009). Gallic acid and quercetin had shown inhibitory effects on the production of Amadori products (Chinchansure et al.2015).
It is possible to observe that there are some similarities between compounds identified in this study (Table 4) and com-pounds identified in propolis from different regions. Although belonging to different geographical origins, some compounds are of broad occurrence among samples of propolis, while others are specific and are called chemosystematic markers.
Volatile profile by GC-MS
GC analyses were performed with the two crude samples of prop-olis. Twenty-four volatile compounds were identified by GC-MS, with eight of them, present in both samples.Table 5lists the vola-tile constituents identified according to their chemical classes.
The results showed a quite diversified volatile chemical com-position, with acetic acid, a-pinene, limonene, nonanal, 1,8-cin-eole and spathulenol, standing out as major constituents for sample A, anda-bisabolol, limonene,a-bergamotene and ar-cur-cumene for sample B. The identified compounds have already been found in other propolis samples.
In other samples of Brazilian propolis, with different origins, a-pinene, b-pinene (Torres et al. 2008; Simionatto et al. 2012; Pellati et al. 2013; Kaskonien_e et al. 2014) and 1,8-cineole (Torres et al. 2008; Simionatto et al. 2012) were found as the major volatile compounds.
Bankova et al. (2014) reported the main volatile constituents of propolis from different geographic regions. They had shown that the main constituents of European propolis are sesquiter-penes, followed by aromatic compounds. In Chinese propolis, from 23 regions of China, acetic acid, 2-phenylethyl acetate and naphthalene were found. Oxygenated hydrocarbons, oxygenated sesquiterpenes, monoterpenes (a-terpinene and a-terpineol), aro-matic alcohols and esters were the major volatile compounds of Turkish propolis. In samples of Brazilian green propolis, the main volatile constituents are nerolidol,b-caryophyllene, spatule-nol, d-cadinene and monoterpenes such as a-pinene and b-pinene, some of them also found in the present investigation.
Several studies attribute antioxidant and/or anti-glycation properties to phenolic compounds, flavonoids and terpenes (Sri Harsha et al. 2013; Chinchansure et al. 2015; Sadowska-Bartosz and Bartosz2015). Additionally, it is possible to correlate antioxi-dant and anti-glycation properties.
Naringenin, kaempferol, quercetin and rutin also exhibited protective effects against glycation. Luteolin and apigenin exhibit inhibition in vitro of AGEs by trapping reactive meth-ylglyoxal. Limonene exhibited antidiabetic, anti-glycation and Table 4. Compounds identified by UHPLC-ESI-MS/MS in extracts of propolis samples.
Compound RT (min)
Molar
mass (g/mol) [M–H] (m/z)
Confirmation
transition (m/z) Extracts
Gallic acid 0.77 170.1 169.0 78.8/125.0 EEPA, HMet-fr A, Chlo-fr A, Hex-fr A, EEPB, HMet-fr B. Chlorogenic acid 1.45 354.3 353.0 84.6/191.1 EEPA, HMet-fr A, EEPB, HMet-fr B.
Caffeic acid 2.61 180.2 179.0 116.9/135.0 EEPA, HMet-fr A, Chlo-fr A, EEPB, HMet-fr B, Chlo-fr B.
Coumaric acid 3.55 164.2 162.8 92.8/118.9 EEPA, HMet-fr A, Chlo-fr A, Hex-fr A, EEPB, HMet-fr B, Chlo-fr B, Hex-fr B. Ferulic acid 4.22 194.2 192.9 78.8/125.0 EEPA, HMet-fr A, Chlo-fr A, EEPB, HMet-fr B, Chlo-fr B.
Rutin 4.65 610.5 609.2 300.2/271.2 EEPA, HMet-fr A, Chlo-fr A, EEPB, HMet-fr B.
Quercetin 4.66
6.10
302.2 301.0 151.0/179.1 EEPA, HMet-fr A, Chlo-fr A, Hex-fr A, EEPB, HMet-fr B, Chlo-fr B, Hex-fr B.
Luteolin 6.07 286.2 285.0 103.0/133.0 EEPA, HMet-fr A, Chlo-fr A, EEPB, HMet-fr B, Chlo-fr B Kaempferol 6.08 286.2 285.0 92.8/187.2 EEPA, HMet-fr A, EEPB, HMet-fr B, Chlo-fr B, Hex-fr B. Cinnamic acid 6.21 148.2 146.9 88.9/103.0 EEPA, HMet-fr A, Chlo-fr A, EEPB, Chlo-fr B. Apigenin 6.54 270.2 269.0 117.0/151.0 EEPA, HMet-fr A, EEPB, HMet-fr B, Chlo-fr B, Hex-fr B. Formononetin 7.26 268.2 267.2 223.3/252.2 EEPA, Chlo-fr A, Hex-fr A, EEPB, HMet-fr B, Chlo-fr B, Hex-fr B.
Table 5. Volatile components identified in propolis crude samples (A and B).
Area (%)
Compound Molar mass K.I. Sample A Sample B
Alcohols
2-Phenylethanol 122.16 1113 0.6 –
Aldehydes
Octanal 128.21 1003 1.8 –
Nonanal 142.24 1104 6.3 0.8
Aliphatic and aromatic acids
Acetic acid 60.05 13.2 –
Benzoic acid 122.12 1172 1.2 –
Hexanoic acid 116.15 999 5.8 0.8
Ketones
6-Methyl-5-hepten-2-one 126.20 987 1.1 0.5
2-Nonanone 142.23 1092 1.2 –
Terpenoids
a-Bergamotene 204.35 1447 – 6.0
a-Bisabolol 222.36 1696 – 37.0
a-Copaene 204.35 1390 0.8 0.3
a-Cubebene 204.35 1361 1.0 0.5
a-Curcumene 202.33 1491 – 5.0
a-Farnesene 204.35 1513 2.8 –
a-Gurjenene 204.35 1417 0.7 –
a-Pinene 136.23 940 5.6 –
b-Bourbonene 204.35 1390 0.4 –
b-Caryophyllene 204.35 1434 2.3 1.9
b-Pinene 136.23 982 2.1 –
d-Cadinene 204.35 1537 0.5 2.3
Limonene 136.23 1033 7.1 6.9
antioxidant properties. All of them occur in the presently investigated propolis samples. Terpenoids such as labadiiene exhibited potent inhibitory activities on the formation of fruc-tosamine adducts and a-dicarbonyl compounds similar to that of the flavonoids quercetin and rutin. Triterpenic oleanolic acid showed antiglycation activities greater than aminoguani-dine. Another triterpenic acid, nolic acid, is effective in pre-venting the formation of HbA1c, ROS, AGEs and oxidative stress signalling. b-Carotene, a tetraterpenoid, showed inhibi-tory effects on the formation of AGEs and prevented second-ary structural changes in BSA, resulting from glycation (Chinchansure et al. 2015).
These results suggest the promising functional nature of these natural products. Anti-glycation assays, reported in the current study, may provide a new mechanism by which polyphenol-rich natural products can have a positive effect on human health (Lo et al.2006; Chen et al.2012).
Conclusions
This work has reported, for the first time, a detailed study of propolis produced in the Tucano and Ribeira do Pombal, regions of Bahia. The samples show good antioxidant and anti-glycation capacities, cytotoxicity against several cancer cell lines, such as HL-60, JURKAT and MOLT-4, and a significant number of bio-logically active compounds, suggesting their potential use for pharmaceutical and medicinal purposes, targeting ageing and ROS- and AGE-biochemically based diseases. Along with the pre-sent significant chemical results and the related beneficial health aspects, there is an additional social and economic value for both producers and other local people.
Acknowledgements
The authors are grateful to Prof. Dr. Antonio Euzebio G. Santana (UFAL), Dr. Ingrid Sofia Vieira de Melo (IFAL) and Dr. Fabiana A. Moura (UFAL) for experimental facilities provided and for fruitful discussions on anti-glycation methodology. Priscila Andrade da Silva (UNICAMP) is also thanked for her technical assistance. The authors also thank Prof. Carol Collins (UNICAMP) for helpful discussions.
Disclosure statement
The authors report no conflicts of interest.
Funding
This work was supported by grants from the CNPq [407963/2013-8 and 458114/2014-6], PROCAD/CAPES/3004-2014 and INCT-Bioanalítica.
References
Babu PVA, Liu D, Gilbert ER. 2013. Recent advances in understanding the anti-diabetic actions of dietary flavonoids. J Nutr Biochem. 24:1777–1789. Bankova V, Popova M, Trusheva B. 2014. Propolis volatile compounds,
chemical diversity and biological activity: a review. Chem Cent J. 8:8. Barbosa JHP, Souza IT, Santana AEG, Goulart MOF. 2016. Determination of
advanced glycation (AGES) and lipoxidation (ALES) end products in foods and biological systems: advances, challenges and perspectives. Quim Nova. 39:1–13.
Barlak Y, Deger O, Colak M, Karatayl{SC, Bozday{AM, Y€ucesan F. 2011.
Effect of Turkish propolis extracts on proteome of prostate cancer cell line. Proteome Sci. 9:74
Beaulieu LP, Harris CS, Saleem A, Cuerrier A, Haddad PS, Martineau LC, Bennett SAL, Arnason JT. 2009. Inhibitory effect of the cree traditional
medicine wiishichimanaanh (Vaccinium vitis-idaea) on advanced glycation
endproduct formation: identification of active principles. Phytother Res. 22:741–747.
Benzie IF, Strain JJ. 1996. The ferric reducing ability of plasma (FRAP) as a measure of "antioxidant power": the FRAP assay. Anal Biochem. 39:70–76.
Boisard S, Le Ray AM, Gatto J, Aumond MC, Blanchard P, Derbre S, Flurin
C, Richomme P. 2014. Chemical composition, antioxidant and anti-AGEs activities of a French poplar type propolis. J Agric Food Chem. 62:1344–1351.
Bouzaiene N, Kilani JS, Kovacic H, Chekir-Ghedira L, Ghedira K, Luis J. 2015. The effects of caffeic, coumaric and ferulic acids on proliferation,
superoxide production, adhesion and migration of human tumor cellsin
vitro. Eur J Pharmacol. 766:99–105.
Cabral ISR, Oldoni TLC, Alencar SM, Rosalen PL, Ikegaki M. 2012. The cor-relation between the phenolic composition and biological activities of two varieties of Brazilian propolis (G6 and G12). Braz J Pharm Sci. 48:557–564.
Castro C, Mura F, Valenzuela G, Figueroa C, Salinas R, Zu~niga MC, Torres
JL, Fuguet E, Delporte C. 2014. Identification of phenolic compounds by HPLC-ESI-MS/MS and antioxidant activity from Chilean propolis. Food Res Int. 64:873–879.
Chen L, Hu JY, Wang SQ. 2012. The role of antioxidants in photoprotection:
a critical review. J Am Acad Dermatol. 67:1013–1024.
Chinchansure AA, Korwar AM, Kulkarni MJ, Joshi SP. 2015. Recent develop-ment of plant products with anti-glycation activity: a review. RSC Adv. 5:31113–31138.
Cicco N, Lanorte MT, Paraggio M, Viggiano M, Lattanzio V. 2009. A repro-ducible, rapid and inexpensive Folin–Ciocalteu micro-method in determin-ing phenolics of plant methanol extracts. Microchem J. 91:107–110. Cottica MS, Sabik H, Antoine C, Fortin J, Graveline N, Visentainer JV,
Britten M. 2015. Characterization of Canadian propolis fractions obtained from two-step sequential extraction. LWT-Food Sci Technol. 60:609–614. Craft BD, Kerrihard AL, Amarowicz R, Pegg RB. 2012. Phenol-based
antioxi-dants and the in vitro methods used for their assessment. Compr Rev
Food Sci Food Saf. 11:148–173.
De Oliveira AC, Valentim IB, Silva CA, Bechara EJH, Barros MP, Mano CM, Goulart MOF. 2009. Total phenolic content and free radical scavenging activities of methanolic extract powders of tropical fruit residues. Food Chem. 115:469–475.
Dos Santos D, David JM, David JP. 2017. Composic¸~ao quımica, atividade
cit-otoxica e antioxidante de um tipo de propolis da Bahia. Quim Nova.
40:171–175.
Drummen GPC, Van Liebergen LCM, Op den Kamp JAF, Post JA. 2002.
C11-BODIPY581/591, an oxidation-sensitive fluorescent lipid peroxidation
probe: (micro)spectroscopic characterization and validation of method-ology. Free Radic Biol Med. 33:473–490.
Duraisamy Y, Gaffney J, Slevin M, Smith C, Williamson K, Ahmed N. 2003. Aminosalicylic acid reduces the antiproliferative effect of hyperglycaemia, advanced glycation endproducts and glycated basic fibroblast growth factor in cultured bovine aortic endothelial cells: comparison with aminoguani-dine. Mol Cell Biochem. 246:143–153.
Elosta A, Ghous T, Ahmed N. 2012. Natural products as anti-glycation agents: possible therapeutic potencial for diabetic complications. CDR. 8:92–108.
El-Sayed EM, Abo-Salem OM, Aly HA, Mansour AM. 2009. Potential antidia-betic and hypolipidemic effects of propolis extract in streptozotocin-induced diabetic rats. Pak J Pharm Sci. 22:168–174.
Fernandes-Silva CC, Salatino A, Salatino MLF, Breyer EDH, Negri G. 2013.
Chemical profiling of six samples of Brazilian propolis. Quım Nova.
36:237–240.
Ferreira FR, Valentim IB, Ramones ELC, Trevisan MTS, Olea-Azar C, Perez-Cruz F, Abreu FC, Goulart MOF. 2013. Antioxidant activity of the
mangi-ferin inclusion complex with b-cyclodextrin. LWT – Food Sci Technol.
51:129–134.
Frozza CO, Garcia CSC, Gambato G, Souza MDO, Salvador M, Moura S, Padilha FF, Seixas FK, Collares T, Borsuk S, et al. 2013. Chemical charac-terization, antioxidant and cytotoxic activities of Brazilian red propolis. Food Chem Toxicol. 52:137–142.
Geran RI, Greenberg NH, Macdonald MM, Schumacher AM, Abbott BJ. 1972. Protocols for screening chemical agents and natural products against animal tumors and other biological systems. Cancer Chemother Rep. 3:1–102.
1892 J. A. XAVIER ET AL.
Gugliucci A, Bastos DHM, Schulze J, Souza MFF. 2009. Caffeic and
chloro-genic acids inIlex paraguariensisextracts are the main inhibitors of AGE
generation by methylglyoxal in model proteins. Fitoterapia. 80:339–344. Huang S, Zhang CP, Wang K, Li G, Hu FL. 2014. Recent advances in the
chemical composition of propolis. Molecules. 19:19610–19632.
Kaskoniene V, Ka_ skonas P, Maruska A, Kubiliene L. 2014. Chemometric ana-_
lysis of volatiles of propolis from different regions using static headspace GC-MS. Cent Eur J Chem. 12:736–746.
Lo CY, Li S, Tan D, Pan MH, Sang S, Ho CT. 2006. Trapping reactions of reactive carbonyl species with tea polyphenols in simulated physiological conditions. Mol Nutr Food Res. 50:1118–1128.
MacDonald RC, MacDonald RI, Menco BPM, Takeshita K, Subbarao NK, Hu LR. 1991. Small-volume extrusion apparatus for preparation of large,
uni-lamellar vesicles. Biochim Biophys Acta–Biomembr. 1061:297–303.
Melo ISV, Santos AF, Lemos TLG, Goulart MOF, Santana AEG. 2015.
Oncocalyxone A functions as an anti-glycation agentin vitro. PLoS ONE.
10:1–8.
Morlock GE, Ristivojevic P, Chernetsova ES. 2014. Combined multivariate data analysis of high-performance thin-layer chromatography fingerprints and direct analysis in real time mass spectra for profiling of natural prod-ucts like propolis. J Chromatogr A. 1328:104–112.
Mosmann T. 1983. Rapid colorimetric assay for cellular growth and survival: application to proliferation and cytotoxicity assays. J Immunol Methods. 65:55–63.
Oladayo MI. 2016. Nigerian propolis improves blood glucose, glycated hemo-globin A1c, very low-density lipoprotein, and high-density lipoprotein lev-els in rat modlev-els of diabetes. J Intercult Ethnopharmacol. 5:233–238. Orsolic N, Sirovina D, Koncic MZ, Lackovic G, Gregorovic G. 2012. Effect of
Croatian propolis on diabetic nephropathy and liver toxicity in mice. BMC Complement Altern Med. 12:117–132.
Park YK, Ikegaki M, Alencar SM. 2000. Classification of Brazilian propolis by physicochemical method and biological activity. Mensagem Doce 58:2–7. Pellati F, Prencipe FP, Benvenuti S. 2013. Headspace solid-phase
microextrac-tion–gas chromatography–mass spectrometry characterization of propolis volatile compounds. J Pharm Biomed Anal. 84:103–111.
Pereira AS, Seixas FRMS, de Aquino Neto FR. 2002. Propolis: 100 years of
research and future perspectives. Quım Nova. 25:321–326.
Piccinelli AL, Mencherini T, Celano R, Mouhoubi Z, Tamendjari A, Aquino RP, Rastrelli L. 2013. Chemical composition and antioxidant activity of Algerian propolis. J Agric Food Chem. 61:5080–5088.
Prior RL, Wu X, Schaich K. 2005. Standardized methods for the determin-ation of antioxidant capacity and phenolics in foods and dietary supple-ments. J Agric Food Chem. 53:4290–4302.
Ramkissoon JS, Mahomoodally FM, Ahmed N, Subratty HA. 2012a. Natural inhibitors of advanced glycation end-products. Nutr Food Sci. 42:397–404. Ramkissoon JS, Mahomoodally MF, Ahmed N, Subratty AH. 2012b. Relationship between total phenolic content, antioxidant potential, and anti-glycation abilities of common culinary herbs and spices. J Med Food. 15:1116–1123.
Ramkissoon JS, Mahomoodally MF, Ahmed N, Subratty AH. 2013. Antioxidant and anti-glycation activities correlates with phenolic compos-ition of tropical medicinal herbs. Asian Pac J Trop Med. 6:561–569. Righi AA, Negri G, Salatino A. 2013. Comparative chemistry of propolis
from eight Brazilian localities. Evidence-based Complement Altern Med. 2013:267878.
Sahebi U, Divsalar A. 2016. Synergistic and inhibitory effects of propolis and aspirin on structural changes of human hemoglobin resulting from
glyca-tion: anin vitrostudy. J Iran Chem Soc. 13:2001–2011.
Sadowska-Bartosz I, Bartosz G. 2015. Prevention of protein glycation by nat-ural compounds. Molecules. 20:3309–3334.
Sanchez-Moreno C, A Larrauri J, Saura-Calixto F. 1999. Free radical
scaveng-ing capacity and inhibition of lipid oxidation of wines, grape juices and related polyphenolic constituents. Food Res Int. 32:407–412.
Silva-Carvalho R, Baltazar F, Almeida-Aguiar C. 2015. Propolis: a complex natural product with a plethora of biological activities that can be explored
for drug development. Evidence-Based Complement Altern Med.
2015:206439.
Simionatto E, Facco JT, Morel AF, Giacomelli SR, Linares CEB. 2012. Chiral analysis of monoterpenes in volatile oils from propolis. J Chil Chem Soc. 57:1240–1243.
Singh R, Kaur N, Kishore L, Gupta GK. 2013. Management of diabetic com-plications: a chemical constituents based approach. J Ethnopharmacol. 150:51–70.
Skaba D, Morawiec T, Tanasiewicz M, Mertas A, Bobela E, Szliszka E, Skucha-Nowak M, Dawiec M, Yamamoto R, Ishiai S, et al. 2013. Influence of the toothpaste with Brazilian ethanol extract propolis on the oral cavity health. Evidence-Based Complement Altern Med. 2013:215391.
Slavov A, Trifonov A, Peychev L, Dimitrova S, Peycheva S, Gotcheva V, Angelov A. 2014. Biologically active compounds with antitumor activity in propolis extracts from different geographic regions. Biotechnology. 27:4010–4013.
Szliszka E, Kucharska AZ, Sokoł-ŁE¸towska A, Mertas A, Czuba ZP, Krol W.
2013. Chemical composition and anti-inflammatory effect of ethanolic extract of Brazilian green propolis on activated J774A.1 macrophages. Evidence-Based Complement Altern Med. 2013:976415.
Sri Harsha PSC, Gardana C, Simonetti P, Spigno G, Lavelli V. 2013.
Characterization of phenolics,in vitroreducing capacity and anti-glycation
activity of red grape skins recovered from winemaking by-products. Bioresour Technol. 140:263–268.
Thirugnanasampandan R, Raveendran SB, Jayakumar R. 2012. Analysis of chemical composition and bioactive property evaluation of Indian prop-olis. Asian Pac J Trop Biomed. 2:651–654.
Thomas GR, McCrossan M, Selkirk ME. 1997. Cytostatic and cytotoxic effects
of activated macrophages and nitric oxide donors onBrugia malayi. Infect
Immun. 65:2732–2739.
Toreti VC, Sato HH, Pastore GM, Park YK. 2013. Recent progress of propolis for its biological and chemical compositions and its botanical origin. Evidence-Based Complement Altern Med. 2013:697390.
Torres RNS, Lopes JAD, Moita Neto JM, Cito AMGL. 2008. Volatile
constitu-ents of propolis from Piaui. Quım Nova. 31:479–485.
Uribarri J, Dolores M, Pıa M, Maza D, Filip R, Gugliucci A, Luevano C,
Macıas-Cervantes MH, Bastos DHM, Medrano A, et al. 2015. Dietary
advanced glycation end products and their role in health and disease. Adv Nutr. 6:461–473.
Wang K, Zhu X, Zhang K, Zhu L, Zhou F. 2014. Investigation of gallic acid induced anticancer effect in human breast carcinoma MCF-7 cells. J Biochem Mol Toxicol. 28:387–393.
Xuan H, Wang Y, Li A, Fu C, Wang Y, Peng W. 2016. Bioactive components of Chinese propolis water extract on antitumor activity and quality con-trol. Evidence-Based Complement Altern Med. 2016:9641965.
Yang H, Dong Y, Du H, Shi H, Peng Y, Li X. 2011. Antioxidant compounds from propolis collected in Anhui, China. Molecules. 16:3444–3455. Yang L, Yan Q, Ma J, Wang Q, Zhang J, Xi G. 2013. High performance
liquid chromatographic determination of phenolic compounds in propolis. Trop J Pharm Res. 12:771–776.