A
r
ti
c
le
*e-mail: [email protected]
Physicochemical Characterization of a Hydrophilic Model Drug-Loaded PHBV Microparticles
Obtained by the Double Emulsion/Solvent Evaporation Technique
Paulo V. Farago,
aRenata P. Raffin,
bAdriana R. Pohlmann,
cSílvia S. Guterres
band Sônia F. Zawadzki
*
,daDepartamento de Ciências Farmacêuticas, Universidade Estadual de Ponta Grossa, Av. Carlos Cavalcanti 4749,
84030-900 Ponta Grossa-PR, Brazil
bDepartamento de Produção e Controle de Medicamentos, Faculdade de Farmácia, Universidade Federal do
Rio Grande do Sul, Av. Ipiranga 2752, 90610-000 Porto Alegre-RS, Brazil
cDepartamento de Química Orgânica, Instituto de Química, Universidade Federal do Rio Grande do Sul, CP 15003,
91501-970 Porto Alegre-RS, Brazil
dDepartamento de Química, Universidade Federal do Paraná, CP 19081, 81531-990 Curitiba-PR, Brazil
Micropartículas de poli(3-hidroxibutirato-co-3-hidroxivalerato) (PHBV) contendo um fármaco modelo hidrofílico, o cloridrato de metformina (MH), foram obtidas pela técnica de emulsão múltipla/evaporação do solvente. Diversas formulações foram preparadas, com o objetivo de investigar a influência de cada composição sobre a eficiência de encapsulação (EE). O resultado mais elevado de EE (9,76%) foi verificado quando da simultânea alcalinização e adição de NaCl na fase aquosa externa da formulação. O estudo por MEV das micropartículas revelou morfologia esférica e superfície rugosa. As intensidades de difração cristalina para as micropartículas contendo o MH foram menores do que aquelas observadas para a mistura física. Os resultados obtidos por IVTF sugerem que nenhuma ligação química foi formada entre o polímero e o fármaco. A avaliação por análise térmica indica o surgimento de interações favoráveis entre MH e PHBV. O estudo de liberaçãoin vitro demonstrou a influência do PHBV no perfil de dissolução do MH.
Poly(3-hydroxybutirate-co-3-hydroxyvalerate) (PHBV) microparticles containing a water-soluble model drug, metformin hydrochloride (MH), were obtained by a double emulsion/solvent evaporation technique. Several formulations were prepared in order to investigate the influence of each composition on the encapsulation efficiency (EE). The highest value of EE (9.76%) was obtained using simultaneously pH alkalinization and NaCl addition in the external water phase of the formulation. SEM study revealed a spherical morphology and a rough surface. The crystalline diffraction intensities for the MH-loaded microparticles were lower than that verified for the physical mixture. FTIR results suggested that no chemical bond between the polymer and the drug was formed. Also thermal analyses indicated a favorable interaction between MH and PHBV. In vitro drug release demonstrated the influence of the PHBV on the dissolution profile of MH.
Keywords: PHBV, double emulsion/solvent evaporation technique, hydrophilic model drug,
microparticles
Introduction
Biodegradable polymeric materials have been received increasing interest due to several ecological and recycling aspects.1,2 Among numerous microbial polyesters,
poly(3-hydroxybutirate-co-3-hydroxyvalerate) (PHBV) has been
widely investigated as a biocompatible material suitable for
pharmaceutical and medical applications. The literature reports the use of PHBV in tissue engineering and as drug delivery systems.3-12 Particularly, PHBV exhibits unique and interesting
physicochemical features (e.g. piezoelectricity) in addition to their mechanical properties similar to the polypropylene and other widely used polyesters [e.g. poly(DL-lactide) and poly(DL-lactide-co-glycolide)].13 Moreover, PHBV is a less
Several methods have been used to prepare microparticles, for both natural and synthetic polymers.15
Some of the commonly reported processes of preparing microparticles from biodegradable polymers include polymer phase separation, solvent evaporation and solvent extraction, supercritical fluid and spray drying techniques.16-18 The double emulsion/solvent evaporation
procedure proposed by Ogawa et al.19 represents an easy
and reproducible method that provides uniformity of particle size. This technique has been widely used by several research groups to obtain micro and nanoparticles.20-25 The
typical double emulsion process consists of four steps: (i) primary emulsification: an aqueous solution of the
active agent (internal water phase, w1) is emulsified into
an organic solution containing the biodegradable polymer (oil phase, o); (ii) re-emulsification: the primary emulsion
(w1/o) is further emulsified into a second aqueous phase
containing a stabilizer (external water phase, w2) to form
aw1/o/w2 double emulsion; (iii) solidification: the organic
solvent is removed by evaporation or extraction and then solid microparticles are formed; and (iv) separation and
purification: microparticles are collected by centrifugation or filtration and subsequently dried.26
The double emulsion/solvent evaporation technique is often used for the entrapment of water-soluble bioactive agents, such as proteins, peptides, viral and bacterial antigens into the biodegradable microparticles.25,26 However,
more restrict data are available when this procedure is applied to the entrapment of small hydrophilic drugs into microparticles.27,28 In this paper, metformin hydrochloride
(MH) was the drug chosen as a hydrophilic model because it is an agent extensively used for the management of type 2
Diabetes. Furthermore, MH is a candidate to be formulated
in controlled release systems due to the high incidence of concomitant gastrointestinal symptoms, such as abdominal discomfort, nausea and diarrhea caused by the conventional pharmaceutical dosage forms.29
Hence, the main goal of the present work was to evaluate different formulation parameters to improve the entrapment of the MH into PHBV microparticles using the double emulsion/solvent evaporation technique. Morphological, thermal, spectrometrical and drug release studies were performed to evaluate the microparticulated materials.
Experimental
Materials
Poly(3-hydroxybutirate-co-3-hydroxyvalerate) (PHBV)
(M—
w = 379,160 g mol
–1, 8.70 mol% of hydroxyvalerate)
was kindly provided by PHB Industrial (Serrana, Brazil).
Metformin hydrochloride (MH) (99.8% pure) and polysorbate 80 (Tween® 80) were purchased from
Delaware (Porto Alegre, Brazil). Poly(vinyl alcohol) (PVA, —Mw = 72,000 g mol–1, 88.5 mol% of hydrolysis) was
obtained from Vetec (Rio de Janeiro, Brazil). Other chemicals were of analytical grade and were used as received.
Preparation of PHBV microparticles
According to Table 1, drug-loaded microparticles were prepared using a water-in-oil-in-water (w/o/w) emulsion/
solvent evaporation technique.19,26,28 The basic formulations
were called M1 to M3 depending on the amount of MH in the composition. Additionally, different compositions (formulations designed from M4 to M8) were used to study the influence of the physicochemical changes on the drug entrapment.
Briefly, the MH aqueous solution was emulsified with the PHBV chloroform solution for 2 min using a high-performance disperser (Ultra-Turrax® dispenser
T18N, IKA-Werke, Staufen, Germany) at 18,000 rpm and 40 2 ºC. This emulsion (w1/o) was poured into the external
water phase containing 2% (mass/volume, m/v) PVA at 40 2 ºC, and stirred at 5,000 rpm for 5 min to prepare the second emulsion (w1/o/w2). The multiple emulsion
was kept under constant stirring on a magnetic stirrer at 800 rpm and 30 2º C for 4 h in order to remove the solvent, chloroform. Microparticles were collected by centrifugation (5,000 rpm for 10 min), washed with NaOH aqueous solution (pH 12) twice and dried under vacuum at 50 2 ºC for 4 h. Unloaded-microparticles were also prepared based on M1, M3, M4 and M8 formulations. The composition of these microparticles was the same of those showed in Table 1, in the absence of the drug.
Regarding the physicochemical modifications, changes were performed as indicated in Table 1. In the organic phase, the presence of acetone (25%, v/v) was analyzed. In the external water phase, following compositions were used: a hydroalcoholic solution (50:50 v/v, water:ethanol ratio), an 1 mol L–1 NaOH aqueous solution addition to
adjust the pH value to 12 and/or a salt addition (20% NaCl solution, m/v). Also a physical mixture (called as PM) (1:99 m/m, MH:PHBV ratio) was prepared as control.
Water content
Drug loading and encapsulation efficiency
In a volumetric flask, an amount of loaded- and unloaded-microparticles (50 mg) was dissolved in chloroform (4 mL) and stirred at 1,000 rpm for 12 h. Then, distilled water (2 mL) was added and the mixture was stirred at 1,000 rpm for 2 h. This previous extraction was repeated twice and an emulsion (10 mL) was obtained. The chloroform/distilled water emulsion was centrifuged at 5,000 rpm for 20 min. The aqueous supernatant was removed and filtrated through a poly(vinylidene fluoride) membrane (Durapore®membrane, hydrophilic
filter, 0.22 µm pore size, Millipore, Bedford, USA). After suitable dilution, the drug concentration was spectrophotometrically determined at 232 nm30 (Hewlett
Packard 8452A UV-Vis diode array spectrometer, Boeblingen, Germany) in triplicate. UV method for MH quantification was previously validated in terms of linearity, precision, reproducibility, accuracy and specificity.31 The concentration range varied from 1.0 to
25.0 g mL–1. Linearity was 0.99945 and the detection
limit was 0.27882 g mL–1. The accuracy was 98.78%
for 12 g mL–1, 97.23% for 15 g mL–1 and 96.42% for
20 g mL–1. The repeatability presented a relative standard
deviation (RSD) = 3.56 and the intermediate precision showed a RSD = 3.11. The encapsulation efficiency (EE) was calculated using the equation 1.
(1)
whereCrec is the experimental drug concentration recovered
after microencapsulation and C
theor is the theoretical drug
concentration in the formulation.
Scanning electron microscopy analysis
Microparticles were deposited on a copper stub and sputtered with gold (Balzers sputtering SCD-030, Bingen, Germany). The shape and the surface of the microparticles were analyzed by scanning electron microscopy (SEM) (Jeol scanning microscope JSM 6360 LV, Tokyo, Japan). The SEM micrographs were carried out using an accelerating voltage of 10 or 15 kV.
Particle size and size distribution
The particle size and size distribution of the microparticles were measured by laser diffraction spectrometry (LDS) in a Cilas 920 L apparatus (Marseille, France). The dried powder samples were suspended in filtered water and sonicated into the ultrasonic bath coupled to the equipment for 1 min before measurements. Then, the mean diameters standard deviations and the size distributions were determined. The span was calculated using the equation 2.
(2)
where d(v,90), d(v,10), and d(v,50) are the particle diameters determined, respectively, at the 90th, 10th, and 50th percentile
of the undersized particle distribution curve.
X-ray diffraction studies
Wide-angle X-ray diffraction (XRD) was performed with a Shimadzu X-ray diffractometer XRD-6000 (Kyoto, Japan) for pure MH, PHBV, loaded- and
unloaded-Table 1. Composition of the MH-loaded PHBV microparticles
Composition Formulation
M1 M2 M3 M4 M5 M6 M7 M8
Internal water phase
MH (g) 2.0 1.0 0.2 0.2 0.2 0.2 0.2 0.2
distilled water (pH = 6.63) /(mL) 6 6 6 6 6 6 6 6
Organic phase
PHBV /(g) 2 2 2 2 2 2 2 2
chloroform /(mL) 40 40 40 30 40 40 40 40
acetone /(mL) 10
polysorbate 80 /(g) 0.25 0.25 0.25 0.25 0.25 0.25 0.25 0.25
External water phase
PVA /(g) 4 4 4 4 4 4 4 4
sodium chloride /(g) 40 40
ethanol /(mL) 100
distilled water (pH = 6.63) /(mL) 200 200 200 200 200 100
microparticles and physical mixture. The 2 was increased from 5o to 50o at a scan rate of 2o min–1. The data were
acquired using a Cu-K source ( = 1.5418 Å) at 40 kV and 40 mA.
Fourier-transformed infrared spectroscopy analysis
Fourier-transformed infrared (FTIR) spectra (Bio-Rad Laboratories, Excalibur series FTS 3500GX, Cambridge, USA) of raw materials, microparticles and physical mixture were carried out using KBr pellets. Thirty-two scans were recorded for each sample at a resolution of 4 cm–1 over the
wavenumber range of 4000 to 400 cm–1.
Thermal analyses
Thermal characterization was performed by differential scanning calorimetry (DSC) in a Netzsch DSC 204 F1 calorimeter (Netzsch Instruments, Burlington, USA). About 5 mg of each sample (MH, PHBV, microparticles and physical mixture) was put into a 10 L aluminum pan. Each capsule was sealed and the material was analyzed. All the scans were carried out under nitrogen stream (15 mL min–1). Indium was used as reference. DSC curves
were obtained from – 20 ºC to 200 ºC at an average heating rate of 10 ºC min–1.
Thermal degradation was investigated by dynamic thermogravimetry (TG). TG measurements were carried out with a Netzsch TG 209 F1 analyzer (Netzsch Instruments, Burlington, USA). The mass of each specimen was 10 mg. Thermogravimetry analysis (TGA) curves and derivative thermogravimetry (DTG) curves were recorded in the course of heating from room temperature to 800 ºC at a rate of 20 ºC min–1 using nitrogen atmosphere.
In vitro drug release
Thein vitro drug release experiments were carried out
using a flow-through cell method. The apparatus consisted of recycling flow-through cells (Desaga, Wiesloch, Germany) connected to a peristaltic pump (Gilson, Villiers Le Bel, France). The flow rate was 1 mL min–1. MH released
from the microparticles M8 (formulation prepared from a simultaneously pH alkalinization and NaCl addition in the external water phase) was studied at 37 ± 0.5 ºC in 0.1 mol L–1 HCl for 180 min. An exact amount of
microparticles (equivalent to 20 mg of MH) was compressed using a laboratory hydraulic press (Perkin Elmer, model 15.011, Norwalk, USA) equipped with a 13 mm flat faced punch. The direct compression was performed at 3 t cm–2
for 2 min. The compressed tablets (n = 3) contained no
other pharmaceutical excipients. A previously obtained tablet was placed in each flow-through cell (n = 3). At
predetermined time intervals, samples were collected, diluted (if necessary), and analyzed spectrophotometrically at 232 nm30 (Hewlett Packard 8452A UV-Vis Diode Array
Spectrometer, Boeblingen, Germany). The measurements were conducted in triplicate. Also compressed tablets containing pure MH (20 mg) were prepared under the same reported conditions.
The profiles were analyzed by model-dependent methods32,33 using the MicroMath Scientist® 2.01 software
(Salt Lake City, USA). Profiles were tested to fit mono and biexponential equations (equations 3 and 4).
C = 100 (1-e-kt) (3)
C = 100 [1-(Ae-t + Be-t)] (4)
whereC is the concentration dissolved at time t;k, and
represent the apparent dissolution rate constants and A
andB are the parameters which reflect the portion of the
initial concentrations of drug that contributed to the burst and sustained phases, respectively.
In order to have some insight into the drug release mechanism, a very simple and semi-empirical equation to describe drug release from polymeric systems, the power law (Korsmeyer-Peppas model)34, was also applied
(equation 5).
ft = atn (5)
whereftis the drug dissolved fraction at time t,nis the
release exponent, indicative of the mechanism of the drug release and ais the constant incorporating structural and
geometric characteristics of the drug dosage form.
Results and Discussion
The microparticles M1 to M8 were successfully obtained applying the water-in-oil-in-water (w/o/w)
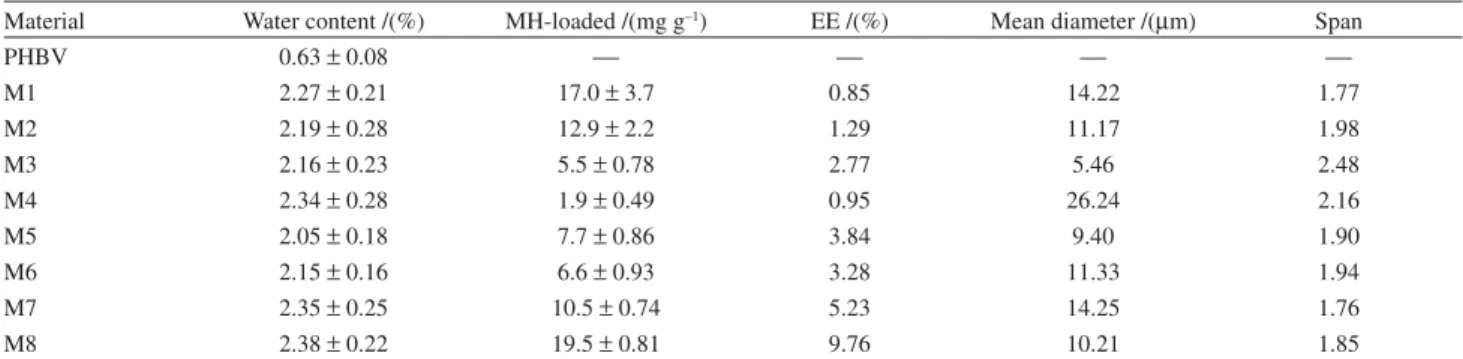
emulsion/solvent evaporation technique. After vacuum drying, the materials showed powder aspect and pale-yellow color similar to PHBV. The water contents were indicated in Table 2. Loaded-microparticles showed increased water content when compared with MH (0.84 0.13%) and PHBV (0.63 0.08%).
Drug loading and encapsulation efficiency
The drug content (mg g–1) and encapsulation efficiency
Table 2. Microparticles M1, M2 and M3 showed low encapsulation efficiencies, 0.85%, 1.29% and 2.77%, respectively. Considering that MH is a hypoglycemic agent with a low molecular weight (MW = 165.63 g mol–1) and high solubility in water (up
to 300 mg mL–1 at 25 ºC)35,36, the low EE values obtained
for these microparticles can be justified by a substantial migration of the drug from the primary emulsion to the external aqueous phase during the emulsification and/or solvent evaporation procedures. Comparing EE for M1, M2 and M3 it can be noted that the lower the drug concentration in the organic phase was, the higher the EE value was. To circumvent the low EE values obtained for M1 to M3, other formulations were prepared by the double emulsion/solvent evaporation technique as summarized in Table 2.
When a quarter of chloroform volume was replaced by acetone (formulation M4), the EE remained low (0.95%).
The use of salt (formulation M5) or ethanol (formulation M6) in the external aqueous phase showed EE values slightly higher (3.84% and 3.28%, respectively). The performed change to an alkaline external aqueous phase (pH = 12) caused a considerable increase in the EE (5.23%) as observed for the formulation M7. Moreover, the highest increase in the EE (9.76%) was verified for the microparticles M8. In this formulation, a simultaneous alkaline solution (pH = 12) and salt addition were used in the external water phase.
Freitaset al.22have been reviewed some approaches to
preventing loss of the bioactive hydrophilic compounds in the microencapsulation process by the emulsion/solvent evaporation technique. Some of these proposed changes were performed in the current study as formulations M4 to M8 and usually resulted in higher EE values.
Regarding that MH is an organic alkaline compound (pka = 12.40),35 the presence of drug dissociated species
(and its resulting solubility in water) can be affected by the pH changes. Consequently, an external alkaline medium
was used to decrease the drug solubility in the continuous phase which achieved an increment of the hydrophilic drug entrapment into the MH-loaded microparticles as previously observed in the literature.22,37 Also the addition
of electrolytes was a feasible reported approach to increase the osmotic pressure of the external phase which produced enhanced EE values.22
Furthermore, values of EE between 10 and 15% were considered appropriate for the encapsulation of small water-soluble drugs. Sodium cromoglycate-loaded PLGA particles showed EE between 10% and 15%,38 buformin
tosylate-loaded methacrylic microparticles had EE close to 15%39 and chlorhexidine digluconate-loaded PLGA
microparticles presented EE of about 10%.40
Characterization of microparticles
The microparticles M1 to M8 were spherically shaped with a rough surface observed by SEM photomicrographs as showed for M4 and M8 (Figure 1, a,b). Similar
morphological data were provided by Maia et al.14 when
PHBV microparticles were prepared by single emulsion/ solvent evaporation technique. In some of the obtained formulations, pores were also verified on the microparticles surface (Figure 1, a,b). Furthermore, no MH crystal was
observed on the materials surface.
The particle size and size distribution obtained by the LDS measurements are indicated in Table 2. Microparticles M1, M2, M5, M6, M7 and M8 presented mean sizes
Table 2. Water content,1 MH-loaded,1 encapsulation efficiency,2 particle size and span for PHBV and microparticulated materials
Material Water content /(%) MH-loaded /(mg g–1) EE /(%) Mean diameter /( m) Span
PHBV 0.63 0.08
M1 2.27 0.21 17.0 3.7 0.85 14.22 1.77
M2 2.19 0.28 12.9 2.2 1.29 11.17 1.98
M3 2.16 0.23 5.5 0.78 2.77 5.46 2.48
M4 2.34 0.28 1.9 0.49 0.95 26.24 2.16
M5 2.05 0.18 7.7 0.86 3.84 9.40 1.90
M6 2.15 0.16 6.6 0.93 3.28 11.33 1.94
M7 2.35 0.25 10.5 0.74 5.23 14.25 1.76
M8 2.38 0.22 19.5 0.81 9.76 10.21 1.85
1 mean (n = 3) ± standard deviation; 2 mean (n = 3).
Figure 1. Photomicrographs of the MH-loaded PHBV microparticles,
between 9.40 and 14.25 m presenting span values lower
than 2. The lowest mean size (5.46 m) and the highest span
(2.48) were verified for the formulation M3. Furthermore, the highest mean diameter (26.24 m) was observed for M4, with a span of 2.16. In general, microparticles sized
around 10 m have a low uptake by the intestinal tissue.41
In addition, oral administration of these microparticles can provide sustained drug effect due to their prolonged gastrointestinal transit time.41
Regarding the span values (Table 2), all microparticulated
materials indicated an adequate size distribution as reported for other evaluated systems.42 The formulation M8 was
chosen to further evaluations due to the highest EE (9.76%), adequate mean diameter (10.21 m) and span (1.85), as
reported in the literature.41,42
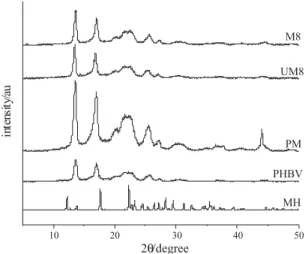
Concerning the XRD analysis, the MH-loaded microparticles showed similar profile to the pure PHBV and unloaded-microparticles as can be verified for microparticles M8 (M8) in Figure 2. However, the crystalline diffraction intensities for the MH-loaded microparticles were lower than that verified for the physical mixture (PM) (Figure 2). Therefore, these results suggest that the encapsulation process decreased the crystallinity of the system (drug + polymer), and the MH is mainly dispersed into the microparticles.
The FTIR spectra performed for MH, PHBV, physical mixture (PM), microparticles M8 (M8) and unloaded-microparticles M8 (UM8) are shown in Figure 3. The FTIR spectrum of pure MH showed two typical bands at 3372 and 3298 cm–1 relative to the N–H primary stretching
vibration and a band at 3175 cm–1 due to the N–H secondary
stretching, and characteristic bands at 1628 and 1569 cm–1
assigned to C=N stretching. PHBV exhibited a strong band
at 1720 cm–1 due to the C=O stretching. Characteristic
bands from 800 to 975 cm–1 corresponded to symmetric
–C–O–C– stretching vibration. Moreover, the antisymmetric –C–O–C– stretching leads to bands between 1060 and 1150 cm–1. The physical mixture (PM) and microparticles
M8 (M8) spectra presented band assignments at the same wavenumber range with a remarkable reduction in intensity of the characteristic MH bands due to the low content of the drug in these materials. Unloaded-microparticles M8 (UM8) showed the typical assignments observed for PHBV.
The thermograms obtained for MH, PHBV, physical mixture (PM), microparticles M8 (M8) and unloaded-microparticles M8 (UM8) are shown in Figure 4. For the formulation M8 (19.5 ± 0.81 mg g–1, EE = 9.76%),
a reduction in the glass transition temperature (Tg = – 6.6 ºC) was verified as comparing with the pure PHBV (Tg = – 0.3 ºC) and UM8. This fact indicates that the polymer becomes less crystalline and the MH can be in an amorphous state or in disordered crystalline phase of a molecular dispersion in the PHBV polymeric matrix. Nevertheless, regarding the melting temperature (Tm) data, formulation M8 (M8) revealed a change in the profile with a possible material degradation due to the heating flow used. In addition, when a low amount of MH was loaded, no changes on DSC profile were observed comparing to the thermal data for PHBV.
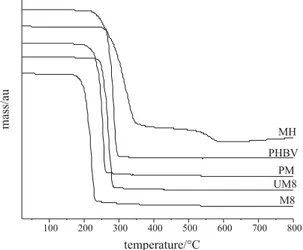
Concerning the TGA curves (Figure 5), the increase of the drug incorporation provided a thermal degradation of the polymeric material in lower temperatures. This result allows implying that MH is responsible for smoothing the polymeric structure as a plasticizer, which corroborates with the previous reported result (DSC).
Figure 2. Wide-angle X-ray diffraction patterns of MH, PHBV, physical
mixture (PM), unloaded-microparticles M8 (UM8) and formulation M8 (M8).
Figure 3. Fourier-transformed infrared spectra of MH, PHBV, physical
Figure 4. Thermograms of MH, PHBV, physical mixture (PM), unloaded-microparticles M8 (UM8) and formulation M8 (M8).
Figure 5. Thermogravimetric curves of MH, PHBV, physical mixture
(PM), unloaded-microparticles M8 (UM8) and formulation M8 (M8).
Figure 6.In vitro release profiles in 0.1 mol L–1 HCl of MH from tablets
of microparticles M8 (M8) and pure drug (MH).
In vitro drug release
As compressed tablets, the in vitro drug release
experiment was performed for the microparticles M8 (M8) and compared to the MH dissolution profile (Figure 6). Using the flow-through cells, the tablets of pure MH showed dissolution of 88.08 3.21% after 60 min and 99.84 0.07% after 120 min. In opposite, MH dissolution values of 69.90 2.94% and 93.98 1.96% have been observed for tablets of M8, respectively after 60 and 120 min. For tablets obtained from the microparticulated system, a drug dissolution of 99.02 0.43% was verified after 150 min.
The release profiles were fitted to mathematical models and the selection of the best model considered the correlation coefficient (r), the model selection criteria (MSC) and the graphic adjustment. For the tablets of pure drug, the monoexponential model fitted better the
dissolution data (r = 0.999 and MSC = 5.05) than the other models. The apparent rate constant was k = 0.0355 min–1.
For the tablets of microparticles M8, the best fitting was the biexponential equation (r = 0.998, MSC = 4.88). The burst release apparent rate constant was = 0.1545 min–1 and the
slow release apparent rate constant was = 0.0192 min–1.
Thesein vitro drug release data demonstrated the influence
of PHBV on the dissolution profile of MH.
The modeling of the microparticles M8 profile as compressed tablets showed n value of 0.82 using the
Korsmeyer-Peppas model. The value of n between 0.43 and
0.85 for spherical particles indicates that the release mechanism is governed by an anomalous transport.34 Therefore the release
mechanism is related to a superposition of a Fickian diffusion of MH from the PHBV microparticles as well as to the solvent access into the microparticulated system.
Conclusions
MH-loaded and unloaded PHBV microparticles were successfully prepared by the double emulsion/solvent evaporation technique. An adequate EE value for the hydrophilic model drug was verified using simultaneously an alkaline medium (pH = 12) and the presence of NaCl in the external water phase. Particles were spherically shaped with a narrow size distribution. XRD, FTIR and DSC analyses demonstrated that the MH was molecularly dispersed in the PHBV microparticles. TGA indicated a plasticizer effect of drug among the polymeric chains. In vitro drug release confirmed the influence of PHBV on the
delay of the drug dissolution.
Acknowledgments
(Federal University of Paraná) for the SEM analyses. The authors are also grateful to CNPq (Brazil) and Fundação Araucária (Brazil) for the financial supports.
References
1. Pich, A.; Schiemenz, N.; Corten, C.; Adler, H.-J. P.; Polymer
2006,47, 1912.
2. Häberlein, H.; Seliger, H.; Kohler, R.; Sulzberger, P.; Polímeros
2005,15, 122.
3. Chen, G. Q.; Wu, Q.; Biomaterials2005,26, 6565.
4. Köse, G. T.; Korkusuz, F.; Özkul, A.; Soysal, Y.; Özdemir, T.; Yildiz, C.; Hasirci, V. Biomaterials2005,26, 5187.
5. Sun, J.; Wu, J.; Li, H.; Chang, J.; Eur. Polym. J.2005,41, 2443.
6. Rossi, S.; Azghani, A. O.; Omri, A.; J. Antimicrob. Chemoth.
2004,4, 1013.
7. Köse, G. T.; Korkusuz, F.; Korkusuz, P.; Purali, N.; Özkul, A.; Hasirci, V. Biomaterials2003,24, 4999.
8. Köse, G. T. ; Kenar, H. ; Hasirci, H., Hasirci, V.; Biomaterials
2003,24, 1949.
9. Baran, E. T.; Özer, N.; Hasirci, V.; J. Microencapsul.2002,19, 363.
10. Chen, J.; Davis, S. S.; J. Microencapsul.2002,19, 191. 11.ùendil, D.; Gürsel, I.; Hasirci, V.; Turk. J. Med. Sci. 2000,30,
9.
12.ùendil, D.; Gürsel, I.; Wise, D. L.; Hasirci, V.; J. Control. Release1999,59, 207.
13. Holmes, P. A.; Phys. Technol.1985,16, 32.
14. Maia, J. L.; Santana, M. H. A.; Ré, M. I.; Braz. J. Chem. Eng.
2004,21, 1.
15. Zidan, A. S.; Sammour, O. A.; Hammad, M. A.; Megrab, N. A.; Hussain, M. D.; Khan, M. A.; Habib, M. J.; AAPS PharmSciTech
2006,7, E1.
16. Ghosh, S. K.; F u n c t i o n a l C o a t i n g s b y Po l y m e r Microencapsulation, Wiley-VCH: Weinheim, 2006.
17. Benoit, J. P.; Marchais, H.; Rolland, H.; Velde, V. V.; Microencapsulation: Methods and Industrial Applications; Benita, S., ed.; Marcel Dekker: New York, 1996, ch. 3. 18. Deasy, P. B.; Microencapsulation and related drug processes,
Marcel Dekker: New York, 1984.
19. Ogawa, Y.; Yamamoto, M.; Okada, H.; Yashiki, T.; Shimamoto, T.; Chem. Pharm. Bull.1988,36, 1095.
20. Virto, M. R.; Elorza, B.; Torrado, S.; Elorza M. L.; Frutos, G.; Biomaterials2007,28, 877.
21. Chognot, D.; Léonard, M.; Six, J. L.; Dellacherie, E.; Colloids Surf., B 2006,51, 86.
22. Freitas, S.; Merkle, H. P.; Gander, B.; J. Control. Release2005,
102, 313.
23. Freiberg, S.; Zhu, X. X.; Int. J. Pharm.2004,282, 1. 24. Rosca, I. D.; Watari, F.; Uo, M.; J. Control. Release2004,99,
271.
25. Couvreur, P.; Blanco-Prieto, M. J.; Puisieux, F.; Roques, B.; Fattal, E.; Adv. Drug. Del. Rev.1997,28, 1997.
26. Meng, F. T.; Ma, G. H.; Qiu, W.; Su, Z. G.; J. Control. Release
2003,91, 407.
27. Ito, F.; Fujimori, H.; Makino, K.; Colloids Surf., B 2007,54, 173.
28. Sohier, J.; Dijkhuizen-Radersma, R.; Groot, K.; Bezemer, J. M.;Eur. J. Pharm. Biopharm.2003,55, 221.
29. Inzucchi, S. E.; JAMA2002,287, 360.
30. United States Pharmacopeial Convention; United States Pharmacopeia, 28th ed., USP Convention: Rochville, 2005. 31. International Conference on Harmonisation; Validation of
Analytical Procedures: Metodology, ICH: London, 1996. 32. Beck, R. C. R.; Pohlmann, A. R.; Benvenutti, E. V.; Dalla Costa,
T.; Guterres, S. S.; J. Braz. Chem. Soc.2005,16, 1233. 33. Schaffazick, S. R.; Pohlmann, A. R.; Mezzalira, G.; Guterres,
S. S.; J. Braz. Chem. Soc.2006,17, 562.
34. Siepmann, J.; Peppas, N. A.; Adv. Drug. Deliv. Rev.2001,48, 139.
35. Merck & Company Incorporated; The Merck Index, 13th ed., Merck & Company Incorporated: New Jersey, 2001.
36. Bretnall, A. A.; Clarke, G. S.; Analytical profiles of drug substances and excipients; Brittain, H. G., ed.; Academic Press: San Diego, 1998, ch. 25.
37. Blanco Prieto, M. J.; Fattal, E.; Gulik, A.; Dedieu, J. C.; Roques, B. P.; Couvreur, P.; J. Control. Release1997,43, 81. 38. Peltonen, L.; Aitta, J.; Hyvönen, S.; Karjalainen, M.; Hirvonen,
J.;AAPS PharmSciTech.2004,5, 1.
39. Fundueanu, G.; Mocanu, G.; Constantin, M.; Carpov, A.; Bulacovschi, V.; Esposito, E.; Nastruzzi, C.; Int. J. Pharm.
2001,218, 13.
40. Yue, I. C.; Poff, J.; Cortés, M. E.; Sinisterra, R. D.; Faris, C. B.; Hildgen, P.; Langer, R.; Shastri, V. P.; Biomaterials2004,
25, 3743.
41. Desai, M. P.; Labhasetwar, V.; Amidon, G. L.; Levy, R. J.; Pharm. Res.1996,13, 1838.
42. Oneda, F.; Ré, M. I.; Powder Technol.2003,130, 377.
Received: October 31, 2007