Article
*e-mail: [email protected]
Determination of p
K
aValues of Some Sulfonamides by LC and LC-PDA Methods in
Acetonitrile-Water Binary Mixtures
Nurullah Şanli,*,a Senem Şanli,a Güleren Özkanb and Adil Denizlic
aDepartment of Chemistry, Faculty of Science and Arts, Hitit University, 19040, Çorum, Turkey
bDepartment of Chemistry, Faculty of Science and Arts, Süleyman Demirel University, 32100,
Isparta, Turkey
cDepartment of Chemistry, Faculty of Science, Hacettepe University, 06800, Beytepe,
Ankara, Turkey
As constantes de dissociação de sete sulfonamidas antibióticas, sulfadiazina, sulfatiazol, sulfamerazina, sulfametazina, sulfamonometoxina, sulfadoxina e sulfametoxazol, foram determinadas em diferentes misturas binárias acetonitrila-água (15, 30, 40, 50% (v/v)) usando cromatograia líquida de fase reversa. Um método usando espectros de absorbância no máximo dos picos cromatográicos previamente obtidos foi também aplicado para determinar os valores de pKa. Este método pode ser aplicado a dados oriundos de equipamentos LC-UV (com detecção por arranjo de diodos, PAD) retendo todas as vantagens dos métodos LC e espectrofotométricos. Correlações lineares foram observadas quando os valores calculados de pKa das sulfonamidas em diferentes misturas de solventes foram comparados com a fração molar da acetonitrila.
The dissociation constants of seven sulfonamide antibiotics, sulfadiazine, sulfathiazole, sulfamerazine, sulfamethazine, sulfamonomethoxine, sulfadoxine and sulfamethoxazole, have been determined in different acetonitrile-water binary mixtures (15, 30, 40, 50% v/v) by means of reversed-phase liquid chromatographic data. Also, a method based on the absorbance spectra at the maximum of chromatographic peaks previously obtained has been applied to determine the pKa values. This method can be applied to data obtained from LC-UV (photodiode array detection (PDA)) instruments and retains all the advantages of LC and spectrophotometric methods. Linear relationships were observed when the calculated pKa values of sulfonamides in different solvent mixtures were plotted against the acetonitrile molar fraction.
Keywords: sulfonamides, liquid chromatography, PDA, pKa values
Introduction
Sulfonamides (SAs, substituted amides of sulfanilic acid at the N-1 position) are bacterial and anti-infective compounds used preferably in farm animals for the treatment of a variety of bacterial infections. In food-producing animals SAs are used not only for the treatment of several diseases but also for prophylactic purposes and/or for promotion of growth. A major concern with the use of these compounds is that residues may be present in animal food products and may pose a health
threat to consumers.1-5
Over the years, several separation methods with several detectors have been developed and used for the determination of SAs in various samples. These procedures have generally employed reversed-phase high performance
liquid chromatography (RP-HPLC) with either UV,6,7
luorimetric8,9 or electrochemical10 detection techniques.
The used mobile phase was usually composed of a relatively
high proportion of an organic solvent (e.g. acetonitrile
(MeCN) or methanol) and an acidic aqueous buffer in order to elute SAs from the column in a few minutes. The low pH of the buffer was intended to keep SAs in its neutral form given that this compound may be ionized at high pHs.
The dissociation constant (pKa) of a drug molecule is
excretion and toxicity researches because it governs solubility, absorption, distribution, and elimination of
substances.11 Also, the pK
a values constitute important data
for thorough understanding of certain chemical phenomena such as biological uptake, and the binding of these molecules to environmental matrices and forming chelates with metallic
cations. The drugs’ pKa data are applied to estimate the
major species of pharmaceuticals present in the environment (usually in neutral pH range) and dosage-form development. The protonation of the analyte in HPLC is regarded as a secondary chemical equilibrium, the irst being the distribution equilibrium of the solute between the mobile and stationary phase. The secondary equilibrium is controlled by both the pH of the mobile phase and the ratio of the studied organic modiier. The basic theory of these
equilibria has been worked out in the 1970s and 1980s.12,13
The analyte retention in reversed-phase chromatography represents the molecular fraction weighted average of the retention of the dissociated and undissociated forms.
In the study of dissociation equilibria by reversed phase liquid chromatography, the compounds under study can be considered to be typical amphoteric compounds throughout the working pH range. The overall dissociation process can be shown as:
(1)
The molecular form HB, ionizes in a cationic form,
H2B+, as the pH decreases, and ionizes in an anionic
form, B-, as the pH increases. Figure 1 shows the two-step
dissociation pathway of sulfonamides. Ka1 and Ka2 are the
dissociation constants of the aromatic amine and sulfonic groups, respectively.
The expression of the observed retention factors
(k = tR – to / to, where tR is the analyte retention time and
to is the void volume) can be given by
(2)
where k0, k-1 and k1 are the retention factors of the neutral,
the anionic, and the cationic forms of the ampholyte and Ka1
and Ka2 are the corresponding acid dissociation constants,
respectively.
Debye-Hückel equation was used to compute the activity coeficients:
(3)
where γ is the activity coeficient of the involved species,
z is the ion charge of the ion and I the ionic strength of the
solution. A and a0B values for MeCN-water mixtures are
taken from Barbosa et al.14-16 The variation of the activity
coeficients is changed in the range of 0.994 to 0.881 in the different mobile phases and the pH values.
There are lots of pKa determination techniques for
compounds of pharmaceutical or biological interest
such as potentiometric titrations,17,18 UV-Vis,19,20 LC21,22
and software computational prediction.23,24 Among these
techniques, liquid chromatography is used as a powerful method for determination of dissociation constants because it requires only small quantity of compounds, studied samples do not need to be pure and poor water solubility is not a serious drawback. This method does not requires measuring solute or titrant concentrations, just only retention times. Also, calculation is straightforward and independent of solute purity. Also a method based on the absorbance spectra at the maximum of chromatographic peak obtained along with photo diode array (PDA) detection has been applied. This method can be applied to data obtained from LC-PDA instruments and retains all the advantages of LC and spectrophotometric methods, such as the possibility of working with impure samples.
SAs contain ionogenic functions such as aromatic amine (H3N(+)-C
6H4-SO2-NHR) (pKa1) and sulfonic (H2N-C6H4
-SO2-N(-)-R) (pK
a2) groups, respectively. Their retention
on column depends on the percentage of ionized and non-ionized species of each compound. Thus, knowledge of the acid-base dissociation constants of SAs in MeCN-water mixtures, which are usually used as the mobile phase, can help to improve the analytical method and can lead to a better understanding of the chromatographic behavior of these compounds. Although there are several publications related to the dissociation constants of SAs in
water,18,25–27 but there are no data on the pK
avalues of SAs
in MeCN-water binary mixtures, which is the most widely used mobile phase for the separation of these compounds using liquid chromatography.
In this work, the pKa values of the seven SAs, sulfadiazine, sulfathiazole, sulfamerazine, sulfamethazine, sulfamonomethoxine, sulfadoxine and sulfamethoxazole, were determined using chromatographic data for mixture with 15-50% (v/v) MeCN.
Experimental
Chemicals and reagents
The standard SAs studied are shown in Table 1. They were purchased from Sigma and used without further puriication. Water, with conductivity lower than
0.05 mS cm-1 was obtained with a Milli Q water puriication
system (Milli Pore Corp.). MeCN was of HPLC grade and used as the organic component of the mobile phase.
Stock standard solutions of SAs were freshly prepared
in water at concentrations of approximately 200 mg L-1
and stored in amber bottles in refrigerator (4 oC). Working
solutions were diluted with corresponding mobile phase to
10 mg L-1. These solutions were passed through a 0.45 mm
nylon ilter membrane (MSI) before injections.
The hold-up time, to, was measured for every mobile
phase composition by injection of 0.01% (m/v) potassium bromide solution (Merck).
Apparatus
A chromatographic system consisted of Shimadzu Model LC 10 ADVP pump with an auto injector (SIL 10 AD VP) and diode array detector system (SPDM 10 A DAD) was used for studies. This equipment has column oven (CTO 10 AVP) and degasser system (DGU 14 A).
A Phenomonex Prodigy ODS-3 100 A0 (250×4.60 mm
i.d. × 5 mm) end-capped, monomeric column with 15.5%
carbon load was used at 25 oC.
The electromotive force (e.m.f) measurements used to evaluate the pH of the mobile phase were performed using Metleer-Toledo MA 235 pH/ion analyser with a Hanna HI 1332 combination pH electrode. The calibration solutions were thermostated externally at
25 ± 0.1 oC with a cooler system water bath (HETO
CBN 8-30 and temperature control unit HETO HMT 200) when adjusting the pH. The electrode was stabilized in the appropriate MeCN-water mixture prior to e.m.f. measurements. pH measurements of the mobile phases were performed in triplicate to ensure stability and reproducibility of the potentiometric system.
The chromatographic retention of ionizable compounds is strongly dependent on the pH of the mobile phase. Thus an accurate measurement and control of mobile phase pH is required, in many instances, for eficient separations of
ionizable compounds by HPLC.28,29
Several procedures are used to measure the mobile phase pH. The most common procedure is to measure the pH of the aqueous buffer before mixing it with the organic
modiier, wwpH. A more rigorous procedure, recommended
by the IUPAC, is to measure the pH of the mobile phase after mixing the aqueous buffer and the organic modiier. In this instance, the electrode system used to measure pH
can be calibrated either with aqueous buffers, wspH, or with
buffers prepared in the same solvent composition used as
mobile phase, sspH. This requires knowledge of the pH value
of reference buffers prepared in different aqueous–organic
solvent mixtures.30
As pH values have been previously determined in MeCN-water mixtures for the primary standard series of substances proposed by NIST, in accordance with the
IUPAC rules, sspHvalues in MeCN-water mixtures can be
measured.31-34 In this study we used potassium hydrogen
phthalate as primary standard buffer reference solutions in the MeCN-water mixtures studied. The molar activity
coeficients, γ, were calculated using equation 3.
Table 1. Chemical structures of studied sulfonamides
Compounds Chemical structures
Sulfadiazine,
(4-Amino-N-(2-pyrimidin-2-yl) benzenesulfonamide)
C10H10N4O2S
Sulfathiazole,
(4-Amino-N-(1,3-thiazol-2-yl)
benzenesulfonamide) C
9H9N3O2S2
Sulfamerazine, (4-Amino-N-(4-methylpyrimidin-2-yl) benzenesulfonamide)
C11H12N4O2S
Sulfamethazine, (Sulfadimidine), (4-Amino-N
-(4,6-dimethylpyrimidin-2-yl) benzenesulfonamide)
C12H14N4O2S
Sulfamonomethoxine,
(4-Amino-N-(6-methoxy-4-pirimidinil) benzenesulfonamide)
C11H12N4O3S
Sulfadoxine, (4-Amino-N -(5,6-dimethoxy-4-pyrimidinyl) benzenesulfonamide)
C12H14N4O4S
Sulfamethoxazole,
(4-Amino-N-(5-methyl-3-isoxazolyl) benzenesulfonamide)
Procedure
Liquid chromatographic method
Throughout this study, the compounds were injected using isocratic system and the mobile phases assayed were MeCN-water at different compositions of acetonitrile (15:85, 30:70 and 40:60, 50:50 v/v) with triluoroacetic
acid, o-phosphoric acid and diethylmalonic acid. These
buffers were preferred because of their appropriate pKa
values. The pH of the mobile phases used was adjusted between 1.7 and 9.0 after addition of desired amount of sodium hydroxide. The mobile phase was prepared daily, iltered, sonicated before use and delivered at a low rate of
1.0 mL min-1 and the efluent was monitored at 270 nm. The
mobile phase mixtures were iltered through a 0.45 µm pore nylon membrane ilters (Millipore, Bedford, MA). A total of 10 µL of each solution was injected and chromatograms were recorded.
In general, for each MeCN content, the chromatographic retention was studied from acidic region to basic pH. The column was pre-conditioned during at least 1 h at low low
rate (0.5 mL min-1) with mobile phase at the corresponding
pH before the irst injection. Retention factors were calculated as k = (tR – t0)/t0, where t0 indicates the hold-up time.
The pKa values were determined by performing a
non-linear it using the NLREG programme.35 This is a general
purpose program, where the function to be minimized and the parameters to be estimated can be deined by means
of the built-in program editor. Data pairs of k-pH, ionic
strength and the guessed pKa values and the retention
factors of the fully protonated and deprotonated species are imported to the program. The ionic strength was determined from the amount of sodium hydroxide added to obtain the desired pH of the mobile phase, and from the dissociation constant of the buffer in the more acidic solutions. NLREG reines these parameters according to equation 4 to give a
minimum in the sum of square residuals (Um) in order to
obtain the dissociation constants of the SAs studied.
(4)
where ns indicates the number of solutions, ki,exp the
experimental value of the retention factor for solution,
i, and ki,calc the calculated value. The calculated retention
factors are obtained from equation 2.
LC-PDA method
While using the spectral data, the method based on the absorbance spectra at the maximum of chromatographic
peak, obtained with PDA has been applied to calculate
the pKa values. This method allows comparing the values
of dissociation constants obtained from chromatographic retention of SAs at different pH values and those obtained from absorbance spectra at the maximum of the chromatographic peak. Absorbance spectra were recorded between 190 and 500 nm and then processed by modiied STAR (Stability Constants by Absorbance Readings)
program.36,38 The STAR program provides several statistical
parameters to test the reliability of the regression process and the results obtained. The program gives the sum of the squared residuals, standard deviation of the residuals and the Hamilton R-factor (in %). Other valuable parameters for the examination of the distribution of the residuals are the Skewness and Kurtosis tests.
By checking the statistical parameters, we decide that the obtained results are good enough to be published or the experimental points could be repeated. In all cases, STAR program gives satisfactory statistical results in order to
obtain the pKa values of studied compounds.
Results and Discussion
SAs are ordinary ampholyte compounds so that their ionization can be described as a two-step protolysis (Figure 1). In ordinary ampholytes, when the difference
(∆pKa) between acidic pKa and basic pKb is greater than
3, only one kind of group (acid or basic) can be ionized
to any extent at a time. However, when ∆pKa is lower
than 3, the ionization of the other group will no longer be negligible, causing the existence of a small proportion of the zwitterionic species. When pH is about equal to average
pKa, the neutral form is the dominant species in ampholytes.
The hydrophobic nature of the neutral species is naturally
greater than those of the associated ions.39,40
A sulfonamide contains two important functional groups in the pharmaceutically relevant pH range of 4 to
9 as shown in Figure 1: one acidic amide moiety (N1) and
one basic amine moiety (N2). The amine nitrogen atom
(-NH2) is able to gain a proton, while the amide nitrogen
atom (-NH-) is able to release a proton under speciic pH conditions. Thus, the irst dissociation equilibrium refers
to the dissociation of amine moiety (pK1) and the second
equilibrium to the dissociation of amide moiety (pK2).
In order to obtain the pKa values of SAs using LC
methodology, data pairs of pH and retention factors, k,
and the ionic strength over pH range of 1.7-9.0, were used. The aqueous-organic mixtures used as mobile phase were MeCN-water mixtures with percentages of 15, 30,
40 and 50% v/v MeCN. The k values were determined
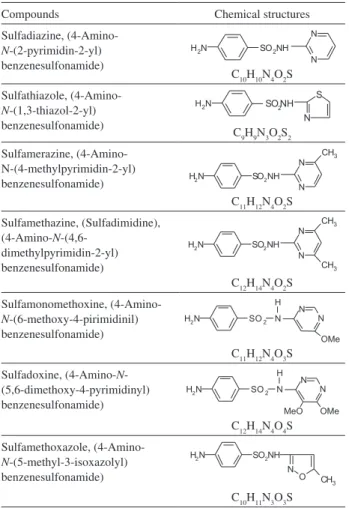
composition at each pH considered. In Figure 2, data pairs
of k/pH for studied sulfonamides in 15% (v/v) MeCN are
shown, together with the corresponding experimental and calculated retention factors from equation 2.
A method based on the absorbance spectra at the maximum of chromatographic peak, obtained with PDA has
been applied to obtain the pKa values. This method allows
comparing the values of dissociation constants obtained from chromatographic retention of series of SAs at different pH values and those obtained from absorbance spectra at the maximum of the chromatographic peak. It is possible to constitute a valuable means of obtaining better precision.
As an example of the application of LC-UV (PDA) method, Figure 3 shows the variation of the absorbance spectra for sulfamethaxazole in the maximum of the chromatographic peaks over the pH range from 1.7 to 9.0 when working in 40% (v/v) MeCN media. This method retains the advantages of both methods (UV-Vis and LC). The two methods proposed can be used simultaneously without an increase in the experimental time and allow conirmation of the results obtained.
The dissociation constant values determined for the equilibria involved for studied SAs in 15, 30, 40 and 50% v/v MeCN-water mixtures at 25.0 ± 0.1 °C are shown in Table 2, together with respective standard
deviations. Despite the large distance between the N2
nitrogen atom and R group, the R substituent seems to have
a crucial role in pKa1 values of sulfonamide derivatives. An
enhanced effect in the chemical and biological properties that distinguish different sulfonamide-based drugs should be expected if -NH- substitution takes place due to its proximity to the leaving proton. Thus, the role of different R groups attached to the amide nitrogen atom should be equally inspected.
The pK1 values associated with the amino group for
the compounds studied were smaller than those generally
observed with aniline derivatives in water41,42 (e.g., aniline
in water has a pK = 4.60). This increase in acidity can be
attributed to an electron-withdrawing sulfone group in the
para position. On the other hand, the pKa2 values in line with
the amide nitrogen atom of sulfonamide derivatives were smaller than the dissociation constant of sulfonilamide,
pKa = 10.1.43 This increase in acidity can be explained
by a resonance and inductive effect on the dissociation constants because the structures of the sulfonamide
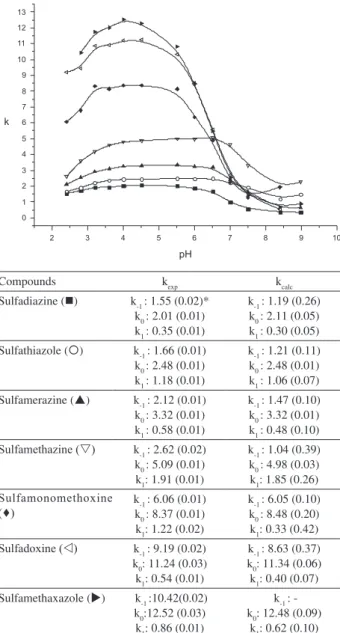
Compounds kexp kcalc
Sulfadiazine () k-1 : 1.55 (0.02)*
k0 : 2.01 (0.01)
k1 : 0.35 (0.01)
k-1 : 1.19 (0.26)
k0 : 2.11 (0.05)
k1 : 0.30 (0.05)
Sulfathiazole () k-1 : 1.66 (0.01)
k0 : 2.48 (0.01)
k1 : 1.18 (0.01)
k-1 : 1.21 (0.11)
k0 : 2.48 (0.01)
k1 : 1.06 (0.07)
Sulfamerazine () k-1 : 2.12 (0.01) k0 : 3.32 (0.01) k1 : 0.58 (0.01)
k-1 : 1.47 (0.10) k0 : 3.32 (0.01) k1 : 0.48 (0.10) Sulfamethazine (s) k-1 : 2.62 (0.02)
k0 : 5.09 (0.01)
k1: 1.91 (0.01)
k-1 : 1.04 (0.39)
k0 : 4.98 (0.03)
k1: 1.85 (0.26)
Sulfamonomethoxine
() kk-1 0 : 8.37 (0.01): 6.06 (0.01)
k1: 1.22 (0.02)
k-1 : 6.05 (0.10)
k0 : 8.48 (0.20)
k1: 0.33 (0.42)
Sulfadoxine (v) k-1 : 9.19 (0.02) k0: 11.24 (0.03) k1: 0.54 (0.01)
k-1 : 8.63 (0.37) k0: 11.34 (0.06) k1: 0.40 (0.07) Sulfamethaxazole () k-1 :10.42(0.02)
k0:12.52 (0.03)
k1: 0.86 (0.01)
k-1 :
-k0: 12.48 (0.09)
k1: 0.62 (0.10)
*The values between parentheses are the standard deviations.
Figure 2. Experimental and calculated retention factors, k, of neutral, anionic, and cationic forms of studied sulfonamides using equation 2 by NLREG program and plot of k vs. the pH of the mobile phase for 15% (v/v) MeCN.
derivatives are formed when a heterocyclic molecule is substituted for hydrogen of the sulfamine group. As it can
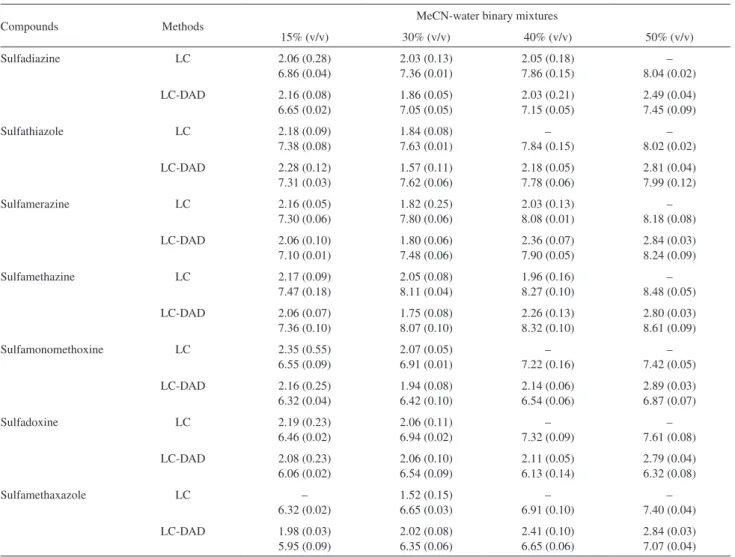
be seen in Table 2, the pKa1 values for some compounds
in 40 and 50% v/v MeCN media could not be calculated from retention factors due to the insuficient retention
times. However, the pKa1 values of studied compounds
could be calculated by LC-PAD methodology, because the absorbance spectra at the maximum of chromatographic peaks, obtained with a diode array detector provide adequate data and has been utilized for calculations.
It is known that one of the most important factor determining equilibrium constants is the reaction medium.
The variation of the pKa2 values of SAs versus the mole
fraction of MeCN, XMeCN, in the MeCN-water mixtures is
presented in Figure 4. The equations between pKa2 values
and mole fraction of organic modiier are shown in Table 3.
The different ways in which pK values change might be
explained by the fact that the dissociation process is ruled by electrostatic interactions as well as by speciic solute-solvent interactions.
It has been found that in several water-organic binary
solvent mixtures pKa values of a given substance show
a linear relationship with the mole fraction of organic
solvent.37 This is indicated by the following expression
pKa,j = j∆pK + pKa,w (5)
where pKa,w indicates the dissociation constant in water, j
the mole fraction of organic solvent, ∆pK the slope of the
linear relationship, and pKa,j the pKa at the corresponding
composition. pK values reported in the literature for water
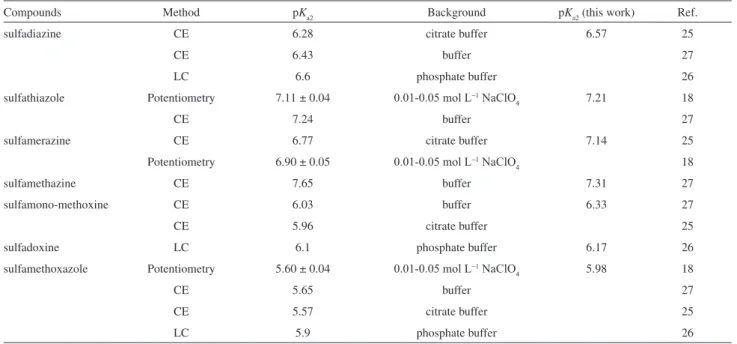
are shown in Table 4 for comparison together with the values obtained from equation 5. As it can be deduced from Table 4, the difference between the values determined in the present work and the values determined by others is minor and it could be expected from the difference in conditions and methods employed.
The pKa values of SAs obtained in MeCN-water
binary mixtures increase with percentage of MeCN. These variations could be explained by the fact that there is
Table 2. pKa values of studied compounds in 15, 30, 40 and 50% v/v MeCN-water binary mixture by using LC methodology
Compounds Methods MeCN-water binary mixtures
15% (v/v) 30% (v/v) 40% (v/v) 50% (v/v)
Sulfadiazine LC 2.06 (0.28)
6.86 (0.04) 2.03 (0.13) 7.36 (0.01) 2.05 (0.18) 7.86 (0.15) – 8.04 (0.02)
LC-DAD 2.16 (0.08)
6.65 (0.02) 1.86 (0.05) 7.05 (0.05) 2.03 (0.21) 7.15 (0.05) 2.49 (0.04) 7.45 (0.09)
Sulfathiazole LC 2.18 (0.09)
7.38 (0.08) 1.84 (0.08) 7.63 (0.01) – 7.84 (0.15) – 8.02 (0.02)
LC-DAD 2.28 (0.12)
7.31 (0.03) 1.57 (0.11) 7.62 (0.06) 2.18 (0.05) 7.78 (0.06) 2.81 (0.04) 7.99 (0.12)
Sulfamerazine LC 2.16 (0.05)
7.30 (0.06) 1.82 (0.25) 7.80 (0.06) 2.03 (0.13) 8.08 (0.01) – 8.18 (0.08)
LC-DAD 2.06 (0.10)
7.10 (0.01) 1.80 (0.06) 7.48 (0.06) 2.36 (0.07) 7.90 (0.05) 2.84 (0.03) 8.24 (0.09)
Sulfamethazine LC 2.17 (0.09)
7.47 (0.18) 2.05 (0.08) 8.11 (0.04) 1.96 (0.16) 8.27 (0.10) – 8.48 (0.05)
LC-DAD 2.06 (0.07)
7.36 (0.10) 1.75 (0.08) 8.07 (0.10) 2.26 (0.13) 8.32 (0.10) 2.80 (0.03) 8.61 (0.09)
Sulfamonomethoxine LC 2.35 (0.55)
6.55 (0.09) 2.07 (0.05) 6.91 (0.01) – 7.22 (0.16) – 7.42 (0.05)
LC-DAD 2.16 (0.25)
6.32 (0.04) 1.94 (0.08) 6.42 (0.10) 2.14 (0.06) 6.54 (0.06) 2.89 (0.03) 6.87 (0.07)
Sulfadoxine LC 2.19 (0.23)
6.46 (0.02) 2.06 (0.11) 6.94 (0.02) – 7.32 (0.09) – 7.61 (0.08)
LC-DAD 2.08 (0.23)
6.06 (0.02) 2.06 (0.10) 6.54 (0.09) 2.11 (0.05) 6.13 (0.14) 2.79 (0.04) 6.32 (0.08)
Sulfamethaxazole LC –
6.32 (0.02) 1.52 (0.15) 6.65 (0.03) – 6.91 (0.10) – 7.40 (0.04)
LC-DAD 1.98 (0.03)
preferential solvation in these media that is related to the structural features of these binary mixtures. Preferential
solvation in MeCN-water mixtures produces lower Ka
values than those expected when the preferred solvent is water. The composition of the immediate surroundings of a solute may differ from the composition of the bulk mixture. Preferential solvation is attributable to an excess or deiciency of molecules of one of the solvents in these
surroundings.44 If the solute displays no preference for the
solvent molecules, the solvent composition in the primary coordination shell, in the immediate neighborhood of the solute, is the same as that in the bulk. The deviation from the ideal dependence on the composition of the mixtures indicates that the solvent composition in the neighborhood of the solute may be different from that in the bulk.
As discussed above, the data shown in Table 2 clearly illustrate the important influence of the nature of the solvent on the dissociation reaction of studied compounds.
It has been shown that the solvating ability and dielectric constant of the solvent play an important role in dissociation
reactions.45 Water is a solvent of high solvating ability (i.e.
donor number DN = 33.0 and dielectric constant ε = 78)
which can dissociate the acid and stabilize the produced anion and hydrogen ion. Thus, it is expected that addition of MeCN with lower donor number and dielectric constant
(DN = 14.0, ε = 36.0) to water decreases the extent of
interaction of the acid anion and the proton with solvent, and this decreases the acidity constant of the compound. It is interesting to note that there is actually a linear relationship
between the pKa2 values of the second dissociation step
(that of the irst step slightly changes, those of the second
steps increase) and the mole fraction of MeCN (XMeCN) in
the binary mixtures that are shown in Figure 4.
Figure 4. Plot of pKa2 values against mole fraction of MeCN in the binary mixtures. () sulfadiazine, () sulfathiazole, () sulfamerazine, (×) sulfamethazine, (җ) sulfomonomethoxine, () sulfadoxine, () sulfomethoxazole.
Table 3. The equations between pKa2 values and mole fractions of organic
modiier
Compounds Equation Regression coeficient Sulfadiazine y = 6.183x* + 6.565 R = 0.979
Sulfathiazole y = 3.268x + 7.207 R = 0.997
Sulfamerazine y = 4.488x + 7.139 R = 0.958 Sulfamethazine y = 4.931x + 7.313 R = 0.953
Sulfamonomethoxine y = 4.478x + 6.326 R = 0.992 Sulfadoxine y = 5.878x + 6.165 R = 0.994 Sulfamethaxazole y = 5.381x + 5.980 R = 0.993
* represent the mole fraction of organic modiier (MeCN).
Table 4. pKa values reported of sulfonamides in water and calculated by equation 5
Compounds Method pKa2 Background pKa2 (this work) Ref.
sulfadiazine CE 6.28 citrate buffer 6.57 25
CE 6.43 buffer 27
LC 6.6 phosphate buffer 26
sulfathiazole Potentiometry 7.11 ± 0.04 0.01-0.05 mol L−1 NaClO
4 7.21 18
CE 7.24 buffer 27
sulfamerazine CE 6.77 citrate buffer 7.14 25
Potentiometry 6.90 ± 0.05 0.01-0.05 mol L−1 NaClO
4 18
sulfamethazine CE 7.65 buffer 7.31 27
sulfamono-methoxine CE 6.03 buffer 6.33 27
CE 5.96 citrate buffer 25
sulfadoxine LC 6.1 phosphate buffer 6.17 26
sulfamethoxazole Potentiometry 5.60 ± 0.04 0.01-0.05 mol L−1 NaClO
4 5.98 18
CE 5.65 buffer 27
CE 5.57 citrate buffer 25
Moreover, the results show that the pKa values of SAs are inluenced by the percentages of organic solvent
added to the solutions. The variation of pKa values with
the mole fraction of MeCN is different for each substance
although, in general, pK1 values in line with the anilinium
ion slightly changes up to 50 % (v/v) of MeCN, whereas
pK2 values in line with the sulfonamide increase. The
different ways in which pK values change might be
explained by the fact that the dissociation process is ruled by electrostatic interactions as well as by speciic solute-solvent interactions.
Acknowledgments
Financial support of this project by SDU-BAP (project No. 962-D-04) is gratefully acknowledge. Also, the authors greatly acknowledge Dr. Jose L. Beltran from Universitat de Barcelona for kindly providing the spectral data processing software, STAR. Authors are thankful to Anadolu University BIBAM and Dr. Zerrin SALTAN for their great assistance during the determination process.
References
1. Agarwal, V. K.; J. Chromatogr. 1992, 624, 411.
2. Guggisberg, D.; Mooser, A. E.; Koch, H.; J. Chromatogr. 1992,
624, 425.
3. Sangjarusvichaia, H.; Dungchaia, W.; Siangprohb, W.; Chailapakula, O.; Talanta2009, 79, 1036.
4. Bernal,J.; Nozalb, M. J.; Jiménez, J. J.; Martín, M. T.; Sanz, E.;
J. Chromatogr. A2009, 1216, 7275.
5. Garcia-Galan, M. J.; Garrido, T.; Fraile, J.; Ginebreda, A.; Díaz-Cruz, S.; Barcelo D.; J. Hydrology2010, 383, 93. 6. Pecorelli, I.; Bibi, R.; Fioroni, L.; Galarini, R.; J. Chromatogr.,
A 2004, 1032, 23.
7. Yang, T. C. C.; Yang, I. L.; Liao, L. J.; J. Liq. Chrom. Relat. Technol.2005,27, 501.
8. Maudens, K. E.; Zhang, G. F.; Lambert, W. E.; J. Chromatogr., A 2004,1047, 85.
9. Posyniak, A.; Zmudzki, J.; Mitrowska, K.; J. Chromatogr., A
2005, 1087, 259.
10. Reguera, C.; Ortiz, M. C.; Herrero, A.; Sarabi, L. A.; Talanta
2008, 75, 274.
11. Martell, A. E.; Motekaitis, R. J.; Determination and Use of Stability Constants, 2nd ed., VCH Publishers: New York, 1992. 12. Horvath, C.; Melander, W.; Molnar, I.; Anal. Chem.1977, 49,
142.
13. Foley, J. P.; May, W. E.; Anal. Chem.1987, 59, 110. 14. Barbosa, J.; Sanz-Nebot, V.; Anal. Chim. Acta1991, 244, 183. 15. Barbosa, J.; Fonrodona, G.; Marques, I; Buti, S.; Toro, I.; TrAC,
Trends Anal. Chem. 1997, 16 104.
It has been reasonably assumed that preferential solvation of the charged particles by water is mainly responsible for such a monotonic dependence of the acidity constants of SAs on the solvent composition. It is known that the dissociation of an uncharged acid in a solvent requires the separation of two ions of opposite charges. The work required to separate these charges is inversely proportional to the dielectric constant of the solvent. The energy required for dissociation is supplied by solvation of the ions, and also the proton transfer from acid to the solvent molecule supplies an additional energy. If the dielectric constant and the solvating ability of the solvent are decreased, more energy will be required to separate the anion and cation, and consequently the extent of dissociation of the acid will be
lowered. Therefore, the chance in the pKa of irst step and
the increase in the second step are due to increasing the mole fraction of MeCN in the binary mixed solvent.
Furthermore, the irst dissociation equilibrium (pK1)
regarding the N2 nitrogen atom is the dissociation constant
for equilibrium between the positively charged, unionized amino group and its electrically neutral conjugate base. Thus, when the amino group is ionized, there is no change in the number of charges involved in the process
(H2B+ HB + H+). Therefore, a change in the polarity
of the medium has a minor inluence on the dissociation process, which depends only on the solvation of the different species by the solvents of the mixture, and the variation of the dissociation constant with the MeCN content is not
linear. The changes in the pKa1 values of sulfonamides in
range of 40 and 50 % v/v of MeCN are greater. This is due to the fact that these dissociation constants are dependent on solute-solvent interaction effects, and these effects vary with the structural features of the mixtures. In these media, the solute interacts with solvent more strongly than with the other; the solute will be preferentially solvated by the
former.46
Conclusions
In this study, we distinguish the behavior of acidity constants of SAs in water-MeCN systems at 25 °C by LC and spectrophotometric data. The results obtained in this work indicate that the LC and LC-PDA methodology is a useful procedure in the determination of dissociation constants from chromatographic data: it allows two kinds of data sets (k/pH) and (A/pH) to be obtained, and these
can be used for independent pKa determination. Therefore,
16. Gagliardi, L. G.; Castells, C. B.; Rafols, C.; Roses,M., Bosch, E.; J. Chem. Eng. Data 2007, 52, 1103.
17. Martínez, V.; Maguregui, M. I.; Jiménez, R. M.; Alonso, R. M.;
J. Pharm. Biomed. Anal. 2000, 23, 459.
18. Qiang, Z.; Adams, C.; Water Res.2004, 38, 2874.
19. Pissinis, D.; Sereno, L. E.; Marioli, J. M.; J. Braz. Chem. Soc.
2005, 16, 1054.
20. Meloun, M.; Bordovska, S.; Vrana, A.; Anal. Chim. Acta2007,
584, 419.
21. Chiang, P. C.; Foster, K. A.; Whittle, M. C.; Su, C. C.; Pretzer, D. K.; J. Liq. Chromatogr. Related Tech. 2006, 29, 2291. 22. Babic, S.; Horvat, A. J.; Pavlovic, D. M.; Macan M. K.; TrAC,
Trends Anal. Chem.2007, 26, 1043.
23. SPARC V3.1. (http://ibmlc2.chem.uga.edu/sparc/).
24. ACD/Labs, Advanced Chemistry Development Inc., 90 Adelaide Street, West Toronto, Ontario, M5H3V9, Canada (http://www.acdlabs.com/ilab/).
25. Lin, C. E.; Chang, C. C.; Lin, W. C.; J. Chromatogr., A1997,
768, 105.
26. Mengelers, M. J. B.; Hougee, P. E.; Janssen, L. H. M.; Van Miert, A. S. J.; J. Vet. Pharm. Ther.1997, 20, 276.
27. Lin, C. E.; Lin, W. C.; Chen, Y. C.; Wang, S. W.; J. Chromatogr. A1997, 792, 37.
28. Poole, C. F.; Poole, S. K.; Chromatography Today, Elsevier: Amsterdam, 1991.
29. Rizzi, A. In Handbook of HPLC; Katz, E.; Eksteen, R.; Schoenmakers, P.J.; Miller N., eds., chapter 1, Marcel Dekker: New York, 1998.
30. Mussini, T.; Mazza, F.; Electrochim. Acta1987,32, 855.
31. Mussini, T.; Covington, A. K.; Longhi, P.; Rondinini, S.; Pure
Appl. Chem.1985, 57, 865.
32. Rondinini, S.; Mussini, P. R.; Mussini, T.; Pure Appl. Chem.
1987, 59, 1549.
33. Barbosa, J.; Sanz-Nebot, V.; Fresenius J. Anal. Chem. 1995,
353, 148.
34. Espinosa, S.; Bosch, E.; Roses, M.; Anal. Chem.2002, 74, 3809. 35. Sherrod, P. H. NLREG, Nonlinear Regression Analysis and
Curve Fitting Program, 2007. www.nlreg.com.
36. Beltran, J. L.; Codony, R.; Prat, M. D.; Anal.Chim. Acta 1993,
276, 441.
37. Erdemgil, F. Z.; Şanlı, S.; Şanlı, N.; Özkan, G.; Barbosa, J.; Guiteras, J.; Beltrán, J. L.; Talanta 2007, 72, 489.
38. Özkorucuklu, S. P., Beltran, J. L.; Fonrodona, G.; Barron, D.; Alsancak, G.; Barbosa, J.; J. Chem. Eng. Data 2009, 54, 807. 39. Pagliara, A.; Carrupt, P. A.; Caron, G.; Gaillard, P.; Testa, B.;
Chem. Rev.1997, 97, 3385.
40. Florence, A. T.; Attwood, D.; Physicochemical Principles of Pharmacy, 4th ed., Pharmaceutical Press: London, 2006, p. 79. 41. Altun, Y.; J. Solution Chem.2004, 33, 477.
42. Polster, J.; Lachmann, H.; Spectrometric Titrations: Analysis
of Chemical Equilibria, VCH Publishers: Weinheim, 1989. 43. Maren, T. H.; Conroy, C. W.; J. Biol. Chem. 1993, 268, 26233. 44. Marcus, Y.; Migron, Y.; J. Phys. Chem.1991, 95, 400. 45. Guttmann, V.; Coordination Chemistry in Nonaqueous
Solutions; Springer: New York, 1960.
46. Sanli, S.; Altun, Y.; Sanli, N.; Alsancak,G.; Beltran, J. L.;
J. Chem. Eng. Data2009, 54 3014.
Submitted: December 3, 2009