Article
0103 - 5053 $6.00+0.00*e-mail: [email protected]; [email protected]
Electrochemical Determination of Oncocalyxone A using an
Iron-phthalocyanine/Iron-porphyrin Modified Glassy Carbon Electrode
Cicero de O. Costa,a Antonio A. de Souza,a Rita de Cássia S. Luz,b Telma L. G. Lemos,c
Otília D. L. Pessoa,c Lauro T. Kubota*,b and Marília O. F. Goulart*,a
aInstituto de Química e Biotecnologia, Universidade Federal de Alagoas, 57072-970 Maceió-AL, Brazil bInstituto de Química, Universidade Estadual de Campinas, 13084-862 Campinas-SP, Brazil
cDepartamento de Química Orgânica e Inorgânica, Universidade Federal do Ceará, 60451-970 Fortaleza-CE, Brazil
Descreve-se, no presente trabalho, o desenvolvimento de um sensor voltamétrico altamente sensível para a oncocalixona A, utilizando-se eletrodo de carbono vítreo modificado com uma bi-camada de ftalocianina tetrassulfonada de ferro(II) (FeTSPc) e tetra-(N-metil-4-piridil)-porfirina de ferro(III) (FeT4MPyP). O eletrodo modificado apresentou alta atividade catalítica e estabilidade
em relação à redução da oncocalixona, proporcionando deslocamento anódico de ca. de 30 mV e amplificação da corrente de pico, em relação a iguais parâmetros obtidos em eletrodo de car-bono vítreo não modificado. Um ampla faixa linear de resposta entre 0.005-1.2 µmol L-1, com
sensibilidade de 8.11 µA L µmol-1 e limites de detecção (LOD) e quantificação (LOQ) de 1.5 e
5 nmol L-1 foramobtidos, com o uso desse sensor.
The development of a highly sensitive voltammetric sensor for oncocalyxone A using a glassy carbon electrode modified with a bilayer iron(II) tetrasulfonated phthalocyanine (FeTSPc) and iron(III) tetra-(N-methyl-4-pyridyl)-porphyrin (FeT4MPyP) is described. The modified electrode showed high catalytic activity and stability for the oncocalyxone A reduction, provoking the anodic shift of the reduction peak potentials of ca. 30 mV and presenting much higher peak currents than those obtained on the bare GC electrode. A wide linear response range between 0.005-1.2 µmol L-1,
with a sensitivity of 8.11 µA L µmol-1 and limits of detection (LOD) and quantification (LOQ) of
1.5 and 5 nmol L-1 were obtained with this sensor.
Keywords: voltammetric sensor, oncocalyxone, quinone, chemically modified electrodes, catalysis
Introduction
Plants are repositories for bioactive organic molecules. Several classes of natural compounds are pharmacologically active ingredients and serve as drugs and/or leads for drug developments. Among them, quinones, ubiquitous secondary metabolites, play essential roles, mainly in the biochemistry of energy production,
serving as vital links in the electron transport.1 They form
an important class of toxic metabolites and paradoxically, can be either, potentially carcinogenic or effective anticancer agents. The cytotoxic activity of quinones can often be correlated to their chemical behavior. The striking feature of quinone chemistry is the ease reduction and therefore their ability to act as oxidizing
or dehydrogenating agents, the driving force being the
formation of a fully aromatic system.2-5
Auxemma oncocalyx Taub. is a native Brazilian tree, characteristic of the xerophytic vegetation present in the northeastern region. It is commonly called “pau branco.”
The chemical investigation of A. oncocalyx heartwood
extracts resulted in the isolation and characterization of several unusual terpenoid quinones and hydroquinones
of C16 framework.6-9 These secondary metabolites seem
to be typical of the genus and, interestingly, were isolated in a homolog series differing in their degree of oxidation, oxygenation (ether or alcohol), rearrangement and intramolecular cyclization of the terpenoid side chain. As a general pattern, all compounds possess a methoxyl group in the C-2 position and, several of them, an angular
methyl group β-oriented attached to C-8a, besides a cis
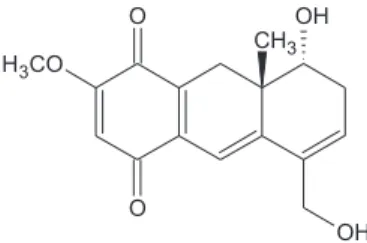
(Figure 1), rel-8α
-Hydroxy-5-hydroxymethyl-2-methoxy-8aβ-methyl-7,8,8a,9-tetrahydro-1,4-anthracenedione, a
deep red powder, was the first compound isolated from the
EtOH extract of A. oncocalyx. This secondary metabolite,
which was obtained in significant amounts (0.13% crude
extract),8 is responsible for the dark color of the heartwood
of this plant.
Oncocalyxone A (1) exhibited a series of
pharmaco-logical properties, such as cytotoxic, analgesic, anti-inflammatory, antioxidant and causative of inhibition of
platelet activation.7,10-12 Oncocalyxone A (1) also showed
differential antitumor activity against the murine tumors Ehrlich carcinoma, sarcoma 180 and L1210 leukemia. Other pharmacological activities were also ascribed to the
quinone fraction obtained from A. oncocalyx extract.
The potential pharmacological activity presented
by oncocalyxone A (1) and the unusual and varied
structural character of the other compounds isolated from
A. oncocalyx provide important models for the synthesis of new potential biological active compounds.
Due to the importance of phytotherapy, a major impetus was generated towards improving the techniques of separation and analysis of plants of commercial importance for their standardization in terms of these recognized
molecular entities.13-16
Electrochemical methods have been widely used for quantification of quinones in vegetal extracts and present
the advantages of simplicity and low cost.17
The use of bare electrodes for detection of organic compounds presents a number of limitations, such as low sensitivity and reproducibility due to the slow electron transfer reaction between the electrode surface and the analyte, and lower stability. As an alternative, the use of chemically modified electrodes has been proposed, which improve the electron transfer rate, also promoting an increase in the sensitivity of the system.17 In this sense,
a wide variety of compounds have been used as electron transfer mediators for electrooxidation or reduction of
several target molecules.17-20
The modification of electrodes with alternating
deposition of functional compounds has been attracting much
interest because of its potential application,21-22 and it is a
very simple way to experimentally produce complex layered structures with precise control of layer composition and
thickness.23 Additionally, porphyrins and metalloporphyrins
have demonstrated good features as analytical sensors because they can provoke electrocatalysis, increasing the
sensitivity and selectivity of the electrode.24-27
In this context, the present work reports the development of an efficient and stable sensor for oncocalyxone A
(1) determination, based on a glassy carbon electrode
modification with a bilayer produced by drop-casting of iron(II) tetrasulfonated phthalocyanine (negatively
charged) and iron(III) tetra-(N-methyl-4-pyridyl)-porphyrin
(positively charged), where presumably a strong interaction is established by ion-pair formation between the ammonium
group of the porphyrin and the sulfonic (–SO3–) group of
the phthalocyanine.
Experimental
Chemical and solutions
All used chemicals were analytical grade. Iron(II) tetrasulfonated phthalocyanine (FeTSPc) was synthesized and purified according to the procedure of Weber and
Busch.28 Iron(III) tetra-(N-methyl-4-pyridyl)-porphyrin
(FeT4MPyP) was acquired from Porphyrin Products Inc.
(UT, USA). Oncocalyxone A (1) (Figure 1), which data
is presented, was isolated from wood parts of Auxemma
oncocalyx collected in June 2005, at Pentecoste County, State of Ceará, Brazil. The plant was identified by Professor Edson P. Nunes, and a voucher specimen (No. 18459) is deposited at the Herbarium Prisco Bezerra (EAC) of the Departamento de Biologia, Universidade Federal do Ceará, Fortaleza, Ceará, Brazil. The extract preparation, methods of isolation and chemical characterization were previously
described by Pessoa et al.6-8
rel-8α-Hydroxy-5-hydroxymethyl-2-methoxy-8aβ
-methyl-7,8,8a,9-tetrahydro-1,4-anthracenedione (1),7 mp
209-211 °C; IR νmax /cm-1 (KBr): 3446, 3039, 1657, 1626,
1602, 1543, 1263, 1233, 1086; EIMS m/z 302 [M]+, 284,
255, 241, 225, 211, 169, 128, 115, 102, 69; 1H NMR (200
MHz, DMSO-d6) d 6.00 (s, H3), 6.02 (d, J 3.9 Hz, H6), 2.52
(br d, J 17.2 Hz, H7eq), 2.60 (dd, J 17.2, 3.9 Hz, H7ax),
3.55 (br s, H8), 2.90 (d, J 18.4 Hz, H9ax), 2.34 (d, J 18.4
Hz, H9eq), 6.48 (s, H10), 4.16 (br s, 2H11), 0.73 (s, 3H12), 3.73 (s, OMe), 4.93 (d, 4.5, OH8), 4.88 (t, 5.2, OH11).
13C NMR (50.3 MHz, DMSO-d
6) d 180.9 (C1), 159.5
132.7 (C9a), 111.5 (C10), 135.1 (C10a), 61.3 (C11), 20.9 (C12), 56.4 (OMe).
Monobasic sodium phosphate (NaH2PO4), dibasic
sodium phosphate (Na2HPO4), citric acid (C6H8O7),
acetonitrile (CH3CN), sodium hydroxide (NaOH),
hydrochloric acid (HCl) were acquired from Merck,
Rio de Janeiro, Brazil, PIPES [piperazine-N,N’
-bis(2-ethanesulfonic acid)] and HEPES [N-(2-hydroxyethyl)
piperazine-N-(2-ethanesulfonic acid)] were acquired from
Sigma, St. Louis, USA. Phosphate, McIlvaine, HEPES and
PIPES buffers and solutions of FeT4MPyP and FeTSPc
were prepared with water purified in a Milli-Q Millipore system and the actual pH values of the buffer solutions were determined with a Corning pH/Ion Analyzer 350 model.
Voltammetric measurements
The voltammetric measurements were carried out in an Autolab PGSTAT-30 potentiostat from Echo Chemie (Utrecht, The Netherlands) coupled to a PC microcomputer with GPES 4.9 software. An electrochemical cell containing 5.0 mL of phosphate buffer solution with a saturated calomel electrode (SCE) as reference, a Pt wire as auxiliary and a modified GC as working electrode were used for all measurements. Oxygen was removed by bubbling nitrogen through the solution, during 5 to 10 min. The optimized parameters in Square Wave Voltammetry (SWV) were set
up using a step potential (ΔEs) 0.002 V, pulse amplitude
(ΔESW) 0.05 V and frequence (f) 100 Hz.
Construction of the sensor
The glassy carbon electrode, with geometrical area
of 0.071 cm2 was acquired from BAS-USA, and used for
all measurements. Prior to the modification, the electrode surface was treated according to the procedure described
by Zhu and Nan-Qiang.29 After cleaning the electrode, an
electrostatically formed layer was prepared on the electrode
surface by drop-casting, transferring 15 µL of a FeTSPc
solution, in the concentrations 0.01, 0.05, 0.1, 0.15 and
0.19 mmol L-1 and let to dry at 80 °C during 10 min. After
10 min, 15 µL of the FeT4MPyP solution, in the concentrations
0.01, 0.05, 0.1, 0.15 and 0.19 mmol L-1, respectively, were
added to the electrode surface and also let to dry at 80 °C during 10 min. The bilayers were prepared by repeating the procedure described above. Presumably the interaction
between FeTSPc and FeT4MPyP complexes occurs by
ion-pairing between the amino group (−C6H8N+) of the
iron porphyrin and the anionic −SO3− of the tetrasulfonated
phthalocyanine. For the sensor optimization, a bilayer of
FeTSPc + FeT4MPyP complexes was prepared.
Analytical curve
After optimizing experimental parameters for the proposed sensor, the analytical curve was built by
addition of aliquots of 1 (stock solution of 1.0 µmol L-1 in
acetonitrile/water, 1:1 v/v, kept under nitrogen and dark) into measurement cell containing phosphate buffer solution
(0.05 mol L-1) at pH 7.0. The technique employed was square
wave voltammetry (SWV),30 and the SWV characteristic
parameters were: step potential (ΔEs) 0.002 V, frequency (f)
100 Hz and pulse amplitude (ΔESW) 0.050 V.
Results and Discussion
Electrocatalytic reduction of 1 on the modified electrode
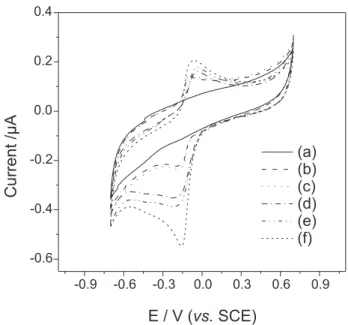
Figure 2 shows the cyclic voltammograms for the unmodified GC electrode in absence (a) and presence (b) of 1 (5 × 10⁻⁶ mol L-1) and the voltammograms for the
modified GC electrode with a layer of FeTSPc alone in presence of 5 × 10⁻⁶ mol L-1 1 (c) and a layer of FeT
4MPyP
(e) in presence of 1 (5 × 10⁻⁶ mol L-1). For comparison,
this figure also presents the cyclic voltammograms for the
modified GC electrode with a bilayer of FeTSPc/FeT4MPyP
in the absence (d) and presence (f) of 1 (5 × 10⁻⁶ mol L-1) in
0.1 mol L-1 phosphate buffer solution (pH 7.0). In presence
of 1 (Figure 2b), a typical quinone reduction behavior is
Figure 2. Cyclic voltammograms for the unmodified GC electrode in absence (a) and presence (b) of 1 (5 × 10⁻⁶ mol L-1) and the voltammograms for the modified GC electrode with a layer of FeTSPc alone in presence of 1 (5 × 10⁻⁶ mol L-1) (c) and a layer of FeT
shown, represented by a reversible pair of waves, with uptake
of 2 e− and 2 H+, generating the hydroquinone.2,31-32
As can be seen, the best response for 1 was obtained
with the FeTSPc/FeT4MPyP modified GC electrode
(Figure 2f). On this modified electrode, an anodic shift
of the reduction peak potential of ca. 30 mV and a much
higher peak current for 1 than those obtained on the bare
GC electrode were observed (Figure 2b compared to 2f). Additionally, on this electrode, the peak current for the
reduction of 1 was also higher than that ones showed on
the electrode modified with only FeT4MPyP or FeTSPc
(Figures 2c or 2e, respectively, compared to 2f).
The reduction of 1 on FeT4MPyP modified electrode
(Figure 2e) occurred next to the reduction current of the
FeTSPc/FeT4MPyP modified GC electrode (Figure 2d). When
only FeT4MPyP was used, a poor response was observed
(Figure 2e). This suggests that the FeT4MPyP complex
effectively increases the reduction rate of 1, while the FeTSPc
layer must be improving the assembly of the active sites of
FeT4MPyP resulting in a better catalyst for 1.
The interaction of the FeTSPc/FeT4MPyP complexes
and the increase in the peak current of 1 (Figure 2f), when
compared to the bare electrode (Figure 2b) can be associated
to the redox reactions of the immobilized [Fe(III)T4MPyP]5+
and [Fe(II)TSPc]4- giving [Fe(II)T
4MPyP]
4+ and [Fe(III)
TSPc]3- species. [Fe(II)T
4MPyP]
4+ is oxidized back, reducing
the quinone (1), originating the catalytic cycle (equations 1
and 2). [Fe(III)TSPc]3- species is electrochemically reduced to
[Fe(II)TSPc]4- leading to a cycle. Therefore, the high activity
of the modified GC electrode for the reduction of 1 in aqueous
solutions can be associated with the low charge transfer
resistance of the FeTSPc/FeT4MPyP bilayer as well the
presence of FeT4MPyP as an electrocatalyst. The combination
of these points proportionates a powerful catalytic property for
the reduction of 1. This effect results from the changes in the
chemical environment around the active sites, induced by the
contrasting molecular packing interactions with FeT4MPyP.
The catalytic properties and the use of phthalocyanines and
porphyrin bilayers have been described33 and in the present
case can be written as follow:
[Fe(III)T4MPyP]5+ + [Fe(II)TSPc]4-
[Fe(II)T4MPyP]4+ + [Fe(III)TSPc]3− (1)
2[Fe(II)T4MPyP]4+ + oncocalyxone
oxi
2[Fe(III)T4MPyP]5+ + [oncocalyxone
red] 2− (2)
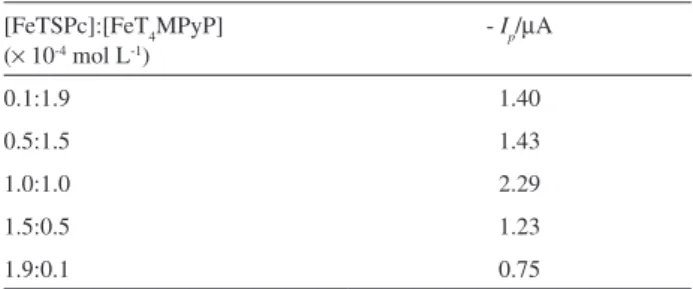
Influence of the concentration of FeTSPc and FeT4MPyP in the sensor response
The concentrations of FeTSPc and FeT4MPyP
are a control factor and influence the electrochemical
behavior in larger extent. Thus, the dependence of the complexes concentration on the electrode response for
1 was investigated by preparing a bilayer with different
concentrations of FeTSPc as well as for FeT4MPyP: 0.01,
0.05, 0.1, 0.15 and 0.19 mmol L-1. The results showed in
Table 1 indicate that the best response was obtained using
0.1 mmol L-1 of both complexes.
Lower current values were obtained when the amount
of FeTSPc was higher than FeT4MPyP, and vice-versa:
when the amount of FeT4MPyP increases, a similar trend
was observed. This trend suggests that the better ratio for
FeTSPc/FeT4MPyP assembly is 1, ideal for the kinetic
of electron transfer. In this condition, high current values
were obtained. The concentration of 0.1 mmol L-1 for each
constituent of the complex FeTSPc/FeT4MPyP was chosen
for further experiments.
Influence of pH, buffer solution and buffer concentration
The influence of the solution pH in the electrochemical
reduction response of 1 using 0.1 mol L-1 phosphate buffer at
pH 6.0, 6.4, 7.0, 7.4 and 8.0 was studied (Figure 3). The peak current increased with pH in the range from 6.0 up to 7.0. The highest peak current was obtained in pH 7.0. A decrease in the current is observed when the solution pH is higher than 7.0. Thus, the optimum pH for further studies was set in 7.0. In addition, this study showed that the oncocalyxone reduction peak potential undergoes, as expected, a slight cathodic displacement when the pH solution increases. The influence of the buffer solution on the sensor response was tested for four different buffer solutions (HEPES, Mcllvaine,
PIPES and phosphate) with concentrations of 0.1 mol L-1.
The best responses were obtained in phosphate buffer (Figure 4) that was chosen as the buffer solution.
Figure 5 shows the influence of different concentrations of phosphate buffer (0.025, 0.050, 0.10, 0.15 and
0.20 mol L-1) for the measurement of 1. The best response
was obtained for the concentrations of 0.05 and 0.1 mol L-1;
Table 1. Influence of the FeTSPc and FeT4MPyP concentrations, used in the film preparation, on the peak current obtained with the sensor for 0.3 mol L-11 in 0.1 mol L-1 phosphate buffer solution at pH 7.0
[FeTSPc]:[FeT4MPyP] (× 10-4 mol L-1)
- Ip/µA
0.1:1.9 1.40
0.5:1.5 1.43
1.0:1.0 2.29
1.5:0.5 1.23
outside this range, a current decrease has been observed.
Based on this, the concentration of 0.05 mol L-1 was chosen
for further experiments.
Influence of the frequency (f) and potential amplitude (a)
The effects of the frequency and potential amplitude on the square wave voltammetry (SWV) response of the
FeTSPc/FeT4MPyP modified GC electrode, in phosphate
buffer solution were verified. The peak current values
presented a linear increase with the frequency variation
from 20 to 140 Hz with ΔEs = 0.002 V. However, when
the frequency is >100 Hz, the current peak value remained almost constant, accompanied by distortion of the peaks. As it sets the best voltammetric profile with higher sensitivity, the frequency of 100 Hz was chosen and subsequently used throughout the present study. The current values of peak were also found to vary with pulse amplitude of 0.010-0.080 V applied on SWV at a frequency of 100 Hz for the modified
electrode and ΔEs = 0.002 V. The use of the pulse amplitude
> 0.050 V led to the peak current values almost constant and an increase in the background current. In this sense, the best sensitivity was obtained with 0.050 V and therefore, this value was chosen for further studies.
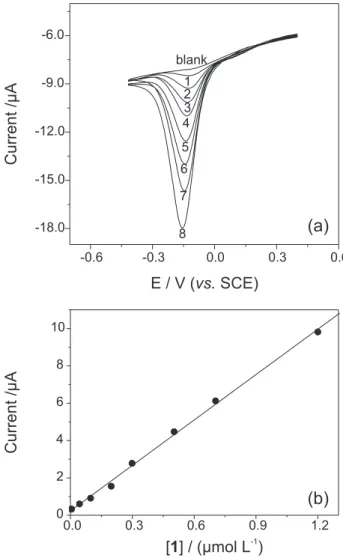
Analytical characterization
In order to obtain an analytical curve for 1, with the
developed sensor, under optimized conditions (phosphate
buffer, 0.05 mol L-1, pH 7.0), experiments were carried
out adding aliquots of 1 from a stock solution (Figure 6),
kept in dark and protected from oxygen. Under optimized conditions the proposed sensor showed a linear response
ranging from 5.0 nmol L-1 up to 1.2 µmol L-1, which can
be expressed according to equation 3:
Ip (µA) = 0.23 (± 0.90) + 8.11 (± 0.17) [1] (µmol L-1) (3)
with a correlation coefficient of 0.996 (for n = 8) and
with good sensitivity and limit of detection which can be attributed to the efficiency of the electron transfer Figure 3. Influence of pH on the sensor response obtained by SWV in
0.3 µmol L-11. Measurements carried out in 0.1 mol L-1 in phosphate buffer. ΔEs = 0.002 V, f = 80 Hz and a = 0.03 V.
Figure 4. Influence of the buffer solution on the sensor response obtained by SWV in 0.3 µmol L-11. Measurements carried out in 0.1 mol L-1 buffer solution, pH 7.0. ΔEs = 0.002 V, f = 80 Hz and a = 0.03 V.
between the FeTSPc/FeT4MPyP film and 1. Additionally, the proposed sensor presented a relatively wide linear response range, which can be related with the high affinity between the catalyst and the analyte. The limit of detection
of 1.5 nmol L-1 was determined using a 3s/slope ratio and
limit of quantification was 5.0 nmol L-1 using 10s/slope,
where sis the standard deviation of the mean value for
10 voltammograms of the blank, determined according to
IUPAC recommendations.34
Conclusions
This work demonstrated that glassy carbon electrode
modified by alternating FeTSPc and FeT4MPyP, layer by
layer, is a feasible alternative for the analytical determination
of 1. Optimization of the experimental conditions for square
Figure 6. SWV for the electro-reduction of 1 in phosphate buffer (0.05 mol L-1 at pH 7.0) obtained in the optimized conditions for concentration range from (1) 0.005, (2) 0.044, (3) 0.098, (4) 0.198, (5) 0.299, (6) 0.503, (7) 0.704, and (8) 1.2 µmol L-1 (a). Analytical curve (b). ΔEs = 0.002 V, f = 100 Hz and a = 0.05 V.
wave voltammetry furnished a low limit of detection and high sensitivity for oncocalyxone. In this sense, this work demonstrated that the glassy carbon electrode modified with
FeTSPc/FeT4MPyP is a sensitive, robust and stable sensor
showing great potential for oncocalyxone determination and additionally to be employed as an electrochemical detector in HPLC.
Acknowledgments
The authors thank CAPES, CNPq, FAPESP, FAPEAL, CNPq/PADCT, CNPq/MS/Neoplasias, CNPq/Instituto do Milênio-IMINOFAR, CTPETRO and BNB for financial support and fellowships.
References
1. O’Brien, P. J.; Chem. Biol. Interact.1991, 80, 1.
2. Aguilar-Martinez, M.; Macías-Ruvalcaba, N. A.; Bautista-Martínez, J. A.; Gómez, M.; González, F. J.; González, I.;
Curr. Org. Chem. 2004,8, 1721.
3. Bolton, J. L.; Trush, M.; Penning, T.; Dryhurst, G.; Monks, T.
J.; Chem. Res. Toxicol.2000, 13, 135.
4. Monks, T. J.; Jones, D. C.; Curr. Drug Metabolism2002, 3, 425. 5. Hillard, E. A.; de Abreu, F. C.; Ferreira, D. C. M.;Jaouen, G.;
Goulart, M. O. F.; Amatore, C.; Chem. Commun, submitted. 6. Pessoa, O. D. L.; Lemos, T. L. G.; Silveira, E. R.; Braz-Filho,
R.; Nat. Prod. Lett.1993,2,145.
7. Pessoa, C.; Lemos, T. L. G.; Pessoa, O. D. L.; Moraes, M. O.; Vasconcellos, D.; Costa-Lotufo, L. V.; Leyva, A.; Arkivoc 2004, VI, 89.
8. Pessoa, O. D. L.; Lemos, T. L. G.; Carvalho, M. G.; Braz-Filho,
R.; Phytochemistry1995, 6, 1777.
9. Marques, W. B.; Pessoa, O. D. L.; Lemos, T. L. G.; Braz-Filho,
R.; Rev. Latinoamer. Quím. 2000, 28,111.
10. Costa-Lotufo, L. V.; Ferreira, M. A. D.; Lemos, T. L. G.; Pessoa, O. D. L.; Viana, G. S. B.; Cunha, G. M. A.; Braz. J. Med. Biol.
Res. 2002, 35, 927.
11. Ferreira, M. A. D.; Nunes, O. D. R. H.; Leal, L. K. A. M.; Pessoa, O. D. L.; Lemos, T. L. G.; Viana, G. S. B.; Biol. Pharm. Bull.
2003, 26, 595.
12. Ferreira, M. A. D.; Nunes, O. D. R. H.; Fontenele, J. B.; Pessoa, O. D. L.; Lemos, T. G. L.; Viana, G. S. B.; Phytomedicine2004,
11, 315.
13. Hamburger, M.; Hostettmann, K.; Phytochemistry1991, 30,
3864.
14. Cardellina, J. H.; J. Nat. Prod. 2002, 65, 1073.
15. Lodhi, A. H.; Santana, A. E. G.; Charlwod, B. V.; Phytochemistry
Analysis1994, 5, 261.
16. Ruckert, U.; Likussar, W.; Michelitsch, A.; Phytochem. Anal.
17. Luz, R. C. S.; Damos, F. S.; Oliveira, A. B.; Beck, J.; Kubota, L. T.; Talanta2004, 64, 935.
18. Luz, R. C. S.; Damos, F. S.; Oliveira, A. B.; Beck, J.; Kubota, L. T.; Electrochim. Acta2005, 50, 2675.
19. Damos, F. S.; Sotomayor, M. D. T.; Kubota, L. T.; Tanaka, S. M. C. N.; Tanaka, A. A.; Analyst 2003,128, 255.
20. Revenga-Parra, M.; Lorenzo, E.; Pariente, F.; Sens. Actuators B2005,107, 678.
21. Yang, S.; Li, Y.; Jiang, X.; Chen, Z.; Lin, X.; Sens. Actuators
B: Chem. 2006,114, 774.
22. Huang, H. X.; Qian, D. J.; Nakamura, N.; Nakamura, C.; Wakayama, T.; Miyake, J.; Electrochim. Acta2004,49, 1491. 23. Sun, C.; Zhao, J.; Xu, H.; Sun, Y.; Zhang, X.; Shen, J.; Talanta
1998, 46, 15.
24. Manriquez, J.; Bravo, J. L.; Granados, S. G.; Succar, S. S.; Bied Charreton, C.; Ordaz, A. A.; Bedioui, F.; Anal. Chim. Acta1999,
378, 159.
25. Mímica, D.; Zagal, J. H.; Bedioui, F.; Electrochem. Commun.
2001,3, 435.
26. Ozoemena, K. I.; Nyokong, T.; Talanta2005, 67, 162. 27. Ozoemena, K. I.; Zhao, Z.; Nyokong, T.; Electrochem. Commun.
2005, 7679.
28. Weber, J. H.; Busch, D. H.; Inorg. Chem. 1965, 4, 469. 29. Zhu, Z.; Nan-Qiang, L.; Electroanalysis1998, 10, 643. 30. Souza, D.; Machado, S. A. S.; Avaca, L. A.; Quim. Nova2003,
26, 1.
31. Jacq, J.; Electrochim. Acta1967,12, 1345.
32. De Abreu, F. C.; Goulart, M. O. F.; Oliveira-Brett A. M.;
Electroanalysis2002, 14, 29.
33. Santos, W. J. R.; Sousa, A. L.; Luz, R. C. S.; Damos, F. S.; Kubota, L. T.; Tanaka, A. A.; Tanaka, S. M. C. N.; Talanta2006,
70, 588.
34. Analytical Methods Commitee, Analyst1987, 112, 199.
Received: September 1, 2007 Web Release Date: April 2, 2008