Temperature Dependent Molecular Dynamic Simulation of Friction
R. A. Dias, M. Rapini, B. V. Costa,
Laborat´orio de Simulac¸˜ao, Departamento de F´ısica, ICEX, UFMG 30123-970, Belo Horizonte, MG, Brazil
and P. Z. Coura
Departamento de F´ısica, ICE, UFJF, Juiz de Fora, MG, Brazil
Received on 28 September, 2005
In this work we present a molecular dynamics simulation of aFFMexperiment. The tip-sample interaction is studied by varying the normal force in the tip and the temperature of the surface. The friction force,cA, at zero load and the friction coefficient,µ, were obtained. Our results strongly support the idea that the effective contact area,A, decreases with increasing temperature and the friction coefficient presents a clear signature of the premelting process of the surface.
Keywords: Nanometric friction; Molecular dynamic; Surface premelting
I. INTRODUCTION
Friction is one of the oldest phenomenon studied in natural sciences. In a macroscopic scale it is known that the friction force between surfaces satisfies the following rules: (1) The friction is independent of contact area between surfaces; (2) It is proportional to the normal force applied between surfaces and (3) The kinetic friction force is independent of relative speed between surfaces[1]. Considering that friction is the result of many microscopic interactions between the building atoms at the surfaces, it must depend on factors as roughness , temperature and the energy dissipation mechanism at the sur-faces. Therefore, to understand its macroscopic behavior it is necessary to understand in details the dynamics of interaction between atoms in the surfaces in contact. In 1987, C. M. Mat et al[2] have used, for the first time, the Friction Force Micro-scope (FFM) to investigate friction in nano-scale. That kind of microscope allows the experimentalist to produce essentially a single contact between a sharp tip, of atomic dimensions, and the surface. [3, 4].
FIG. 1:Schematic view of a FFM apparatus. [5]
Its basic principle is shown in Fig. 1. In this apparatus the tip stays in touch with the surface while it moves at constant velocity,v, parallel to the surface. The resulting force in the cantilever makes a torsion on it. This torsion can be observed by optical techniques. One of the more striking effects
ob-served is the stick-slip phenomenon: The friction force plotted as a function of time exhibits a sawtooth behavior. [6, 7].
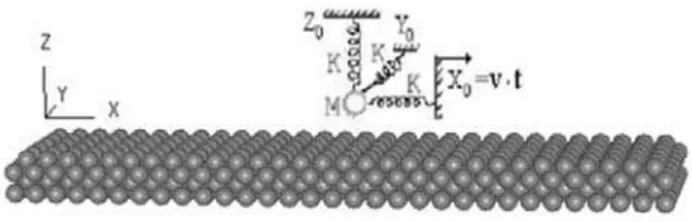
Analytically, the motion of the tip can be modelled as fol-lows. Forces in the tip are a sum of two terms: An interac-tion force between the tip and the surface due to the periodic atomic arrangement of the lattice and a force due to the can-tilever. Some authors by using this approach were able to re-produce several features of the friction at a nanoscopic scale [8, 9]. In this work we use molecular dynamics (MD) simula-tion to study the fricsimula-tion phenomenon at the atomic scale. In Fig. 2 we show a schematic view of the model we have used in our simulation to reproduce theFFMmechanism (Figure 1). The tip is represented by a single particle that interacts with the surface through a convenient potential. The springs rep-resent the mechanism we have used to vary the normal force (z direction) and to measure the lateral force (xandy direc-tions). By measuring both forces it is possible to study the friction force behavior under several circumstances.
FIG. 2:Schematic view of our Friction Force apparatus.
In the following we describe a series of molecular dynam-ics computer simulation of the interaction of a small tip with a surface. Computer simulations give us a very convenient instrument to study tribological processes. They allow con-trolled “numerical experiments” where the geometry, sliding conditions and interactions between atoms can be varied at will to explore their effect on friction, lubrication, wear and to reach unaccessible regions for experimentalists. Unlike labo-ratory experiments, computer simulations enable us to follow and analyze the full dynamics of all atoms. A wide range of potentials have been employed in numerical studies of tribol-ogy. For example, simulations of metals frequently use the embedded atom method, while studies of hydrocarbons use potentials that include bond-stretching and so on. We will not concentrate ourselves in any specific material rather in general aspects of the problem under consideration. Due to the
gen-eral character of our study we content ourselves by using the Lennard-Jones (6−12) potential which is commonly used in studies of general behavior. We will consider that the interac-tion of the tip with the surface does not disturb very much the electronic structure of the system. This consideration means that we do not have to deal with the quantum aspects of the problem. This simplification let us save a lot of computer time. If, for one side, we lose details of the considered phe-nomenon, we gain in that we can study true dynamical and temperature dependent models.
This work is organized as follows. In the section II we in-troduce general aspects of the numerical method used, in the section III we present our results and in section IV we discuss and present some conclusions.
II. SIMULATION BACKGROUND
Our simulation is carried out by using molecular dynam-ics (MD) simulation. A schematic view of the simulation arrangement we have used is shown in Fig. 2. Three springs of elastic constantskx,kyandkz are attached to the particle Mthat represents a tip point. This arrangement allow us to measure normal (Fz) and parallel (Fx,Fy) forces onM. The surface is represented by an arrangement of particles which interact with each other and with the massMthrough a trun-cated Lennard-Jones (6−12) (LJ) potential
Φi,j(ri,j) =
φi,j(ri,j)−φi,j(rc)−(ri,j−rc)
∂φ
i,j(ri,j)
∂ri,j
ri,j=rc
i f ri,j<rc
0 i f ri,j>rc
(1)
whereφi,j(ri,j)is the complete LJ potential,
φi,j(ri,j) =4εi,j
σi,j ri,j
12
−
σi,j ri,j
6
. (2)
The indexesiand jstands for position vectors−→ri and−→rj re-spectively, and 1≤i≤N, whereNis the total number of par-ticles andri,j=
rj−ri
. A cutoff, rc, is introduced in the potential in order to accelerate the simulation. If the force on a particle is found by summing contributions from all parti-cles acting upon it, then this truncation limits the computa-tion time to an amount proporcomputa-tional to the total number of particlesN. Of course, this truncation introduces disconti-nuities both in the potential and the force. To smooth these discontinuities we introduce the constant termφ(rc). Another term(∂φi,j(ri,j)/∂ri,j)r
i,j=rcis introduced to remove the force discontinuity. Particles in the simulation move according to Newton’s law of motion, which generates a set of 3Ncoupled equations of motion which are solved by increasing forward in time the physical state of the system in small time steps of sizeδt. The resulting equations are solved by using Beeman’s
method of integration[11–14]. The system is arranged in 4 layers with free boundary conditions in all directions. The first layer is frozen in a regular arrangement as in the(001) surface of a Lennard-Jones bcc crystal in order to maintain the whole structure as flat as possible.
With the tip far away from the surface we thermalize the system at temperature T. After thermalization, the tip is pushed in a direction parallel to the surface at constant ve-locityvp. For each simulation the distance between the spring and the surface is fixed at the start, so that we can control the perpendicular force on the tip. By measuring the size vari-ation of the springs we can calculate the lateral,Fx, and the perpendicular force,Fz, on the tip. The temperature,T, of the surface can be controlled by using a velocity renormalization scheme (See for example [15] and references therein). From the equipartition theorem we can write that
v2=3kB
mT. (3)
0 0.5 1 1.5 2 2.5 3 T
-5 -4.5 -4 -3.5 -3 -2.5 -2 -1.5 -1 -0.5 0
Et/N
Tm
FIG. 3:Energy as a function of temperature. The melting temperature is estimated as the inflexion point, being aroundTm≈1.1ε/kb
approximations. By multiplying each velocity by a factorα0 defined as
α0= m
3kB
v2 0
Tf
, (4)
a first approximation toTf is done. By evolving in time the system we can create sequences,Tn,{v}nand{α}n, such that after a finite number of time steps the temperature of the sys-tem converges toTn≈Tf. The friction coefficient is calculated as the quotient
µ≡dFx
dFz
. (5)
Before we start the simulation we have to have an estima-tive of the melting temperature, Tm, of the system. This is done by performing a preliminary simulation of the substrate. In Figure 3 we show the total energy per particle,E, as a func-tion of temperature. The melting temperature is estimated as the inflection point of the curve. We findTm≈1.1 in accor-dance with earlier calculations [10, 15–17]. The velocity, po-sition and forces are stored at each time step for further analy-sis. We measure the timet, temperatureTand forces in units ofσ
m/ε,ε/kBandε/σrespectively.
III. RESULTS
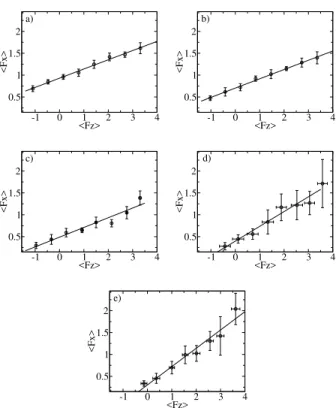
We have simulated theFFMsystem for several tempera-tures and initial distances of the tip to the substrate or equiva-lently, the normal force in the tip. In Fig. 4 we show a plot of our MD simulation results for the friction force as a function of normal force for several temperatures. The Amonton’s Law of friction states that frictional forces are proportional to the normal force and independent of the contact area. This type of behavior was observed in some systems by many authors, who fittedFxto a linear function of both load,Fz, and contact area,A:
Fx=µFz+cA. (6)
Hereµ is the friction coefficient and the second termcAis interpreted as the friction force for zero normal force. In the
-1 0 1 2 3 4
<Fz> 0.5
1 1.5 2
<Fx>
a)
-1 0 1 2 3 4
<Fz> 0.5
1 1.5 2
<Fx>
b)
-1 0 1 2 3 4
<Fz> 0.5
1 1.5 2
<Fx>
c)
-1 0 1 2 3 4
<Fz> 0.5
1 1.5 2
<Fx>
d)
-1 0 1 2 3 4
<Fz> 0.5
1 1.5 2
<Fx>
e)
FIG. 4: The friction force,Fxas a function of normal force, Fz is shown for several temperatures. TheFxandFzforces are measured in units ofε/σ. The figures, fromatoeare for several different values of
T=0.25,0.44,067,085,1.05 respectively. The circles are the MD results and the straight line correspond to an adjust.
0.2 0.4 0.6 0.8 1 T 0.2 0.4 0.6 0.8 1 cA
0.2 0.4 0.6 0.8 1
0.2 0.4 0.6 0.8 1
0.2 0.4 0.6 0.8 1 T 0.1 0.2 0.3 0.4 0.5 µ
0.2 0.4 0.6 0.8 1 0.2
0.4
FIG. 5:Plot ofcA(left) andµ(right) as a function of Temperature. The line is only a guide to the eyes.
-10 0 10 x 0 10 20 30 y
-10 0 10 0
10 20 30 a)
-10 0 10 x 0 10 20 30 y
-10 0 10 0
10 20 30 b)
-10 0 10 x 0 10 20 30 y
-10 0 10 0
10 20 30 c)
-10 0 10 x 0 10 20 30 y
-10 0 10 0
10 20 30 d)
-10 0 10 x 0 10 20 30 y
-10 0 10 0
10 20 30 e)
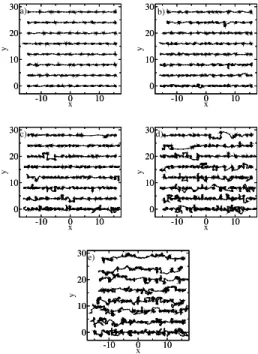
FIG. 6: Path of the tip over the surface (XY plane) for several tempera-tures and normal forces. From a) to e) we haveT=0.25,0.44,067,085,1.05 respectively. The normal forces are defined in fig 4. The plots are shown dislocated by a constant value in theydirection as a matter of clarity.
normal forces Fz=−1.09,−1.02,−0.95,−0.42,−0.14 and Fz=2.05,2.09,2.13,2.52,2.56 respectively for several tem-peratures. For negative values of Fz the residence time is well defined even at high temperatures having its average at δt≈50. The tip is immersed in the surface, so that, it can eas-ily travel along channels on the surface of the crystal. In the Fig. 8 we show the histograms for positive values ofFz. The temperatures are the same as in Fig. 4. At low T they show a similar behavior as that forFz<0. However, at higher temper-atures, the residence time spreads out to the highertregion. We interpret this as a closing of the channels discussed above due to thermic motion of the particles at the surface. When temperature increases the particle gets more energy, which is eventually enough to push it from any specific neighborhood.
0 50 100 150 200 t 0 5 10 15 20 25 30 35
0 50 100 150 200 0 5 10 15 20 25 30 35 a)
0 50 100 150 200 t 0 5 10 15 20 25 30 35
0 50 100 150 200 0 5 10 15 20 25 30 35 b)
0 50 100 150 200 t 0 5 10 15 20 25 30 35
0 50 100 150 200 0 5 10 15 20 25 30 35 c)
0 50 100 150 200 t 0 5 10 15 20 25 30 35
0 50 100 150 200 0 5 10 15 20 25 30 35 d)
0 50 100 150 200 t 0 5 10 15 20 25 30 35
0 50 100 150 200 0 5 10 15 20 25 30 35 e)
FIG. 7: Histogram for the residence time. The normal force is forFz=
−1.09,−1.02,−0.95,−0.42,−0.14. Beam size istbeam=5.
0 50 100 150 200 t 0 5 10 15 20 25 30 35
0 50 100 150 200 0 5 10 15 20 25 30 35 a)
0 50 100 150 200 t 0 5 10 15 20 25 30 35
0 50 100 150 200 0 5 10 15 20 25 30 35 b)
0 50 100 150 200 t 0 5 10 15 20 25 30 35
0 50 100 150 200 0 5 10 15 20 25 30 35 c)
0 50 100 150 200 t 0 5 10 15 20 25 30 35
0 50 100 150 200 0 5 10 15 20 25 30 35 d)
0 50 100 150 200 t 0 5 10 15 20 25 30 35
0 50 100 150 200 0 5 10 15 20 25 30 35 e)
IV. CONCLUSION
We have performed a molecular dynamics simulation of a FFMexperiment. Our results were obtained by varying the normal force in the tip and the temperature of the surface. The behavior of thecAterm in the Amonton’s law (eq. 6) and the friction coefficient were found to depend on the temperature. ThecAterm which measures essentially the effective contact area,A, between the tip and the surface were found to decrease
with increasingT. The friction coefficient presents a sudden jump which seems to be related to the premelting processes of the surface.
Acknowledgments
This work was partially supported by CNPq. We are grate-ful to B.A. Soares for suggestions and comments.
[1] E. Meyer, R. M. Overney, K. Dransfeld, and T. Gyalog,
Nanoscience - Friction and Rheology on the Nanometer Scale, (World Scientific Publishing, Singapore, 1998).
[2] C. M. Mate, G. M. McClelland, R. Erlandsson, and S. Chiang, Phys. Rev. Lett.59, 1942 (1987).
[3] S. Fujisawa, E. Kishi, Y. Sugawara, and S. Morita, Phys. Rev. B51, 7849 (1995).
[4] R. L¨uthi, E. Meyer, M. Bammerlin, L. Howald, H. Haefke, T. Lehmann, C. Loppacher, H.-J. G¨untherodt, T. Gyalog, and H. Thomas, J. Vac. Sci. Technol. B14, 1280 (1996).
[5] P. Reimann and M. Evstigneev, Description of atomic friction as forced Brownian motionNew Journal of Physics,7, 25 (2005). [6] T. Gyalog and H. Thomas, Z. Phys. B104, 669 (1997). [7] A. Volmer and Th. Nattermann, Z. Phys. B104, 363 (1997). [8] E. Gneccoet al., Phys. Rev. Lett.84, 1172, (2000).
[9] P. Reimann and M. Evstigneev Phys. Rev. Lett. 93, 230802
(2004)
[10] F. J. Resende and B. V. Costa, Phys. Rev. B61, 12697 (2000). [11] D. Bemman, J. Comput. Phys.20, 130 (1976).
[12] H. J. C. Berendsen and W. F. GunsterenPratical Algorithms for Dynamic Simulations.Pag. 43-65.
[13] M. P. Allen and D. J. Tildesley,Computer Simulation of Liquids
(Oxford Scince Publications, New York, 1992)
[14] D. C. Rapaport, The Art of Molecular Dynamic Simulation
(Cambridge University Press, New York, 1997)
[15] P. Z. Coura, O. N. Mesquita and B. V. Costa, Phys. Rev. B59, 3408 (1999).
![FIG. 1: Schematic view of a FFM apparatus. [5]](https://thumb-eu.123doks.com/thumbv2/123dok_br/18981977.457364/1.918.138.454.708.884/fig-schematic-view-ffm-apparatus.webp)