Physico-chemical characteristics of honey produced by
Apis mellifera
in the
Picos region, state of Piauí, Brazil
Geni da Silva Sodré1, Luís Carlos Marchini1, Augusta Carolina de Camargo Carmello Moreti2, Ivani Pozar Otsuk2, Carlos Alfredo Lopes de Carvalho3
1Departamento de Entomologia e Acarologia, Escola Superior de Agricultura “Luiz de Queiroz”/Universidade de São Paulo, Piracicaba,
São Paulo.
2Instituto de Zootecnia, Agência Paulista de Tecnologia dos Agronegócios (SSA), Nova Odessa, São Paulo.
3Centro de Ciências Agrárias, Ambientais e Biológica/Universidade Federal do Recôncavo da Bahia, Grupo de Pesquisa Insecta, Cruz das
Almas, Bahia, 44380-000.
ABSTRACT - The objectives of this research were to determine physico-chemical characteristics of 1,758 Apis mellifera L. honey samples produced by in the productive pole of Picos, state of Piauí, to understand, based on these characteristics, how they are grouped and to determine the percentage of honey that fit the specifications determined by Brazilian legislation. Thirty-five honey samples were collected directly from beekeepers for determination of total sugars, reducing sugars, apparent sucrose, humidity, diastase activity, hydroxymethylfurfural (HMF), protein, ash, pH, acidity, formol index, electrical conductivity, viscosity and color. Mean values of each one of the analyzed physico-chemical parameters are within the limits established by the current Brazilian legislation, but it was verified for apparent sacarosis, diastase activity and HMF, values different from the established ones. Protein and HMF were the traits that contributed most for group formation.
Key Words: honey bee, hydroxymethylfurfural, moisture, sugars
www.sbz.org.br
Introduction
The physico-chemical characteristics of honey have been studied extensively. However, there is still a lack of studies on tropical regions with highly diversified bee floras and high moisture and temperature. In Brazil, the high regional diversity of bee floras demands the characterization and development of bee rearing patterns that consider the local vegetation, soil and climate (Crane, 1983; Marchini et al., 2004).
In Northeastern Brazil, the state of Piauí and particularly the Picos region have become increasingly important as honey producers. Picos is nationally known for its honey potential due to the diverse local vegetation (‘caatinga’, ‘cerrado’, semideciduous forest, ‘restinga’, ‘mangue’), with rich and diverse flowers (Silva, 2002). The honey produced in this region is of excellent quality, free of contamination and it has rich fragrances and flavours, all of which are highly valued by consumers.
The main objectives of this work were to determine the physico-chemical characteristics of the honey produced by
Apis mellifera L., 1758 in the Picos region and their impact
on bee assemblage and on the percentage of the honey fitting the specifications of current Brazilian legislation.
Material and Methods
The 35 (thirty-five) samples of honey produced by Apis mellifera L., 1758 (Hymenoptera: Apidae) were obtained
directly from beekeepers in the Picos region, state of Piauí. The physico-chemical analyses were conducted at the Laboratório de Apicultura, Departamento de Entomologia, Fitopatologia e Zoologia at Escola Superior de Agricultura “Luiz de Queiroz”, Universidade de São Paulo, Piracicaba, state of São Paulo.
The following analyses were conducted in triplicates: total sugars, reducing sugars, and apparent sacarosis following the Copersucar Method (1987) modified by Marchini et al. (2004); moisture, by using a manual refractometer ATAGO (ATAGO Co., 1988); diastase activity (CAC.,1990); hydroxymethylfurfural (AOAC, 1990); protein (Silva & Queiroz , 2002); ashes (%) (Pregnolato & Pregnolato, 1985); pH and acidity (Moraes & Teixeira, 1998); formol index (Moraes, 1994); electrical conductivity (BOE. 1986); viscosity (ASTM, s.d.p.) and colour classification (Vidal & Fregosi, 1984).
Sodré et al. 1838
R. Bras. Zootec., v.40, n.8, p.1837-1843, 2011
(1978); a qualitative analysis was conducted by identifying the polinic type (Barth, 1970a,b,c; 1971a,b; 1989; 1990).
The “Proc princomp” procedures contained in SAS (Statistical Analysis System), SAS Institute (2001) were used for the principal component analysis (PCA) to assess the effect of each physico-chemical characteristic on the total variation available (Mardia et al., 1979). This technique is based on the standardization and rotation of the orthogonal axes (physico-chemical characters) to create a new set of non-correlated coordinates (principal components; Morrison, 1981).
Cluster analysis was conducted by using the SAS “Proc cluster” with the mean Euclidean distance as mean dissimilarity and the UPGMA Method (unweighed pair-group average) after data standardization (Cruz & Regazzi, 1994).
Results and Discussion
Total sugar percentages varied from 77.10 to 86.80% and the mean was 82.91% (Table 1). These values are close to those obtained by Komatsu et al. (2002), Sodré et al. (2002), Arruda et al. (2005) and Moreti et al. (2009), who found a variation from 67.8 to 88.3% in total sugar content of Brazilian honey samples obtained from different floral origins.
The reducing sugar amount varied from 74.70 to 82.80% (79.27% mean). As such, all samples were above the 65% lowest limit allowed in Brazil (Brasil, 2000). These values were similar to the 70.38 to 87.39% obtained by Carneiro et al. (2002) in honey samples from Simplício Mendes, State of Piauí. Silva et al. (2004) found 68.92 to 85.49% reducing sugar content in honey produced from different flowering plants in the same state.
The concentrations of apparent sacarosis varied from 0.20 to 6.70% (mean 3.47%). Only sample 6, or 2.86% of the samples analysed, had values above the highest concentration (6%) currently allowed in Brazil (Brasil, 2000). For Azeredo et al. (1999), the high apparent sacarosis content in honey may be an indication of “unripe honey” due to its incomplete transformation into glucose and fructose by the action of the invertase enzyme secreted by bees, or due to honey adulteration. Moreti et al. (2009) argue that sacarosis content slightly higher than the lower established value can be due to the fact that the bee collected feed from resources other than the nectar for that specific honey. The apparent sacarosis percentages obtained in our study are similar to those found by Baldi-Coronel et al. (1993) in Argentina (1.00 to 13.00%) and by Vit-Oliver et al. (1994) in Venezuela (1.74 to 11.99%).
Honey moisture content in our study was between 16.40 and 19.00% (18.00% mean), and all samples were below the established 20% upper limit allowed (Brasil, 2000). Rodríguez et al. (2004) reported that honey moisture is affected by its botanical origin and by climate, harvest time and degree of honey maturation, which are highly important during product storage. Cornejo (1988) argues that high moisture leads to product fermentation and consequent deterioration. Results similar to those obtained in our study were reported by Rendón (1996) in Spain, for honey with 15.00 to 18.80% moisture, by Silva et al. (2004) also in Piauí (17.6 to 19.70%), Welke et al. (2008) in the state of Rio Grande do Sul (14.70 to 18.10%), and by Juszczak et al. (2009) in Poland (15.80 to 18.30%).
The diastase activity varied from 5.30 to 12.70 in the Gothe scale (8.24 mean). Eighteen samples (2, 4, 5, 6, 8, 10, 11, 12, 13, 14, 22, 23, 24, 25, 26, 27, 34, 35) (51.43% of all samples) had values lower than those currently allowed in Brazil (8 in the Gothe scale; Brasil, 2000). However, low-enzyme honey must have a diastase activity of at least 3 in the Gothe scale every time the hydroxymethylfurfural content does not exceed 15 mg/kg. However, samples with a low diastase activity content and a high hydroxymethylfurfural content are also found. Values lower than the established diastase activity values have been reported by Balenovic et al. (1988) who analysed 44 honey samples and found that 45.6% of them were not within the established limits, and Vit-Oliver et al. (1994) in Venezuela, found diastase activities from 1.00 to 5.00 (Gothe scale).
The amounts of hydroxymethylfurfural (HMF) varied from 1.50 to 115.20 mg/kg (mean of 14.09 mg/kg). Sample 9 had higher content than the upper allowed one (60 mg/kg). Similarly to our results, Horn et al. (1996) also found a mean of 113.70 mg/kg in honey produced in Northeastern Brazil, well above the legal allowance. Honey collected by Sodré et al. (2002) in the Northern coast of Bahia state presented from 1.50 to 136.00 mg/kg HMF, whereas the samples collected by Moreti et al. (2009) in the state of Ceará, contained 15.7 to 126.5 mg/kg. According to White Júnior (1992), the honey produced in subtropical regions can contain higher HMF concentrations without overheating or adulteration due to the normally high local temperatures.
Protein content varied from 0.12 to 0.37% (0.19% mean), close to those found by Archenti (1984) (mean of 0.18% in Argentina), Arruda et al. (2005) (0.16% in Chapada do Araripe, state of Ceará), and Marchini et al. (2007) (0.05 to 0.58% in the state of São Paulo).
1839
Apis mellifera
in the Picos region, state of Piauí, Brazil
R. Bras. Zootec., v
.40, n.8, p.1837-1843, 201
(%) (%) (%) (%) (Gothe scale) (mg/kg) (%) (%) (meq/kg) (mL/kg) (µS/cm) (mPa.s)
1 80.30 79.70 0.60 18.50 7.90 24.60 0.24 0.14 3.50 25.00 8.00 352.30 1224.00 Extra-light amber
2 82.40 79.10 3.20 16.40 5.90 7.20 0.12 0.14 3.60 11.00 5.00 225.30 2972.00 white
3 80.70 78.60 2.00 18.70 8.10 21.70 0.19 0.15 3.50 23.00 5.00 302.00 976.00 Light amber
4 83.30 78.00 5.10 17.30 7.30 19.20 0.19 0.12 3.60 15.00 6.00 283.00 2056.00 Extra-light amber
5 84.20 80.90 3.10 16.80 6.20 9.10 0.12 0.17 3.90 10.00 5.00 235.70 2524.00 White
6 81.70 74.70 6.70 16.80 6.10 8.30 0.14 0.07 3.60 12.00 5.00 221.00 2600.00 white
7 84.70 81.00 3.50 18.90 9.10 9.30 0.37 0.16 3.40 30.00 11.00 381.00 1076.00 Extra-light amber
8 84.50 81.00 3.30 18.70 7.90 5.40 0.18 0.15 3.60 19.00 7.00 272.30 1320.00 Extra-light amber
9 80.90 79.70 1.20 18.10 9.10 115.20 0.29 0.16 3.60 24.00 7.00 373.00 1396.00 Dark amber
1 0 78.30 78.00 0.20 18.20 6.60 1.50 0.29 0.05 3.50 17.00 6.00 203.70 1592.00 Extra-light amber
1 1 83.00 82.80 0.20 17.10 6.20 5.90 0.19 0.09 3.60 11.00 5.00 193.00 2396.00 Extra-light amber
1 2 84.60 82.80 1.70 17.80 6.10 3.90 0.17 0.07 3.60 14.00 5.00 229.30 1604.00 Extra-light amber
1 3 83.40 81.00 2.20 17.90 6.80 14.00 0.19 0.11 3.50 15.00 6.00 204.00 1780.00 Extra-light amber
1 4 85.70 80.90 4.60 17.20 5.60 7.70 0.13 0.09 3.60 11.00 5.00 192.00 2476.00 white
1 5 84.10 78.80 5.00 18.90 9.80 12.10 0.21 0.14 3.50 19.00 6.00 316.00 960.00 Extra-light amber
1 6 77.30 74.70 2.50 19.00 9.70 11.80 0.21 0.15 3.50 22.00 7.00 318.30 1020.00 Extra-light amber
1 7 84.70 78.80 5.60 18.60 10.30 9.10 0.21 0.11 3.40 23.00 8.00 330.00 1192.00 Extra-light amber
1 8 84.10 77.60 6.00 18.10 12.10 11.30 0.19 0.09 3.50 17.00 6.00 288.00 1448.00 White
1 9 82.60 77.60 4.80 17.80 11.70 10.20 0.19 0.07 3.50 16.00 5.00 276.00 1560.00 White
2 0 84.20 78.40 5.50 18.10 12.70 9.60 0.19 0.08 3.50 19.00 6.00 293.70 1456.00 Extra-light amber
2 1 84.70 80.80 3.70 17.50 9.20 12.00 0.14 0.11 3.50 15.00 5.00 243.70 1804.00 White
2 2 84.70 78.60 5.80 17.30 5.60 7.40 0.12 0.07 3.60 12.00 5.00 194.30 2092.00 White
2 3 83.70 79.30 4.20 17.70 7.10 9.00 0.15 0.07 3.60 16.00 5.00 230.30 1568.00 Extra-light amber
2 4 82.90 78.10 4.60 16.70 5.60 6.20 0.13 0.05 3.60 12.00 5.00 195.70 2696.00 Extra-light amber
2 5 83.80 81.70 2.00 18.60 5.30 4.40 0.18 0.08 3.50 22.00 6.00 233.70 1136.00 Light amber
2 6 81.40 7 9 . 9 0 1.50 18.30 6.40 44.10 0.18 0.11 3.50 19.00 7.00 215.70 1756.00 Light amber
2 7 81.20 80.30 0.80 18.10 6.50 15.00 0.19 0.11 3.50 17.00 5.00 219.00 1056.00 Light amber
2 8 77.10 75.50 1.50 18.70 8.60 6.40 0.14 0.12 3.50 25.00 6.00 220.00 1624.00 Extra-light amber
2 9 82.60 76.80 5.50 17.60 10.60 10.30 0.15 0.11 3.50 16.00 6.00 267.30 1624.00 White
3 0 81.90 77.50 4.10 18.70 11.00 10.40 0.16 0.18 3.50 25.00 6.00 315.00 1048.00 Extra-light amber
3 1 85.80 80.40 5.20 18.70 11.10 9.70 0.20 0.16 3.50 20.00 6.00 319.00 1024.00 Extra-light amber
3 2 82.80 81.70 1.00 18.00 11.80 10.10 0.19 0.09 3.50 16.00 6.00 305.70 1448.00 Extra-light amber
3 3 83.70 78.70 4.80 18.80 11.80 8.20 0.22 0.14 3.50 24.00 7.00 358.70 1044.00 Extra-light amber
3 4 84.20 80.10 3.90 18.70 5.40 15.30 0.16 0.08 3.50 21.00 6.00 286.70 1240.00 Dark amber
3 5 86.80 80.80 5.70 17.80 7.30 7.40 0.19 0.05 3.80 16.00 6.00 294.70 1964.00 Light amber
Average 82.91 79.27 3.47 18.00 8.24 14.09 0.19 0.11 3.55 17.97 6.03 268.26 1621.49
Minimum value 77.10 74.70 0.20 16.40 5.30 1.50 0.12 0.05 3.40 10.00 5.00 192.00 960.00
Maximum value 86.80 82.80 6.70 19.00 12.70 115.20 0.37 0.18 3.90 30.00 11.00 381.00 2972.00
Sodré et al. 1840
R. Bras. Zootec., v.40, n.8, p.1837-1843, 2011
that in addition to the botanical origin of the honey, ash content can vary according to facts occurring during bee foraging, to beekeeper, and to the local climate.
The pH varied from 3.40 to 3.90 (mean 3.55). When analysing honey produced in Brazil, Horn et al. (1996) found a 3.8 mean per state and 3.9 per region. They also found that the lowest pH was obtained in the Northeast (3.4). Arruda et al. (2005), found a mean of 3.71 in honey produced at the Chapada do Araripe, state of Ceará and Sodré et al. (2007), also in Ceará, found 3.36 to 3.78 pH. Frias & Hardisson (1992) say that any honey is acid and that acidity can be affected by its botanical origin. For Rodríguez et al. (2004), honey pH is not directly related to acidity because of the existing relationships among the concentrations of several acids and minerals.
Acidity varied from 10.00 to 30.00 meq/kg (mean 17.97 meq/kg), which is below the maximum limit allowed (50.00 meq/kg) (Brasil, 2000). Archenti & Dasso (1983) found similar results when analysing honey produced in Argentina (8.06 to 31.07 meq/kg). Honey acidity is used to identify its fermentation process and to assess its storage conditions, contributing for an evaluation of honey quality (Cornejo, 1988). For Rodríguez et al. (2004), honey harvest time and botanical origin can impact acidity.
Formol indexes varied from 5.00 to 11.00 mL/kg (mean 6.03 mL/kg) and they were similar to the values obtained from recently-harvested samples by Temiz (1983) in Turkey (4.5 to 8.6 mL/kg. Sodré et al. (2007) found variations from 4.00 to13.00 mL/kg in Ceará. According to Frías & Hardisson (1992), the formol index can be used as an indicator of honey authenticity and to provide information on adulteration with artificial products.
Electrical conductivity varied from 192.00 and 381.00 µS/cm (mean 268.26 µS/cm).Electrical conductivity is affected by the honey floral origin and varies widely according to it. Persano-Oddo et al. (1995) found variations from 90.00 to 2110.00 µS/cm in honey produced from different flowers in Italy. Horn et al. (1996) analysed honey from different regions in Brazil and found electrical conductivity between 100 and 2103.00 µS/cm. In the Northern coast of Bahia, Sodré et al. (2002) found values between 271.67 and 1634.00 µS/cm. In the state of São Paulo, Marchini et al. (2007) report on honey samples with 160.71 to 2865 µS/cm.
Viscosity varied from 960.00 to 2972.00 mPa.s (mean 1621.49 mPa.s). According to Crane (1983) and Abu-Jdayil et al. (2002), honey viscosity can be affected by several factors including composition, temperature, water content, relative density and the high protein content. In the state of São Paulo, Marchini et al. (2007) studied honey samples
with 98.00 to 5090.00 mPa.s., and Sodré et al. (2007) found 536.00 to 2080.00 mPa.s in honey samples in the state of Ceará. The extra-light amber honey was predominant (54.28%), followed by the white (25.71%), the light amber (14.28%) and the dark amber (2.85%) (Table 1). The predominance of light colours were previously reported by Moreti et al. (2006) for the 346 honey samples collected in six states in Brazil. Honey colour is determined by its botanical source and by the local climate and soil conditions. Storage, light, heat and the potential enzymatic reactions may also affect colour (Smith, 1967).
The current Brazilian legislation does not establish values for total sugars, protein, pH, formol index, electrical conductivity or viscosity (Brasil, 2000). However, these parameters have been studied intensively because of their role in characterizing honey production in Brazil.
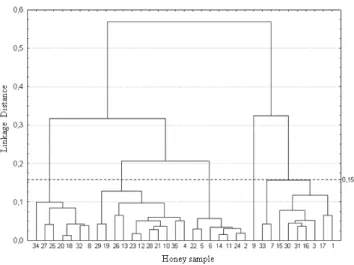
Clusters were determined by using the graph of merging distance in successive steps of the cluster analysis (Figures 1 and 2). This method is based on the identification of a vertical plateau, meaning that several clusters were formed at the same merging distance, where this distance is the optimal cut point in the phenogram, determining the number of clusters formed.
It can be seen in the phenogram (Figure 1) that five clusters were formed: cluster 1 with 7 samples (34, 27, 25, 20, 18, 32 and 8); cluster 2 with 11 samples (29, 19, 26, 13, 23, 12, 28, 21, 10, 35 and 4); cluster 3 with 7 samples (22, 5, 6, 14, 11, 24 and 2); cluster 4 with 1 sample (9), and cluster 5 with 9 samples (33, 7, 15, 30, 31, 16, 3, 17 and 1).
The proximity of samples suggests similar physico-chemical characteristics, such as the samples present in each of the five clusters formed. Otherwise, the distance among samples indicates physico-chemical differences.
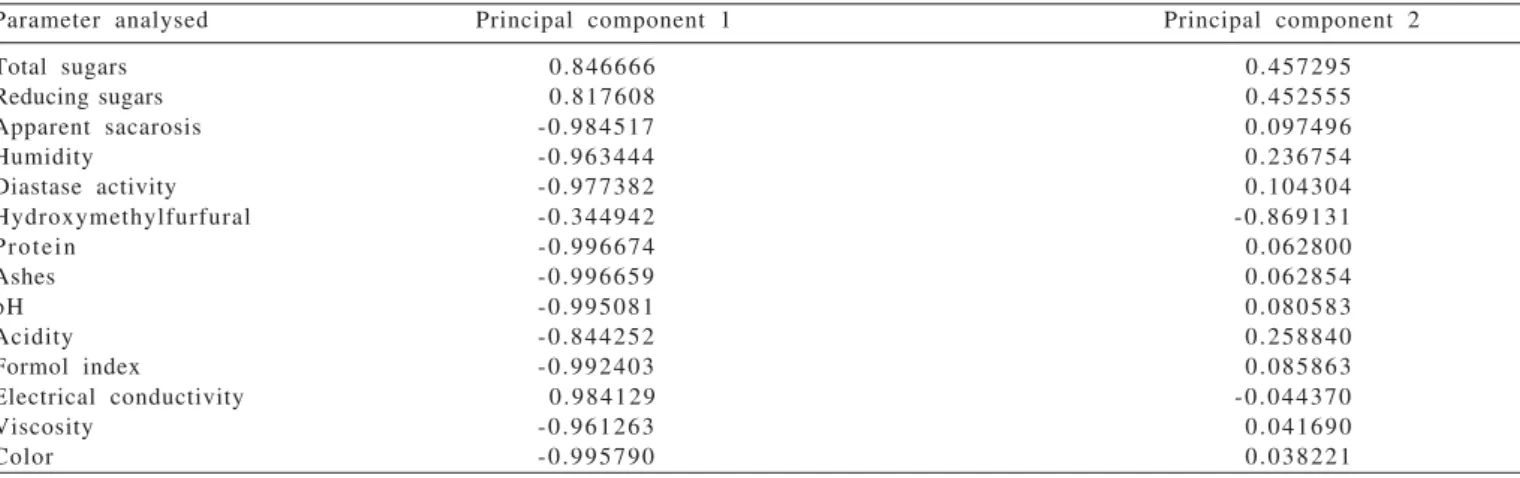
The principal component of analysis (PCA) improves the cluster analysis and confirms similarities and differences in the physico-chemical characteristics of the samples studied (Figure 3).
As shown by the principal component analysis (PCA), the first principal component explained 85.11% of the total data variance and the second explained 94.68% as total variance (Table 2 and Figure 3). For Mardia et al. (1979), the relatively high (usually above 70%) total variance obtained in a principal component analysis by the first two or three components properly explains the variability observed among the samples.
possible that one of the main factors leading to such separation was the honey botanical origin because protein comes from both animals and (mainly) plants. Animal contributions are mainly due to the products of bee salivary glands, whereas plants contribute with nectar and pollen when visited by bees (White Júnior & Rudyj, 1978; Campos, 1987). The floral origin of honey contributed to formation of clusters by a combination of polinic types. The main combinations found in each cluster were: cluster 1 (Borreria
sp., Chenopodium sp. and Piptadenia sp.), cluster 2
(Chenopodium sp., Piptadenia sp. and Tibouchina sp.),
cluster 3 (Piptadenia sp. and Tibouchina sp.), cluster 4
(Chenopodium sp., Croton urucurana, Sida sp. and Tibouchina sp.), and cluster 5 (Chenopodium sp., Mimosa verrucosa, Piptadenia sp. and Tibouchina sp.). The polinic
type Piptadenia sp. significantly contributed for the
formation of most clusters, except for cluster 4, which was far from the others (Figures 1 and 3).
The second principal component with the greatest physico-chemical contribution for cluster formation was HMF. Sample 9 (Cluster 4) had the highest HMF concentration and it was therefore further isolated from the other samples. HMF is one of the most studied of all honey components. It is formed by the reaction of some sugars and acids, mainly by the decomposition of fructose when it is in the presence of acids (White Júnior, 1976). In honey, HMF may indicate overheating, age, addition of inverted sugar and it can be affected by acidity, pH, water and mineral contents (Seeman & Neira, 1988).
Figure 1 - Phenogram obtained by the cluster analysis using the mean Euclidian distance and the method UPGMA for the 35 samples of honey produced by Apis mellifera in the Picos region, state of Piauí, and the
14 physico-chemical characters analysed. Horizontal line = optimal cut.
Principal component Autovalue Accumulated %
Y1 11.91 85.11
Y2 1.33 94.68
Y3 0.40 97.58
Table 2 - Estimates of variance (autovalues) and accumulated percentage of the total variance (%) obtained by the principal component analysis of 35 samples of honey produced by Apis mellifera in the Picos region, state
of Piauí, and its 14 physico-chemical characteristics Figure 2 - Graph of the linkage distances in successive steps of the cluster using the mean Euclidian distance and the method UPGMA. Arrow indicates the optimal cut.
Sodré et al. 1842
R. Bras. Zootec., v.40, n.8, p.1837-1843, 2011
Conclusions
A significant number of analysed honey samples was within the specifications of the current Brazilian legislation for physico-chemical characteristics, except for apparent sacarosis, diastase activity, and hydroxymethylfurfural. Among all the parameters studied, protein and hydroxymethylfurfural were the most important for cluster formation. The diastase activity deserves further studies to implement changes in the current Brazilian legislation.
References
ABU-JDAYIL, B.; GHZAWI, A.A.M.; AL-MALAH, K.I.M. et al. Heat effect on rheology of light and dark-colored honey.
Journal of Food Engineering, v.51, p.33-38, 2002. AMERICAN SOCIETY FOR TESTING AND MATERIALS - ASTM.
Standard test methods for rheological properties of non-n e w t o non-n i a non-n m a t e r i a l s b y r o t a t i o non-n ( B r o o k f i e l d t y p e ) viscometer. Barr Harbor: ASTM Standards, s.d.p., p.1-4. ARCHENTI, A. Chemical composition of honeys from Chubut
province. Revista de Ciências Agrárias, v.5, n.1/4, p.12-28, 1984.
ARCHENTI, A.; DASSO, I. Composición química de mieles de la provincia de Chubut. La Alimentación Latinoamericana,
n.138, p.11-19, 1983.
ARRUDA, C.F.M.; MARCHINI, L.C.; MORETI, A.C.C.C. et al. Características físico-químicas de méis da Chapada do Araripe/ Santana do Cariri- Ceará. Acta Scientiarum, v.27, p.171-176, 2005.
SSOCIATION OF OFFICIAL ANALYTICAL COUNCIL – AOAC.
Official methods of Analysis. 2.ed. Washington: AOAC, 1990. 1018p.
ATAGO Co. Refratômetro para mel. Abelhas, v.31, n.362/363, p.9, p.11-12, 41-44, 1988.
AZEREDO, M.A.A.; AZEREDO, L.C.; DAMASCENO, J.G. Características físico-químicas dos méis do município de São Fidélis-RJ. Ciência e Tecnologia de Alimentos, v.19, n.1, p.3-7, 1999.
BALDI-CORONEL, B.; DALL’OGLLIO, A.M.; LEZCANO, S. et al. Caracterización físico químico de las mieles de la Provincia de Entre Rios. A l i m e n t a c i ó n L a t i n o a m e r i c a n a, v.199, p.39-44, 1993.
Parameter analysed Principal component 1 Principal component 2
Total sugars 0.846666 0.457295
Reducing sugars 0.817608 0.452555
Apparent sacarosis -0.984517 0.097496
Humidity -0.963444 0.236754
Diastase activity -0.977382 0.104304
Hydroxymethylfurfural -0.344942 -0.869131
Protein -0.996674 0.062800
Ashes -0.996659 0.062854
pH -0.995081 0.080583
Acidity -0.844252 0.258840
Formol index -0.992403 0.085863
Electrical conductivity 0.984129 -0.044370
Viscosity -0.961263 0.041690
Color -0.995790 0.038221
Table 3 - Contribution for the formation of the principal components of the physico-chemical parameters studied for the 35 samples of the honey produced by Apis mellifera in the Picos region, state of Piauí
BARTH, M.O. O pólen no mel brasileiro. Rio de Janeiro: Gráfica Luxor, 1989. 151p.
BARTH, O.M. Análise microscópica de algumas amostras de mel. 1. Pólen Dominante. A n a i s d a A c a d e m i a B r a s i l e i r a d e Ciências, v.42, p.351-366, 1970a.
BARTH, O.M. Análise microscópica de algumas amostras de mel. 2. Pólen Acessório. A n a i s d a A c a d e m i a B r a s i l e i r a d e Ciências, v.42, p.571-590, 1970b.
BARTH, O.M. Análise microscópica de algumas amostras de mel. 3. Pólen Isolado. Anais da Academia Brasileira de Ciências, v.42, p.747-772, 1970c.
BARTH, O.M. Análise microscópica de algumas amostras de mel. 6. Espectro polínico de algumas amostras de mel dos Estados da Bahia e do Ceará. Revista Brasileira de Biologia, v.31, p.431-434, 1971a. BARTH, O.M. Mikroskopische Bestandteile brasilianischer
Honigtauhonige. Apidologie, v.2, p.157-167, 1971b.
BARTH, O.M. Pollen in monofloral honeys from Brazil. Journal of Apicultural Research, v.29, p.89-94, 1990.
BALENOVIC, J.; PERKCVAC, M.; PAPIC, J. Hydroxymethylfurfural content and amylase activity in honey. P rehrambeno TehnoloskaRevija, v.26, n.4, p.143-146, 1988.
BOLETIN OFICIAL ESPAÑOL – BOE. Orden de 12 de junio de 1986, de la Presidencia del Gobierno por la que se aprueban los métodos oficiales de analisis para la miel. BOLETIN OFICIAL ESPAÑOL, n.145, p.22195-22202, 1986.
BRASIL. Ministério da Agricultura. Instrução normativa nº 11, de 20 de outubro/2000. Regulamento técnico de identidade e qualidade do mel. Available at: <http://www.agricultura.gov.br/ sda/dipoa/anexo>. Accessed on: Jan. 30, 2001.
CAMPOS, R.G.M. Contribuição para o estudo do mel, pólen, geléia real e própolis. Bolet im da Faculdade de Fa r macia de Coimbra, v.11, n.2, p.17-47, 1987.
CARNEIRO J.G.M.; SOUZA D.C.; MURATORI M.C.S. Características físico-químicas de 132 amostras de mel de abelhas da microrregião de Simplício Mendes, PI. In: CONGRESSO BRASILEIRO DE APICULTURA, 14., 2002, Campo Grande. Anais... Campo Grande: Confederação Brasileira de Apicultura, 2002. p.76. CODEX ALIMENTARIUS COMMISSION - CAC. Official
methods of analysis. v.3, Supl. 2, p.(s.n.p.), 1990.
CORNEJO, L.G. Tecnologia de miel. In: SEEMANN, P.; NEIRA, M. (Ed.). Tecnologia de la produccion apicola. Valdivia: Universidad Austral de Chile, Facultad de Ciencias Agrarias, 1988. p.145-171.
CRANE, E. Livro do mel. Trad. de Astrid Kleinert Giovannini. São Paulo: Nobel, 1983. 226p.
ERDTMAN, G. P o l l e n m o r p h o l o g y a n d p l a n t t a x o n o m y – Angiosperms. Stockholm: Almqvist e Wiksell, 1952. 539p. FRÍAS, I.; HARDISSON, A. Estudio de los parámetros analíticos de
interés en la miel. II: Azúcares, cenizas y contenido mineral y color. Alimentaria, v.28, n.235, p.41-43, 1992.
HORN, H.; DURÁN, J.E.T.; CORTOPASSI-LAURINO, M. et al. Méis brasileiros: resultados de análises físico-químicas e palinológicas. In: CONGRESSO BRASILEIRO DE APICULTURA, 11., 1996, Teresina. Anais... Teresina: Confederação Brasileira de Apicultura, 1996. p.403-429.
JUSZCZAK, L.; SOCHA, R.; ROZNOWSKI, J. et al. Physicochemical properties and quality parameters of herbhoneys. F o o d Chemistry, v.113, p.538-542, 2009.
KOMATSU, S.S.; MARCHINI, L.C.; MORETI, A.C. de C.C. Análises físico-químicas de amostras de méis de flores silvestres, de eucalipto e de laranjeira, produzidos por Apis mellifera L., 1758
(Hymenoptera, Apidae) no Estado de São Paulo. 2. Conteúdo de açúcares e de proteína. C i ê n c i a e Te c no l o g i a d e Alimentos, v.22, n.2, p.143-146, 2002.
LASCEVE, G.; GONNET, M. Analyse par radioactivation du contenu minéral d’un miel. Possibilité de préciser son origine géographique. Apidologie, v.5, n.3, p.201-223, 1974. LOUVEAUX, J.; MAURIZIO, A.; VORWOHL, G. Methods of
Melissopalinology. Bee World, v.59, n.4, p.139-157, 1978. MARCHINI, L.C.; SODRÉ, G.S.; MORETI, A.C.C.C. et al.
Composição físico-química de amostras de méis de Apis mellifera
do Estado de Tocantins, Brasil. Boletim da Industria Animal, v.61, n.2, p.121-134, 2004.
MARCHINI, L.C.; MORETI, A.C.C.C.; OTSUK, I.P. et al. Physicochemical composition of Apis mellifera honey samples
from São Paulo State, Brasil. Química Nova, v.30, p.1653-1657, 2007.
MARDIA, L.V.; KENI, J.T.; BIBBY, J.M. Multivariate analysis. London: Academic Press, 1979. 521p.
MORAES, R.M. Análise de mel. Pindamonhangaba: Centro de Apicultura Tropical, IZ/SAA, 1994. SNP. 1v., (Manual técnico). MORAES, R.M.; TEIXEIRA, E.W. Análise de mel.Pindamonhangaba,
1998. 42p. (Manual Técnico).
MORETI, A.C.C.C.; SODRÉ, G.S.; MARCHINI, L.C. et al. Cor de amostras de méis de A p i s m e l l i f e r a de diferentes estados
brasileiros. Boletim de Indústria Animal, v.63, n.3, p.159-164, 2006.
MORETI, A.C.C.C.; SODRÉ, G.S.; MARCHINI, L.C. et al. Características físico-químicas de amostras de méis de Apis mellifera L. do estado do Ceará, Brasil. Ciência Agrotécnica, v.33, n.1, p.191-199, 2009.
MORRISON, D.F. Multivariate statistical methods. 2.ed. Tokyo: Mc Grow Hill, 1981. 415p.
PERSANO-ODDO, L.; PIAZZA, M.G.; SABATINI, A.G. et al. Characterization of unifloral honeys. Apidologie, v.26, p.453-465, 1995.
PREGNOLATO, W.; PREGNOLATO, N.P. Métodos químicos e físicos para análise de alimentos. In: PREGNOLATO, W.; PREGNOLATO, N.P. (Coords.). Normas analíticas do Instituto Adolfo Lutz. 3.ed. São Paulo: Instituto Adolfo Lutz, 1985. v.1, 533p. RENDÓN, S.R. Estudio de la composicion fisico-quimica de las
mieles extremeñas y extranjeras. In: CONGRESSO IBERO
LATINOAMERICANO DE APICULTURA, 5., 1996, Mercedes. Anais… Mercedes: Cooperativa CALMER, 1996. p.174-183.
RODRÍGUEZ, G.O.; FERRER,B.S.; FERRER, A. et al. Characterization of honey produced in Venezuela. F o o d Chemistry, v.84, p.499-502, 2004.
SEEMANN, P.; NEIRA, M. Te c n o l o g í a d e l a p ro d u c c i ó n apícola. Valdivia: Universidad Austral de Chile; Facultad de Ciencias Agrarias Empaste, 1988. 202p.
SILVA, A.F. Zoneamento apibotânico de ecossistemas do Piauí (Resultados preliminares). In: CONGRESSO BRASILEIRO DE APICULTURA 14., 2002, Campo Grande, MS. A n a i s . . . .
Campo Grande: CONBRAPI, 2002. v.1 p.31.
SILVA, C.L.; QUEIROZ, A.J.M.; FIGUEIREDO, R.M.F. Caracterização físico-química de méis produzidos no Estado do Piauí para diferentes floradas. Revista Brasileira de Engenharia Agrícola e Ambiental, v.8, n.2/3, p260-265, 2004.
SILVA, D.J.; QUEIROZ, A.C. Determinação do nitrogênio total e da proteína bruta. In: SILVA, D.J.; QUEIROZ, A.C. (Eds.)
Análise de alimentos: métodos químicos e biológicos. 3.ed. Viçosa, MG: UFV, 2002. p.57-75.
SMITH, F.G. Deterioration of the colour of honey. Journal of Apicultural Research, v.6, n.2, p.95-98, 1967.
SODRÉ, G.S.; MARCHINI, L.C.; CARVALHO, C.A.L. Características físico-químicas de amostras de méis de abelha Apis mellifera
da região litoral norte do Estado da Bahia. R e v i s t a d e Agricultura, v.77, n.2, p.243-256, 2002.
SODRÉ, G.S.; MARCHINI, L.C.; MORETI, A.C.C.C. et al. Caracterização físico-química de amostras de méis de Apis m e l l i f e r a L. (Hymenoptera: Apidae) do Estado do Ceará. Ciência Rural, v.37, n.4, p.1139-1144, 2007.
STATISTICAL ANALYSYS SYSTEM - SAS. SAS Institute, 8.02 version, 2001.
TEMIZ, A.I. Composition and characteristics of honeys from the Izmir region, and effects of different storage methods. (compact disc) Ege Bolge Zirai Arastirma Enstitusu Yayinlari, v.31, n.11, p.113, 1983. Resumo em CAB Abstracts, v.1, 1984-1 9 8 6 .
VIDAL, R.; FREGOSI, E.V. Mel: características, análises físico-químicas, adulterações e transformações. Barretos: Instituto Tecnológico Científico “Roberto Rios”, 1984. 95p.
VIT-OLIVER, P.; MARTORELLI, L.G.; PALACIOS, S.L. Classificación de mieles comerciales venezuolanas. Archivos latinoamericano de Nutricion, v.44, n.1, p.39-44, 1994. WELKE, J.E.; REGINATTO, S.; FERREIRA, D.; et al.
Caracterização físico-química de méis de Apis mellifera L. da
região noroeste do Estado do Rio Grande do Sul. Ciência Rural, v.38, n.6, p.1737-1741, 2008.
WHITE JÚNIOR, J.W. Composition of honey. In: CRANE, E. (Ed.). Honey a comprehensive survey. London: Heinemann, 1976. p.157-206.
WHITE JÚNIOR, J.W. Quality evaluation of honey: role of HMF and diastase assays. Part II. American Bee Journal, v.132, n.12, p.792-794, 1992.
WHITE JÚNIOR, J.W.; RUDYJ, O.N. The protein conten in honey.