Ana Lúcia Pinto da Silva Universidade Presbiteriana Mackenzie Renato Câmara Nunes Dias
Universidade de São Paulo Carlos César Santejo Saiani Universidade Federal de Uberlândia Carlos Eduardo Carvalho Pontifícia Universidade de São Paulo
Resumo
O artigo analisa a distribuição dos desembolsos do Banco Mundial (BM) na América Latina e Caribe, de 1985 a 2010, entre países e entre se-tores econômicos. O objetivo é identificar tendên-cias que ajudem a compreender os critérios que orientam a atuação do BM e como esses critérios se articulam com o entendimento do BM sobre sua missão declarada de combater a pobreza extrema. O artigo testa a existência desses critérios, pela análise econométrica dos desembolsos por país em relação a renda per capita, pobreza, índice de Gini, população, regime político, investimento, gastos do governo. Analisa-se também a distribui-ção dos recursos por setores da economia, em sub-períodos selecionados. Para a análise dos resul-tados, adota-se o critério de “aderência” entre as prioridades na divisão dos recursos, os indicadores dos países e a natureza dos setores privilegiados. A análise da divisão dos recursos pode contribuir também para a compreensão de como o próprio BM entende os significados das orientações que afirma seguir.
Palavras-chave
distribuição de desembolsos do Banco Mundial; América Latina e Caribe; pobreza; pobreza ex-trema; ajuda internacional
Códigos JELF35; F53; I30. Abstract
This article analyzes the distribution of World Bank disbursements in Latin America and the Caribbean, in the period between 1985 and 2010, among countries and economic sectors. Its objective is to identify tendencies that help understand the criteria that guide WB activities and how these criteria relate to WB’s understanding on its declared mission of combating extreme poverty. The article tests the existence of such criteria, with the econometric analysis of disbursements per country in relation to per capita income, poverty, GINI index, population, political regimes, investment, and government expenditure. Disbursements distribution among economic sectors is also analysed in selected timespans. In order to analyse the results, the article uses the criterion of “adherence” among the priorities in resources distribution, countries’ indicators and the nature of privileged sectors. The analysis on resources distribution may also contribute to the understanding of how the WB understands the meaning of the guidelines it states.
Keywords
distribution of World Bank disbursements; Latin America and the Caribbean; poverty; extreme poverty; international aid
JEL CodesF35; F53; I30.
Analysis of the distribution of World Bank
disbursements in Latin America between 1985
and 2010
1 Introduction
This paper analyzes the actions of the World Bank (WB) in Latin Ame-rica and the Caribbean (LAC) based on a recipients-oriented perspec-tive: an analysis which aims at trying and identifying trends in the Bank’s resources distribution in relation to a set of economic and so-cial indicators, among economic sectors, that outline LAC countries reality as recipients.
While studying the actions of international financial institutions, such as the WB, three main perspectives are commonly used as analytical gui-delines. While many authors focus on the efficiency of WB’s projects in specific countries and regions (Hansen; Tarp, 2000; Nath, 2005; Santiso, 2001; Ismi, 2004; Bourguingnon; Sundberg, 2005), in a literature one might name as aid effectiveness literature; others look into the WB through the len-ses of what one may call governance literature, trying and understand the Bank’s institutional arrangements and issues (Vikas, 2001; Griffith-Jones, 2002; Buira, 2005; Bhalla, 2006; Foch, 2007; Kaluza; Kaluza, 2008). Moreo-ver, others center their analytical efforts on what one may name concep-tions literature, one that revolves around the Bank’s discourse and its alleged purposes and stated objectives, made more or less clear in its official do-cuments and World Development Reports (Hibou, 2000; Teixeira, 2009; Pereira, 2010; Vianna Jr., 2008; Rached, 2010).
The authors of the present work, however, believe there is much to be studied on what seems to motivate the WB to distribute its resources. Hence, recognizing the importance of the conceptions literature, instead of analysing the criteria enshrined in WB official documents, we aim at identifying cri-teria actual trends by analysing the true disbursements distribution made by the bank in Latin America and the Caribbean.
establish a safe ground to assess, based on the WB’s alleged preoccupation with poverty, the organization’s actions.
This paper’s objectives can be defined as follows:
(i) quantify disbursements distribution among countries in Latin America and the Caribbean, with data offered by the World Bank’s projects database;
(ii) to analyze if there are clear criteria that may explain the distribution of resources among countries in the region, using econometric tests that relate existing resources distribution with countries’ characteristics. These features have been selected by the authors because of their relation to the World Bank’s stated mission of “fighting extreme poverty”: countries’ per capita income, poverty levels, inequality (Gini index), GDP, democracy, investment levels, government expenditure. The authors seek to identify, based on the resources distribution analysis, how the World Bank renders its mission of fighting real poverty – that is, if some tested characteristics better explain the amounts received by LAC countries;
(iii) to analyze resources distribution among economic sectors for the set of countries in the region, with the same purpose of identifying secto-rial preferences by the WB and the relation of these preferences with the Bank’s alleged mission of fighting extreme poverty.
(iv) to establish the relation, once the quantitative analysis on resour-ces distribution among countries and sectors is made, between the re-sults and WB’s discourse on how poverty should be tackled, based on the Bank’s own documents and selected works on its comprehension on fighting poverty.
The analysis on resources distribution among economic sectors, in the set of countries, is done using the classification made by the World Bank, which sorts its projects in “Major Sectors”. The tagging – made by the Bank in its projects database – of every project with up to 5 of the 10 Major Sectors may account for arbitrariness, which may affect the results quality. However, it is impossible to scrutinize every project in detail. The data has been sorted into five sub-periods, so that the WB preferences changes can be more easily identified, thus offering meaningful conclusions on how the Bank operates its mission of fighting extreme poverty.
action (resources disbursement distribution) and (ii) the recipients’ socio--economic needs. In other words, adherence may be identified when higher disbursements amounts are offered to countries with relative lower economic and social standards. Hence, this paper will test the hypothesis that lower economic and social standards in countries are met with rela-tive larger amounts of disbursements by the bank, which would indicate
adherence. Any other scenario would indicate a lack of adherence, which,
in its turn, would lead to the conclusion that there is a certain lag between the WB’s discourse and its real, practical action in meeting the challenge of poverty alleviation.
Hence, considering WB goals of alleviating poverty and fostering de-velopment, the present work seeks to answer the following fundamental question: Can any trend be outlined in disbursements distribution in LAC?
This umbrella-question is specified as follows.
(i) Knowing that the WB allegedly aims at combating poverty, can any trend be outlined in disbursements distribution in LAC in relation to these countries’ social and economic profiling?
(ii) Bearing in mind that the disbursements distribution among econo-mic sectors is a possible proxy for understanding the WB’s view on develo-pment and poverty alleviation, can any trend be outlined in disbursements distribution in relation to economic sectors (such as agriculture, public ad-ministration, etc)?
2
References for analysis
For a start, we may establish that the World Bank (WB), hereby understood as the coupled institutions International Development Association (IDA) and International Bank for Reconstruction and Development (IBRD), is an International Financial Institution (IFI), classified as a Multilateral Deve-lopment Bank (MDB), which issues loans and grants for the purpose of poverty reduction in countries around the globe, hereby understood as development assistance (DA), in a broad sense.
Development assistance should not be mistaken for Official Development
Assistance (ODA), which comprises flows of official financing adminis-tered with the promotion of the economic development and welfare of developing countries as the main objective and stems from agencies or governmental departments that provide financial aid to non-governmental organizations (NGOs) and community-based organizations.
If one was to look only to ODA, in the present analysis, only IDA should be studied, decoupled from IBRD. As it is outlined in the institution’s of-ficial webpage the IBRD’s primary business is offering loans and policy advice to client governments, differing from IDA, whose main goal is to provide development assistance (in this case ODA) on terms which are more flexible and bear less heavily on the balance of payments than those of conventional loans, including those of the IBRD itself. For that reason, to analyze both IDA and IBRD altogether, the term development assistance suits the present study better, comprising the action and the assistance flows of both institutions.
conditions that, in the Bank’s view, would favour development (Rached, 2010, 49).
The 1990s and 2000s saw an increase in poverty in a number of countries due to economic liberalization policies, which were supported by the WB. One of its responses to those crises was a growing emphasis on “structural adjustment” programs, based on the argument that infrastructure finan-cing could be made by the private sector, once legal and operational condi-tions were laid out by governments. Rached (2010, p.52) understands that the WB progressively incorporated in its assistance programs the percep-tion that economic growth and poverty reducpercep-tion require not only suitable economic policies, but also the strengthening of adequate institutions that would generate a “favourable environment” for development. There are indications which show that, in this period, WB moved from growth sti-mulus policies to poverty fighting focal policies (Ugá, 2004), which offers an important perspective on what will be shown in the coming sections as the operation of resources distribution so as to prioritize the generation of this favourable environment, mainly through the enhancement of public administration structures.
In practical terms, the creation, in 1992, of the Institutional Develop-ment Fund (IDF) is an indication of World Bank Group’s awareness on the necessity of special efforts towards State structures. The Fund has since been focusing its action on 5 areas: governance and anticorruption, enga-gement with civil society organizations, use of country systems, program--for-results financing, and knowledge platforms.
Ten years after the launch of IDF, WB’s 2002 World Development Re-port, entitled “Building institutions for markets”, established that income from participation in the market is a condition for poverty reduction and once market efficiency is dependent on institutions-provided incentives, institutions should be designed, enhanced and innovated, so as to guaran-tee distribution, access, empowerment and competition amongst econo-mic and social players (2002, p.3-8).
Currently, WB’s main objective, as outlined in its official webpage, is to fight poverty, based on two goals the world should achieve by 2030: (i) end extreme poverty by decreasing the percentage of people living on less than US$1.25 a day to no more than 3% and (ii) promote shared prosperity by fostering the income growth of the bottom 40% for every country.
Clearly, a natural and logical step taken by the analyst of these actions is to try and understand how effective the Bank’s actions in facing po-verty have been. That is the effort undertaken by authors such as, among others, Santiso (2001), who establishes the connection between political performance and inclusion as fundamental to economic feasibility of de-velopment assistance; Bourguignon and Sundberg (2008), who analyse the complexity of the causality chain between development assistance and development outcomes, and Ismi (2004), who, while analysing WB resources conditionality, claims that the Bank’s work in Africa has been highly counter-productive and negative to the region.
multilateral institutions, commercial banks, export credit agencies, and private sector investors.
In Sogge’s (2002) prologue, José Antonio Alonso offers a glance at the theoretical approach that includes DA in a context of global governance in terms of what is defined as governance by Keohane and Nye (2000). That is why it takes into consideration the globalized reality of the world and the perception that poverty – seen as an impeditive to development – is not simply an issue born within the boundaries of the countries haunted by it. This perception poses the question of both poverty and develop-ment as global issues that should, therefore, be considered, discussed and decided upon in organizations with global scope and, supposedly, inclusi-ve institutional arrangements.
Sogge (2002, p. 10) himself presents an essential question on the matter of governance, considering if it “is reasonable that countries which nor-mally benefit from an asymmetric international relations system are also those to whom the responsibility is given to correct (through foreign DA) the malefactions consequent of this very system”.
This quotation marks the fundamentals of what he has decided to call
governance literature on the WB, as previously analysed by authors such
as Swedberg (1986), Lichtensztejn and Baer (1987), Griffith-Jones (2002), Wade (1998), Allegret and Dulbecco (2003), Borges (2003), and Kapur (2006).All these authors, in one way or another, are worried about how countries are institutionally represented, how their voices are made heard within the organization and how open and permeable are to the coun-tries’ interests.
As she states, the Bank’s conceptual framework for action is underpin-ned by liberal economic policy, which is made clear by a series of WB documents and analyses focused on the supposed positive effects of libe-ralization, presented by the author1.
Likewise, while analysing the World Development Reports, Teixeira (2009) asserts that market is prioritized over society, markedly in recom-mendations for Brazilian policy-makers to undertake greater market libe-ralization and seek rapid growth instead of looking for income distribu-tion policies. The author stresses that the Bank’s discourse, indicator of its own conceptions of poverty alleviation, growth and development, reduces social protection to a simple focus on those who are in extreme need, in lieu of truly transforming social and economic conditions in favour of pro-found social changes.
Pereira (2010), in his turn, presents the transformations of the WB’s dis-course in dealing, in the late 1990s, against all odds and its own previous postures, with the role of state as an important player in development. Be-sides, the author demonstrates the criticism of the Bank’s scientific bases and biases while analysing poverty alleviation and development around the world: its research agenda is largely determined by political prescrip-tions lined up with the neoliberal schema.
While Hibou (2000) and Teixeira (2009) question the conceptions that inform the Bank’s actions, Fuller (2002, p.3) serves as an interesting contri-bution, and a typical example of what we decide to call conceptions literatu-re. In her work, the author points out “well based analytical perspectives on foreign aid”, which may be transposed into WB’s projects analysis, as previously proposed. According to her, one might see DA (and the Bank’s projects distribution in LAC) through (i) an idealist perspective or (ii) a realist perspective.
From an idealist perspective, one might suppose that the WB’s loans and credit flows would have been directed to LAC with a humanitarian con-cern, which means it would be reasonable to find larger projects amounts in those countries with a lower average income, in lieu of middle income countries. Therefore, one may conclude that, if WB’s credits and loans projects flows were directed, in the period, to countries with a lower per capita income, then, the institution has, indeed, a humanitarian posture,
aiming at countries where poverty is a problem, in line with its website’s heading: “working for a world free of poverty”.
From a realist perspective, DA flows should be seen as part of strategic concerns from the main players involved in the decision-making process within the WB markedly those likened to security and self-preservation. This perspective is clearly tributary to the Cold War moment, confluent to Alonso’s tradition. In this context, according to Schraeder et al. (1998, p. 296 apud Fuller, 2002, p.3-4), DA “is perceived as only minimally
rela-ted to recipient economic development and the humanitarian needs are downplayed”. This perspective sets in the focus of the discussion the role of governance within the institution, as already pointed out by authors such as Swedberg (1986), Lichtensztejn and Baer (1987), Allegret and Dul-becco (2003) and Pereira (2010).
Fuller’s analytical landmarks recognize the role of a conceptual frame-work or posture coupled with an institution’s real action (Fuller, 2002). That is, precisely, what the authors of the present work seek: in analysing the amounts distributed to LAC countries and combining them with socio--economic indicators, we seek to test the Bank’s proposition of a “poverty alleviation” agenda. Hence, we seek to analyse (i) the socio-economic
pro-filing of WB disbursements in recipient countries and (ii) the distribution
of resources according to economic sectors.
3
Methodology for an analysis on resources
distribu-tion among countries
We move to econometric tests in order to assess if the WB has indeed dis-tributed its resources in Latin America and the Caribbean, in the period between 1985 and 2010, in terms of countries poverty challenges: one should expect that a larger average amount of finance is directed to relati-vely less developed countries. Thus, a panel estimation method is applied considering fixed effects (Within estimator2 ), with information about 30
2 The Within estimator is commonly seen by a number of authors as a consistent tool for controlling the effects of analysis units’ (in this case, countries) characteristics that do not
vary in time (fixed effects). Dependent and independent variables, of each i country and in
each t year are transformed into deviations in relation to the respective averages. For a deeper
Pis-countries in Latin America and the Caribbean, between the years 1985
and 2010 (26 years), defined in function of the availability of data neces-sary to the tests3. The estimated models are based on the equations (1)
and (2) below:
where: β0 and α0 are constant (intercepts);
d_WBit is the dependent variable, that corresponds to the total dis-bursed amount by the WB (for the various sectors for which the bank offers financial assistance) received by country i (in millions of US$ at 2011 international prices) in year t ( t = 1985,1986,…,2010)4;
GDP per capitait is country i ’s Gross Domestic Product (GDP) per capita in year t; GDPit is country i ’s GDP in year t; β1 and α1 are the coefficients associated, respectively, to these;
Povertyit is the poverty rates in country i in year t (percentage of the population living on less than US$3.10 a day at 2011 international prices); β2 and α2 are the coefficients associated to it;
Giniit is the Gini index in country i in year t; β3 and α3 are the
coef-ficients associated to it;
Populationit is the population size (number of inhabitants) in
country i in year t; β4 and α4 are the coefficients associated to it; Iit is a vector of institutional variables in country i in year t; β5 and
α5 are the vector of coefficients associated with these;
Xit is a vector of two variables that represent the GDP composition (investment and government expenditure) in country i in year t; β6 and α3 are the vector of coefficients associated with these;
ui are the non-observed characteristics which differ among coun-tries but which are fixed in time (fixed effects);
εit is the random error. chke (2009) and Cameron and Trivedi (2009).
3 Estimations with heteroscedasticity-consistent standard errors.
4 Information made available by the WB: www.worldbank.org/en/region/lac/projects. (1)
(2)
0 1 2 3
_ it it it it
d WB GDP per capita Poverty Gini
0 1 2 3 4
_ it it it it it
d WB GDP Poverty Gini Population
4 5 6
. Populationit Iit Xit ui it
5 6
GDP per capita and GDP variables have been obtained with Penn World Table 7.1 (PWT 7.1)5. Once the present study assesses if resources
transfer-red by WB are influenced by levels of income in countries, these are two of the variables of higher interest, not employed in the same estimations for being collinear and, when coupled with Population, for resulting in per-fect collinearity. Besides this technical explanation, the use of both varia-bles instead of one is justified because they may each capture different analytical aspects. While per capita GDP may indicate WB’s preference for countries with higher or lower levels of poverty (or average income), total GDP may indicate the bank’s preference for smaller or larger econo-mies. Larger economies, for example, can have larger synergies for WB’s disbursements, which would maximize their efficiency. We may suppose, still, that WB would consider the interests of large capital groups, suppose-dly more interested in WB projects that would increase general efficiency, which is more plausible in larger economies.
In a broader perspective, if the coefficients associated with these va-riables (β1 and α1) are negative and significant, there will be evidence that
do not refute the hypothesis of “adherence” between WB’s resources dis-bursement decision and countries’ profiling, which is the same as saying that the Bank is fulfilling its goal of a supporter and partner in the fight against poverty. On the other hand, if β1 > 0 and/or α1 > 0 (significant), the
evidences will suggest that the criterion for resources distribution is not compatible with what is expected from a multilateral development bank. In this scenario, resources are not directed, in their majority, to countries in greater need (least developed countries). Hence, one may affirm that WB is not acting effectively towards the fulfilment of the objectives one may expect from it to uphold. In this case, one may infer that the returns on projects in countries with higher income levels are higher and the bank would be distributing resources motivated by economic feasibility and re-turn prospects.
The third variable of interest in this study is Poverty, calculated with
WB data. It is inserted in the estimations with the objective of assessing if WB considers the portion of people living below the poverty line in its recipient countries as a decisive factor in its disbursements distribution.
WB reports and studies, besides external analyses, show that, since the 1990s, the Bank has started to prioritize focal poverty combating policies other than stimulating growth in poorer countries (Ugá, 2004; World Bank, 1988, 1989, 1993, 1994, 2000, 2001, 2002, 2013). Hence, estimated Poverty coefficients β2 and α2, if positive (and significant), may also suggest that there is adherence in distribution criteria for LAC countries, which means that the Bank disburses larger amounts for countries with larger propor-tions of poor people.
Another interest variable is Gini, which is inserted in the estimations with the objective of capturing additional evidences related to the exis-tence or non-exisexis-tence of social motivation for fighting poverty in WB’s disbursements decision6. It is important to underline that a development
institution should prioritize least developed countries and countries with lower development levels that tend to have higher income concentration7.
If there is a social preoccupation in disbursements, Gini variable coef-ficients ( β3 and α3 ) must be positive (and significant); other results would refute this hypothesis.
The last interest variable is Population, used to control for the possibility of WB, while deciding upon the disbursements distribution, considering countries’ population sizes. On the one hand, the larger the number of inhabitants, the more elevated will be the number of people who may benefit from the investment, which could motivate the WB in case it is worried about socio-economic impacts of its disbursements. On the other hand, even if such preoccupation exists, the larger the number of inhabi-tants, the more elevated would be the probability of project success, once countries with larger populations would tend to have, in most sectors, larger capacity of generating revenue and small costs (scale economies), affecting projects’ economic feasibility and return.
Hence, if estimated coefficients associated with the Population variable ( β4 and α4 ) are positive (and significant), it is possible that it is due to a social bias that should motivate a multilateral development institution,
such as the WB; however, it is also possible that it is due to economic bias, in supporting economically feasible projects. Facing this possibility, the population must be controlled for, but its results analysis should also combine and be matched with GDP and Gini index.
According to Abrucio and Loureiro (2004), international organizations, such as the WB, have been advocating and broadcasting the idea that de-velopment, in many countries, shall not be achieved only with resources transfers for investments. Moreover, institutional reforms would be
neces-sary in order to reduce inefficiencies in governments’ resources allocation, so that practices such as corruption and cronyism are eliminated (or, at least, diminished), once they have a negative impact on economic perfor-mance. According to Schneider and Doner (2000), this (a larger focus on institutional change) is due to the influence of institutional theories in the-se organizations. The authors highlight, in this context, the World Bank, which stands up for democratic institutions as one of the pillars of deve-loped countries, emphasizing their role in contracts guarantees, in legal processes efficiency and in decision transparency. Ugá (2004) and Rached (2010) state that, besides focal poverty combating policies, one of WB’s priorities from the 1990s on, especially after the Washington Consensus, has precisely been those policies which induced countries into institutio-nal reform processes.
Thus, it is possible that the WB decides upon the distribution of its dis-bursements according to countries’ institutional framework. On the one hand, it could give privilege to countries that already have a “favourable” framework, closer to what the bank stands up for. On the other hand, it could privilege countries with a “non-favourable” institutional framework, aiming to induce them to implement institutional reforms. In order to con-trol for these possible motivations, three political regime variables shall be considered in the estimations: democracy, autocracy and duration. Also, interac-tions among the three variables shall be incorporated. They are represented in equations (1) and (2) by vector Iit, associated with coefficients β5 and α5.
to 5, an anocracy. According to the authors: democracy and autocracy are normally seen as contrasting and different forms of governance. The main differences are found in the ways executive power is acquired and transfer-red, how the political power is exercised and constrained, how the social
order is defined and maintained, and how much influence public interests and opinion have on decision-making process. Therefore, anocracies can be understood as countries whose governments are not fully democratic, not fully autocratic but, instead, combine a, commonly, incoherent mix of democratic and autocratic traits and practices (Marshall; Cole, 2011).
Democracies have institutionalized procedures for open, competitive, and deliberative political participation; choose and replace chief executi-ves in open, competitive elections; and impose substantial checks and ba-lances on the discretionary powers of the chief executive. In autocracies, by contrast, citizens’ participation is sharply restricted or suppressed; chief executives are selected according to clearly defined (usually hereditary) rules of succession from within the established political elite; and, once in office, chief executives exercise power with no meaningful checks from legislative, judicial, or civil society institutions.
According to this classification, democracy variable is a dummy that has 1 as value if the country i in year t has a score i in the Polity IV database between 6 and 10, or 0 as value if otherwise. The autocracy variable is also a dummy that has a value of 1, if the country i in year t has a score between -10 and -6, or 0, if otherwise. Thus, the default will occur with countries classified as anocracies. A positive (and significant) coefficient associated with the democracy dummy would signal that the WB privileges countries with a “favourable” institutional framework. A positive (and significant) coefficient associated with autocracy dummy would indicate that WB privile-ges countries with a “non-favourable” institutional framework. Moreover,
the duration variable (years during which the current regime is sustained)
is also obtained from Polity IV database: we consider its interactions with other political regime dummies to control for the current regime consoli-dation and changes prospects as motivations for disbursement decisions. In the estimations, investment participation and government expenditure
par-ticipation are also taken into account, represented in equations (1) and (2)
by vector Xit, associated to coefficients β6 and α6. The first variable is the
by this country’s ability to invest with its own resources, so the variable is a proxy for this capability. It is plausible to expect that the WB should dis-burse larger amounts for countries with lower capability of auto-investing. The second variable is a proportion of GDP that corresponds to go-vernment expenditure. As outlined previously, international organizations have been involved with the idea that directing resources is not enough
for development: inefficiencies in resources allocations by governments should also be reformed and reduced (Abrucio; Loureiro, 2004). The varia-ble controls for the participation of government in the economy and, the larger it is, the more chances it has for influencing its efficiency.
It must be highlighted that the ideal would be for other controls to be in-corporated in the estimations. However, there are no historical series for all countries in the years taken into account that may allow such conclusions. Facing this obstacle, the fixed effects consideration (ui ) in the estimations induces the control of variables not observed as constant in time (or which vary little), but which are different among countries, thus guaranteeing lar-ger robustness to the results. In order to test results robustness, taking into account the potential collinearity among explanatory variables, estimations will be made on models based on equations (1) and (2) with alternative specifications, with sub-groups of the explanatory variables considered.
Non-observed and, thus, non-controlled factors in the estimations may in-fluence decisions on resources distribution by the WB. For example, there is possibly a more intense preference, by the Bank, to transfer resources to certain countries, maybe because of historical processes or other reasons. If these preferences do not alter in time, fixed effects control for them. So, an interesting aspect has been observed during data collection: in the analyzed timespan, annual average disbursement per country was US$ 356.28 million, but four of these countries had a highlight: Colombia (with twice the avera-ge); Argentina (with approximately 4.5 times the averaavera-ge); Brazil (more than 6 times the average); and Mexico (approximately 10.5 times the average).
Therefore, we have decided to run additional tests for equations (1) to (4), not considering these 4 countries, which, in general, are the ones with larger GDPs and per capita income indexes. The objective, then, is to verify if the obtained patterns for the full sample are influenced by these countries. Consequently, there is an evaluation on other motivations for these in relation to others. It is possible that adherence is or is not obser-ved when one takes the complete sample into consideration, while the contrary may happen when we exclude the four main recipients. If that happens, one may infer that the WB prioritizes these four countries while for the others it bases its decisions on other criteria.
Finally, it is important to assess if WB motivations have changes th-roughout the selected timespan, due to institutional guideline changes – as mentioned, there are studies that suggest a change towards focal policies in the 1990s (Ugá, 2004; Rached, 2010). Therefore, we have chosen equa-tions (5) and (6) below for these estimaequa-tions. The analyzed timespan is divided in 5 (1985 to 1989, 1990 to 1994, 1995 to 1999, 2000 to 2004 and 2005 to 2010) and, for each of them we use a time dummy (DTt ). These will be iterated to GDPpercapita and Poverty (DTt * GDPpercapitait and DTt
* Povertyit , respectively) variables. The default (comparison basis) will be
the first period (1985 to 1989), so that results of iterations should be in-terpreted as variations of influence on disbursements made by the WB
(3)
(4)
0 1 1 2 1 3 1
_ it it it it
d WB GDP per capita Poverty Gini
4 1 5 1 6 1
. Populationit Iit Xit ui it
0 1 1 2 1 3 1
_d WBit GDP it Poverty it Gini it
4 1 5 1 6 1
in comparison to the first period. These estimations are made for the full sample and for the reduced sample (without Colombia, Mexico, Brazil and Argentina).
4
Results
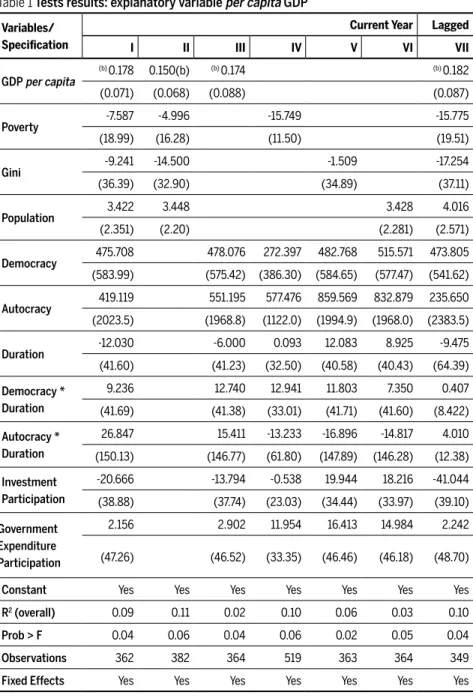
Table 1 shows results obtained for the specifications that utilize interest variable per capita GDP instead of GDP and the others. One may infer that coefficients associated with per capita GDP in the current year are positive and significant at 10% in all specifications in which it is considered. In specification V, which considers the variable in the previous year (‘lagged’) in order to deal with endogeneity and with the possibility of the WB deci-ding retroactively, the coefficient associated to the variable is also positive and significant at 10%.
Hence, relatively robust evidences refute the hypothesis that adherence in WB’s resources distribution to LAC countries’ social condition, which allows us to conclude that the adopted criterion of disbursements distribu-tion is incompatible with what is expected from a development bank that preaches the fight against poverty, with average disbursements being larger in countries with higher income levels. This means that resources are not pre-ferentially directed to countries that are in graver need. Project economic feasibility can be the main motivation, rather than social aspects. This idea is reinforced by the lack of significance for coefficients associated with the remaining explanatory variables, which indicate the inexistence of moti-vations both regarding institutions and referring to GDP composition in the disbursements distribution. The non-significance of the Poverty and the Gini coefficients are other strong evidences that distribution does not have social traces for LAC countries. Moreover, the non-significance of the
Po-verty coefficients also refutes the hypothesis that the WB prioritizes
coun-tries with larger proportions of poor population by using focal policies. (5)
(6)
0 1 2 3
_d WBit GDPpercapita it Poverty it Gini it
4 5 6 7
. Populationit Iit Xit DT GDPpercapita ut* it i it
0 1 2 3
_d WBit GDPpercapita it Poverty it Gini it
4 5 6 7
Table 1 Tests results: explanatory variable per capita GDP
Variables/ Specification
Current Year Lagged
I II III IV V VI VII
GDP per capita
(b) 0.178 0.150(b) (b) 0.174 (b) 0.182
(0.071) (0.068) (0.088) (0.087)
Poverty -7.587 -4.996 -15.749 -15.775
(18.99) (16.28) (11.50) (19.51)
Gini -9.241 -14.500 -1.509 -17.254
(36.39) (32.90) (34.89) (37.11)
Population 3.422 3.448 3.428 4.016
(2.351) (2.20) (2.281) (2.571)
Democracy 475.708 478.076 272.397 482.768 515.571 473.805
(583.99) (575.42) (386.30) (584.65) (577.47) (541.62)
Autocracy 419.119 551.195 577.476 859.569 832.879 235.650
(2023.5) (1968.8) (1122.0) (1994.9) (1968.0) (2383.5)
Duration -12.030 -6.000 0.093 12.083 8.925 -9.475
(41.60) (41.23) (32.50) (40.58) (40.43) (64.39)
Democracy * Duration
9.236 12.740 12.941 11.803 7.350 0.407
(41.69) (41.38) (33.01) (41.71) (41.60) (8.422)
Autocracy * Duration
26.847 15.411 -13.233 -16.896 -14.817 4.010
(150.13) (146.77) (61.80) (147.89) (146.28) (12.38)
Investment Participation
-20.666 -13.794 -0.538 19.944 18.216 -41.044
(38.88) (37.74) (23.03) (34.44) (33.97) (39.10)
Government Expenditure Participation
2.156 2.902 11.954 16.413 14.984 2.242
(47.26) (46.52) (33.35) (46.46) (46.18) (48.70)
Constant Yes Yes Yes Yes Yes Yes Yes
R2 (overall) 0.09 0.11 0.02 0.10 0.06 0.03 0.10
Prob > F 0.04 0.06 0.04 0.06 0.02 0.05 0.04
Observations 362 382 364 519 363 364 349
Fixed Effects Yes Yes Yes Yes Yes Yes Yes
Note: robust standard errors are in parentheses.
Table 2, in its turn, shows results of estimations that employed GDP as
alternative interest variable – rather than GDP per capita. It is noteworthy, yet again, that both variables have not been used in the same estimations
Table 2 Tests results: explanatory variable GDP
Variables/ Specifications
Current Year Lagged
VIII IX X XI
GDP
(a) 0.005 (a) 0.005 (a) 0.003 (a) 0.004
(0.001) (0.002) (0.001) (0.001)
Poverty -1.726 -1.655 -11.404
(17.31) (15.00) (19.00)
Gini -5.300 -7.968 -11.186
(34.64) (31.00) (35.30)
Population -7.160(b) -6.888(b) -3.823
(3.401) (3.182) (3.582)
Democracy -69.157 193.906 133.082
(590.02) (571.05) (553.63)
Autocracy -103.839 211.515 6.639
(1991.5) (1938.9) (2364.4)
Duration -18.086 -10.373 -9.493
(40.40) (40.05) (61.61)
Democracy * Duration 19.803 10.756 1.147
(41.02) (40.73) (8.31)
Autocracy * Duration 19.286 8.826 0.126
(147.35) (143.73) (11.99)
Investment Participation
-17.941 -5.666 -33.904
(36.45) (33.97) (37.22)
Government Expenditure Participation
-9.162 -1.248 -2.458
(46.12) (45.54) (47.90)
Constant Yes Yes Yes Yes
R2 (overall) 0.11 0.11 0.17 0.17
Prob > F 0.02 0.00 0.02 0.02
Observations 362 382 364 349
Fixed Effects Yes Yes Yes Yes
Note: robust standard errors are in parentheses.
because they are collinear, especially when coupled with Population. Fur-thermore, it is possible to test the adherence in relation to two aspects.
GDP per capita would show a preference, by the WB, for countries with
higher or lower poverty levels (or average income), which has been obser-ved in the tests, as it is clear in comments on results from Table 1. Total GDP, in its turn, would capture a preference, by the WB, for larger econo-mies, which has also been observed in the tests whose results are shown in Table 2. Coefficients of GDP variable are positive and significant at the 1% level in all specifications, including in XI, which considers the variable measured in the previous year (‘lagged’) to deal with probable endoge-neity and retroactivity of WB decisions.
Results found for other variables in estimations in Table 2 also guaran-tee more evidences favourable to this argument. Coefficients associated with the Population variable are negative and significant at the 10% level, except for specification XI, in which it is considered lagged (keeping the negative sign)8. The negative coefficient associated with this variable may
signal the absence of WB’s preoccupation with potential socio-economic impacts of its disbursements, which tend to be more elevated in more po-pulous countries. However, it may also indicate the absence of an ‘econo-mic’ preoccupation of supporting projects that are economically feasible, considering that more populous countries tend to have, in a large part of its economic sectors, higher revenue generation capability and lower costs (economies of scale). The inexistence of social motivation in disbursement distribution for LAC countries can be reinforced by the non-significan-ce of the coefficient associated with the Poverty and Gini variables in all specifications. Moreover, institutional variables and those related to GDP formation are also not significant, which suggests the absence of other motivations in financing disbursement distribution by the WB.
Table 3 shows results that do not take the Argentina, Brazil, Colombia and Mexico sample into account, once they are the larger recipients. In Poverty and Gini, estimated coefficients follow previous resulting patterns, signalling that social aspects may or may not be taken into account in WB decisions. On the other hand, per capita GDP and GDP have negatively influenced the amount transferred in the full sample, contrary to what has been observed in the reduced sample. Therefore, excluding the 4 largest
Table 3 Tests results: sample without Argentina, Brazil, Colombia and Mexico
Variables/ Specifications
Current Year Lagged
XII XIII XIV XV
GDP per capita
(c) -0.025 (c) -0.031
(0.013) (0.020)
GDP -0.002(c)
(b) -0.002
(0.001) (0.001)
Poverty 2.454 1.903 0.182 0.204
(3.216) (3.089) (3.570) (3.464)
Gini -4.756 -5.753 -9.600 -10.550
(5.915) (5.868) (5.988) (10.90)
Population -2.565 7.275 8.136 19.214
(10.60) (12.27) (11.05) (12.81)
Democracy -22.671 -19.341 -77.102 -90.561
(105.45) (103.95) (97.25) (97.21)
Autocracy 25.118 45.754 -204.102 -233.951
(302.32) (300.28) (346.23) (345.36)
Duration -7.793 -7.490 -18.638 -17.260
(6.427) (6.398) (19.08) (11.07)
Democracy * Duration 1.905 -0.348 1.483 1.093
(6.488) (6.586) (1.463) (1.476)
Autocracy * Duration 0.299 -0.011 0.458 0.373
(22.02) (21.93) (1.947) (1.923)
Investment Participation
3.714 4.455 0.547 1.353
(6.217) (6.197) (6.179) (6.158)
Government Expenditure Participation
-4.748 -4.740 -5.914 -6.283
(7.280) (7.250) (7.379) (7.336)
Constant Yes Yes Yes Yes
R2 (overall) 0.03 0.08 0.12 0.14
Prob > F 0.06 0.04 0.02 0.02
Observations 258 258 249 249
Fixed Effects Yes Yes Yes Yes
Note: robust standard errors are in parentheses.
recipients, the adherence hypothesis in relation to average or total income
is verified as true. The results suggest a preference for the 4 big recipients, even though they present, in general, higher income levels, which influen-ces the result for the full sample. However, for other LAC countries, the higher the total and per capita income, the larger the amount of WB re-sources disbursed.
Table 4 Tests results: interactions with period dummies
Variables/ Specifications
Full sample Reduced Sample*
XVI XVII XVIII XIX
Dummy 1990-1994 * GDP per capita
0.205 (a) 0.160
(0.249) (0.043)
Dummy 1995-1999 * GDP per capita
0.078 -0.001
(0.290) (0.052)
Dummy 2000-2004 * GDP per capita
-0.044 -0.003
(0.310) (0.058)
Dummy 2005-2010 * GDP per capita
0.164 -0.003
(0.357) (0.067)
Dummy 1990-1994 * Poverty
2.752 (a) 5.931
(9.073) (1.476)
Dummy 1995-1999 * Poverty
-3.753 (b) 3.863
(10.98) (1.827)
Dummy 2000-2004 * Poverty
-12.012 (b) 4.118
(11.05) (1.840)
Dummy 2005-2010 * Poverty
-15.362 (a) 7.328
(15.75) (2.499)
Others Variables Yes Yes Yes Yes
Constant Yes Yes Yes Yes
R2 (overall) 0.10 0.09 0.20 0.10
Prob > F 0.01 0.04 0.00 0.03
Observations 362 362 258 258
Fixed Effects Yes Yes Yes Yes
Note: robust standard errors are in parentheses.
(a) Statistically different from zero at the .01 level. (b) Statistically different from zero at the .05 level. (c) Statistically different from zero at the .1 level.
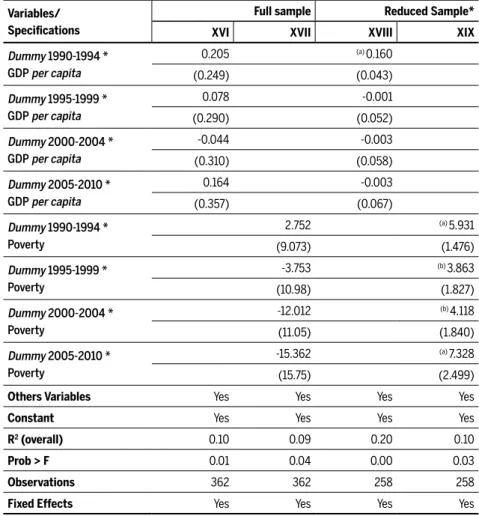
Finally, Table 4 presents results for estimations with period variables itera-ted to GDPpercapita and Poverty (DTt * GDPpercapitait and DTt * Povertyit , res-pectively), having the 1985-1989 timespan as default (comparison basis). We only report results for these iterated variables. For the full sample, no change is observed in relation to per capita income and poverty numbers on WB disbursements. However, for the reduced sample (not taking Brazil,
Colom-bia, Mexico and Argentina into account), per capita income has a significan-tly distinct influence in relation to the base period, in the 1990-1995 period (in the sense of higher non-adherence); for all others, there is no significant difference, but results are negative, which may signal that the bank has moved towards higher adherence in relation to other countries throughout time, which has been previously stated for the period average. The poverty index, in its turn, although not having been significant throughout the ave-rage period, has had its influence on WB decisions increased throughout time in comparison to the 1985-1989 period, which may suggest that the bank has started to consider this aspect more thoroughly (although not de-cisively) while transferring resources to LAC countries, except for the 4 big recipients. Therefore, we may suggest, in line with some studies, that WB has started to consider focal poverty combating policies for these countries.
5
Disbursements distribution by major sectors
Having defined the study’s second goal as the understanding on areas in which the World Bank has concentrated its disbursements in Latin Ame-rica and the Caribbean, the way the Bank classifies its loans and grants must be explained. Each of the WB’s projects is classified according to a series of parameters, in a constantly updated table, available on its official website9. Amongst the categorized items, the ones to be used as a basis in
the present analysis are: Country; Approval Date; Project Total Cost (dis-bursement); Major-Sectors; Percentage of total amount directed to each Major Sector within the project.
Each of the WB’s DA disbursements is classified in two macro dimen-sions10: Major Themes and Major Sectors. This classification started in
9 http://web.worldbank.org/external/default/main?menuPK=258583&pagePK=146740&pi
PK=512758&theSitePK=258554
200111 and, before this date, all projects used to be sorted by ‘Sectors’ only.
Hence, the projects have been retroactively re-assorted. This poses a me-thodological challenge, discussed by the WB itself on its webpage about
projects classification: “when the [classification] list is revised, reclassifica-tion is never completely retrospective”12. This means that the
reclassifica-tion of projects may be mistaken or incomplete. We do believe, however, that the data loss is residual: only 5.06% of the analyzed period in the table available at the Bank’s webpage are still classified in Sectors, which means our analytical material is 94.94% up-to-date with the new classification.
While Major Themes are wide vectors of classification that include, for instance, categories such as “Human Development” or “Rule of Law” – in line with UN’s Millennium Goals –, Major Sectors are more specific, clearly verifiable in the economic reality of a country. According to WB’s classification, there are ten Major Sectors, identified by conventionalized acronyms as follows: Agriculture, fishing and forestry (AX); Public Admi-nistration, law and justice (BX); Information and Communications (CX); Education (EX); Finance (FX); Health and other social services (JX); Energy and Mining (LX); Transportation (TX); Water, sanitation and flood protec-tion (WX); Industry and Trade (YX).
In order to have a clear understanding of what a Major sector is, let us briefly analyze the Sectors each Major Sector encompasses. This should shed light on the coming analysis. According to WB (2001), sectors are high-level sets of economic activities, whose definition is based on the types of goods or services produced; they have the UN classification of economic sectors as point of reference; they are mutually exclusive; they are commonly used to indicate which part of the economy is supported by the Bank intervention.
While the AX Major Sector encompasses sectors such as (i) agricultu-ral extension and research, (ii) animal production, (iii) crops, (iv) forestry, (v) irrigation and drainage; the BX Major Sector encompasses (i) central go-vernment administration, (ii) compulsory pension and unemployment in-surance, (iii) law and justice, (iv) sub-national government administration. The CX Major Sector encompasses (i) information technology, (ii) media, (iii) postal services, (iv) telecommunications. The EX Major Sector
encom-11 http://web.worldbank.org/WBSITE/EXTERNAL/PROJECTS/0,,contentMDK:20061207~ pagePK:41367~piPK:51533~theSitePK:40941,00.html
passes (i) adult literacy/non-formal education, (ii) pre-primary education, (iii) primary education, (iv) secondary education, (v) tertiary education, (vi) vocational training. The FX Major Sector encompasses (i) banking, (ii) capital markets, (iii) housing finance and real estate markets, (iv) non--compulsory pensions, insurance and contractual savings, (v) micro and SME-finance, (vi) payment systems, securities clearance and settlement and (vii) general finance sector. The JX Major Sector encompasses (i) health and (ii) other social services. The YX Major Sector encompasses (i) agri-cultural marketing and trade, (ii) agro-industry, (iii) housing construction, (iv) other domestic and international trade, (v) other industry and (vi) pe-trochemicals and fertilizers. The LX Major Sector encompasses (i) district heating and energy efficiency services, (ii) mining and other extractive, (iii) oil and gas, (iv) power and (v) renewable energy. The TX Major Sector encompasses (i) aviation, (ii) ports, waterways and shipping (iii) railways and (iv) roads and highways. The WX Major Sector encompasses (i) flood protection, (ii) sanitation, (iii) sewerage, (iv) solid waste management and (v) water supply.
In the WB’s projects table, each project can be classified in up to 5 Major Sectors, connected, in their turn, to 1 Sector each (this means one project’s disbursement amount may be divided into 1, 2, 3, 4 or 5 Major Sectors and, thus, 1, 2, 3, 4 or 5 Sectors). The same rationale is used in the classification with Major Themes. However, bearing in mind the more practical, secto-ral character of Major Sectors, we have decided to abstain from analysing Major Themes. Besides, the Major Sectors are more commonly used by the current literature on the World Bank (see Pereira, 2010) than the Ma-jor Themes. Once we would be dealing with a total amount of 11 MaMa-jor Themes, 66 Themes, 10 Major Sectors and 57 Sectors (if all classifying vectors were to be taken into consideration), we have decided to reduce this analytical spectrum to only 10 variables (besides countries, of course): only the ten aforementioned Major Sectors. Therefore, values relative to each Sector will be considered as the value disbursed for the Major Sector, our main analytical basis.
simple without losing its substance, whereas complex, without being in-comprehensive. Having this said, the data hereby used encompasses 1,791
WB projects, classified in 1, 2, 3, 4 or 5 Major Sectors each, throughout 26 years, in 31 countries.
The reclassification made by the WB in 2001 is also the fundamental reason for the period choice in the present study: regressively, it seems to substantially and safely span projects only until the mid-1980s. Before that time, most of the projects are still classified in Sectors only. This is why we have decided to look upon the period between the years of 1985 and 2010. To make the analysis clear and more comprehensive, we have decided to split this period in 5 sub periods: 1985-1989, 1990-1994, 1995-1999, 2000-2004 and 2005-2010. Following Pereira’s (2010) work on the subject, this cleavage choice is arbitrary and does not seem to follow any changes neither in the economic reality of the region nor in the WB’s own ins-titutional framework. However, it offers a clear glimpse, as follows, on the steep changes in projects’ distribution without clear reasons: the quin-quennial hinge offers, at least, some reference to locate happenings and changes in the political and economic international scenario. Moreover, in order to make data visualization clearer, we have adapted a classifica-tion adopted by some public finance works, namely the funcclassifica-tion expenses (Oxley; Martin, 1991; Saunders, 1993): social policies (merit goods); infras-tructure (economic services); economic sectors and public administration and state (pure goods).
By analysing Table 5first quinquennium (1985-1990), one may infer that projects in the region in the period were concentrated in the ‘Agriculture, Fishing and Forestry’ Major Sector, whose amount was 12% superior to the second and third on the list, as the table shows. It is interesting to notice how little importance was given in the period for ‘Public Administration, Law and Justice’, which will change radically in the subsequent periods.
Interestingly, the total amount disbursed in this period had a positive variation of 92% (Table 5).
As Tables 5 and 6 show, once again, in the third quinquennium (1995-1999), there is a prevalence of ‘Public Administration, Law and Justice’ as a priority in WB’s disbursements in the period between 1995 and 1999, still with a large share of total (29%) and a positive variation in amount of money disbursed of 9%. In second place, ‘Finance’ had a positive variation of 95%. ‘Health and other Social Services’ Major Sector has a remarkable positive variation of 193%.
Table 5 Total WB disbursements variation (%) in relation to the previous quinquen-nium, in LAC, by Major Sector, between 1985 and 2010
Major Sector
1985-1989 to 1990-1994
1990-1994 to 1995-1999
1995-1999 to 2000-2004
2000-2004 to 2005-2010
1985-1989 to 2005-2010
Social Policies
(merit goods) 163.6 16.2 -5.8 249.0 618.7
Education 302.7 -24.1 2.6 159.5 400.1
Water and Sanitation 108.2 -41.5 -45.8 634.6 318.3
Health and Other
Social Services 115.2 193.2 3.5 225.7 1.373.7
Infrastructure
(economic services) 80.9 -25.5 -47.2 416.7 196.4
Energy and Mining 107.3 -64.8 -33.4 469.4 128.1
Transportation 62.4 0.7 -54.0 432.8 225.7
Information and
Communication 391.0 -78.8 248.7 103.6 276.1
Economic Sectors -15.1 4.1 -33.1 197.2 16.6
Agriculture. Fishing
and Forestry -41.4 -55.0 -33.9 373.5 -34.9
Industry and Trade 80.1 -41.3 -9.9 291.3 177.1
Finance -2.8 95.5 -37.4 126.0 49.8
Public Administration
and State (pure goods) 2,471.2 8.9 -3.0 136.8 3,612.6
Public Administration,
Law and Justice 2,471.2 8.9 -3.0 136,8 3,612.6
Total 91.4 1.0 -19.3 219.4 242.3
It is also interesting to notice how ‘Education’, ‘Water and Sanitation’ ‘Agriculture, Fishing and Forestry’, ‘Industry and trade’, ‘Energy and Mi-ning’ and ‘Information and Communication’ have had expressive negative variations, -24%, -44%, -55%, -41%, -65%, -79% in relation to the pre-vious quinquennium. The total amount disbursed for the region, however, had little variation (+0.6%).
‘Public Administration, Law and Justice’ still seems to be a key Major Sector for the WB in the period comprised between 2000 and 2004, des-pite a loss of 3% in the amount disbursed in comparison to the period 1995-1999. The Major Sector keeps a share of 35% of total disbursements in the period, growing in numbers, we may infer, because of the loss of other Major Sectors.
The same happens to the ‘Health and other Social Services’ Major Sec-tor, which, despite the negative variation of 54%, reached second posi-tion, surpassing ‘Finance’, with a share of 20% of total disbursements. Despite having had a soaring positive variation of 249%, ‘Information and Communication’ still maintain the last place in the list, with a 1% share of total, showing, alongside with ‘Industry and Trade’ and ‘Finance’ positive variations in relation to the previous quinquennium. All others have had negative variations that reach from -3% to -54%, as well as the total dis-bursed amount for the region (-20%).
Finally, the 2005-2010 quinquennium shows the prevalence of ‘Public Administration, Law and Justice’ as a priority of disbursements of WB in LAC. Despite the positive variation in the amount defined for this Major Sector (+37%), in comparison to the previous period, its share of total has decreased from 35% to 22%.
The positive variation of all other Major Sectors is remarkable, +4% (Information and Communications), +26% (Finance), +59% (Education), +126% (Health and Other Social Services), +191% (Industry and Trade), +274% (Agriculture, Fishing and Forestry), +333% (Transport), +369% (Energy and Mining), +535% (Water and Sanitation). This encompasses, it seems, a full boost in WB projects in this period, with a total positive variation of +119% in the region.
Carv
alho & Silv
a
Major Sector
Amount % of
Total Amount % of
Total Amount % of
Total Amount % of
Total Amount % of
Total Amount % of Total
Social Policy (merit goods) 2,438.09 17.8 6,427.51 24.5 7,471.83 28.0 7,038.40 32.8 17,522.76 37.2 40,898.59 30.3
Education 671.65 4.9 2,704.76 10.3 2,052.70 7.7 2,106.36 9.8 3,358.74 7.1 10,894.21 8.1
Water and Sanitation 1,124.49 8.2 2,341.27 8.9 1,368.48 5.1 741.14 3.5 4,703.45 10.0 10,278.83 7.6
Health and Other Social Services 641.95 4.7 1,381.48 5.3 4,050.65 15.2 4,190.90 19.5 9,460.57 20.1 19,725.55 14.6
Infrastructure
(economic services) 3,601.17 26.3 6,514.36 24.8 4,854.88 18.2 2,561.28 12.0 10,672.08 22.7 28,203.77 20.8
Energy and Mining 1,109.15 8.1 2,299.45 8.7 809.40 3.0 539.02 2.5 2,530.30 5.4 7,287.32 5.4
Transportation 2,440.87 17.8 3,963.76 15.1 3,992.23 15.0 1,836.60 8.6 7,949.40 16.9 20,182.86 14.9
Information and Communication 51.15 0.4 251.15 1.0 53.25 0.2 185.66 0.9 192.38 0.4 733.59 0.5
Economic Sectors 7,429.60 54.0 6,308.07 24.0 6,567.76 24.6 4,393.13 20.5 8,662.81 18.5 33,361.37 24.7
Agriculture, Fishing and Forestry 4,178.22 30.4 2,449.91 9.3 1,101.37 4.1 727.96 3.4 2,719.17 5.8 11,176.63 8.3
Industry and Trade 842.45 6.1 1,516.88 5.8 889.67 3.3 801.30 3.7 2,334.20 5.0 6,384.50 4.7
Finance 2,408.93 17.5 2,341.28 8.9 4,576.72 17.2 2,863.87 13.4 3,609.44 7.7 15,800.24 11.7
Public Administration and State
(pure goods) 274.44 2.0 7,056.36 26.8 7,684.47 28.9 7,450.45 34.7 10,188.81 21.7 32,654.53 24.2
Public Administration,
Law and Justice 274.44 2.0 7,056.36 26.8 7,684.47 28.9 7,450.45 34.7 10,188.81 21.7 32,654.53 24.2
Total 13,743.30 100.0 26,306.30 100.0 26,578.94 100.0 21,443.26 100.0 47,046.46 100.0 135,118.26 100.0
Source: Calculations made by the authors, based on WB’s Projects Database for LAC.
v
a E
c
onomia�
v.26
n.2
20
total amount (almost 33 billion dollars), total share (almost a quarter of all disbursements) and of total variation (the accumulated growth of in-vestment in this Major Sector sums up to 25 times, while the second in growth – ‘Information and Communication’ – considering its almost irre-levant participation in total share, grew no more than 5.6 times). This is the clearest trend perceived from data analysis on disbursements sectorial distribution. Finally, in relation to the ´Public Administration, Law and Jus-tice´ Major Sector may point out to an aspect discussed in section 3: the fact that international organizations, such as the WB, should not focus its disbursements only on pure investment, but also on institutional reforms
that can lower governments inefficiency (Schneider; Doner, 2000; Abrucio; Loureiro, 2004).
6
Final remarks
The analysis on WB disbursements distribution among Latin America and the Caribbean countries and among economic sectors (Major Sectors) between 1985 and 2010 has attested that (i) there is no adherence between financing distribution and socio-economic conditions of recipient coun-tries and that (ii) sectoral distribution suggests that there is adherence – under what the WB understands as fighting poverty: supporting financing initiatives in Public Administration, Justice and Law, which have concen-trated an average of 25% of resources between 1985-2010, an almost iden-tical percentage to that disbursed to pure social policies (merit goods).
This paper proposes the concept of adherence, which aimed at ser-ving as an analytical landmark: adherence is, precisely, the approximation between countries’ real needs and the Bank’s real actions; its identification would mean that, in LAC, in the period analyzed, WB has truly played its role in alleviating poverty by looking for those in graver need. Adherence might have been confirmed if higher disbursements amounts had been offered to countries with relative lower economic and social standards.
op-posite, countries with higher income levels have been awarded relatively larger amounts of disbursement. Moreover, neither political regimes nor GDP composition seem to play a role as a distribution criterion.
The analysis made with both reduced and full sample offers an interes-ting trend, with resources distribution concentrated in the largest coun-tries (Brazil, Mexico, Argentina and Colombia). The sample that excludes these four countries has shown higher non-adherence in terms of per ca-pita income in the pivotal period of 1990-1995, whilst in other periods no
adherence has been identified. That is to say that low income and poverty have not played a decisive role – though slightly more significant as time passed – in the resources distribution in the analysed period. The full sam-ple has been biased by the size of the four largest countries: higher income has pulled higher disbursements.
One may wonder that project economic feasibility may be the main criterion, rather than social aspects. This idea is reinforced by the lack of significance for coefficients associated with the remaining explanatory variables, which indicate the inexistence of motivations regarding institu-tions and referring to GDP composition in the disbursements distribution. The non-significance of the Gini coefficient is another strong evidence that distribution does not have social traces.
Anyway, expressive oscillations such as those observed from quin-quennium to quinquin-quennium, as shown in Tables 5 and 6, remain wi-thout explanation.
References
ABRUCIO, F. L.; LOUREIRO, M. R. Finanças públicas, democracia e accountability. In:
BIDER-MAN, C.; ARVATE, P. Economia do setor público no Brasil. Campus, Rio de Janeiro, 2004.
ANGRIST, J. D.; PISCHKE, J. S. Mostly harmless econometrics: an empiricist’s companion.
Prince-ton: Princeton University Press, 2009.
BALTAGI, B. H. Econometric Analysis of Panel Data. Wiley and Sons Ltda., 2001.
BHALLA, S. Governance in development: WB and IMF in the crossroads. 2006
BOURGUINGNON, F.; SUNDBERG, M. Aid Effectiveness – Opening the Black Box. World Bank,
2005.
BUIRA, A. Reforming the governance of IMF and World Bank. Anthem Press, 2005.
FOCH, A. Governance of the World bank: analysis and implications of the decisional power of
the G10. Centre d’économie de la Sorbonne. 2007
FULLER, S. A question of motivations: determining why donor countries give aid. Res Publica –
Journal of Undergraduate Research, v.7, issue 1, Article 7, 2002.
GRIFFITH-JONES, S. Governance of the World Bank. London: DFID, 2002.
HANMER, L.; PYATT, G.; WHITE, H. What do the World Bank’s Poverty Assessments teach us
about poverty in Sub-Saharan Africa? Wiley, 2002.
HANSEN, H.; TARP, F. Aid Growth Regressions. Credit research paper. 2000.
HIBOU, B. The Political Economy of the World Bank’s Discourse. 2000.
ISMI, A. Impoverishing a continent: World Bank and IMF in Africa. July, 2004
KALUZA, K.; KALUZA, Mari. Governance and accountability of the World Bank. University of
Iowa, 2008.
KAPUR, D. The “Knowledge” Bank. In: BIRDSALL, Nancy. Rescuing the World Bank.
Wa-shington: Center for Global Development, 2006.
KEOHANE, R.; NYE, J. Power and interdependence. Boston, Little, Brown. 2000
LICHTENSZTEJN, S.; BAER, M. Fundo Monetario Internacional e Banco Mundial: estratégias e
políticas do poder financeiro. São Paulo: Brasiliense, 1987.
MARSHALL, M. G.; COLE, B. R. Global report 2011: conflict, governance, and state fragility. Centre for Systemic Peace, 2011
NATH, S.; SOBHEE, S. Aid motivation and donor behavior. University of Mauritius, 2005. OXLEY, H.; MARTIN, J. P. Controlling government spending and deficit: trends in the 1980s