WHERE TO INVEST IN BRICS? AN ANALYSIS FROM THE POINT OF
VIEW OF INDUSTRIAL ORGANIZATION
ONDE INVESTIR NOS BRICS? UMA ANÁLISE SOB O PRISMA DA ORGANIZAÇÃO INDUSTRIAL
¿DÓNDE INVERTIR EN LOS BRICs? UN ANÁLISIS BAJO EL PRISMA DE LA ORGANIZACIÓN INDUSTRIAL
The objective of this study is to identify the most inte-resting industries for investing in Brazil, Russia, India e China (BRICs), according to risk-return and value premises, based in the theory of Industrial Organi-zation (IO) tradition. This work analyzed 2770 firms in the BRICs from 1995 until 2008. With this purpose were compared rates of performance as ROA (return on assets), ROE (return on shares), average price ear-nings, market value over book value and Tobin’s Q of the companies. The results support studies from Fama
and French (1992), Mohanram (2005) and Goldszmi-dt, Brito and Vasconcelos (2007), although deviates from World Bank (2008) as to risk-return enhancing in China. Results show that the most attractive sec-tors for investment using the risk-return approach, filtering by value indicators, would be oil & gas in Russia and mining in Brazil,India and China, while the least interesting industries would be textile, motor vehicle parts, tools & accessories and telecommuni-cations in Brazil.
ABSTRACT
RESUMO O presente estudo tem como objetivo identiicar os setores mais atrativos para investimento do Brasil, Rússia, Índia e China (BRICs) conforme a relação risco-retorno e geração de valor, tendo como base de estudos a teoria de Organização Industrial (OI). Para isso, este trabalho analisou 2.770 empresas nos BRICs entre 1995 e 2008. Assim, foram investigados e comparados índices de desempenho como retorno sobre ativo (ROA), retorno sobre ações (ROE), índice preço-lucro, valor de mercado sobre valor contábil e Q de Tobin das empresas. Os resultados obtidos reforçam os de Fama e French (1992), Mohanram (2005) e Goldszmidt, Brito e Vasconcelos (2007), porém divergem do World Bank (2008) quanto à China. Constatou-se que os setores mais atrativos na perspectiva de risco-retorno sobre o patrimônio líquido seriam óleo & gás na Rússia e mineração no Brasil, Índia e China, enquanto aqueles com menor atratividade seriam os setores têxtil, motores, máquinas & ferramentas e telecomunicações no Brasil.
Palavras-chave Investimento, empreendedorismo, BRICs, análise setorial, risco e retorno.
Resumen El presente estudio tiene como objetivo identiicar los sectores más atractivos para inversión del Brasil, Rusia, India y China (BRICs) según la relación riesgo-retorno y generación de valor, teniendo como base de estudios la teoría de Organización Industrial (OI). Para eso, ese trabajo analizó 2.770 empresas en los BRICs entre 1995 y 2008. Así, fueron averiguados y comparados índices de desempeño como retorno sobre los activos (ROA), retorno sobre las acciones (ROE), índice precio-lucro, valor de mercado sobre valor contable y Q de Tobin de las empresas. Los resultados obtenidos refuerzan los de Fama y French (1992), Mohanram (2005) y Goldszmidt, Brito y Vasconcelos (2007), pero divergen del World Bank (2008) cuanto a China. Se constató que los sectores más atractivos en la perspectiva de riesgo-retorno sobre el patrimonio líquido serían aceite & gas en la Rusia y minería en el Brasil, India y China, mientras aquellos con menor atractivo serían los sectores textil, motores, máquinas & herramientas y telecomunicaciones en el Brasil.
Palabras clave Inversión, desarrollo empresarial, BRICs, análisis sectorial, riesgo y retorno. Cristian Diego Albuja [email protected]
M.B.A, School of Business Administration at Getulio Vargas Foundation, Sao Paulo, Brazil Fabio Gallo Garcia [email protected]
Professor at the School of Economids, Business Administration and Accounting, University of São Paulo; School of Economids, Administration and Accounting, Catholic Pontifical University of Sao Paulo; School of Business Administration, Getulio Vargas Foundation, Sao Paulo, Brazil;
Luiz Maurício Franco Moreiras [email protected]
Professor at the Center for Applied Social Sciences, Mackenzie Presbyterian University; School of Economics, Business Admin-istration and Accounting, University of São Paulo; School of Economics, AdminAdmin-istration and Accounting, Catholic Pontifical University of Sao Paulo, Brazil;
Elmo Tambosi Filho [email protected]
Professor at the School of Economics and Business Administration, Methodist University of Sao Paulo, Brazil
INTRODUCTION
With the financial crisis starting in 2007 in the United States real estate sector, many uncertainties appeared regarding the future of financial and direct invest-ments, as well as growth (or contraction), both in developed and emerging countries, thus raising ques-tions such as: Where to invest? What industries show the best prospects?
According to the World Bank (2008), in the next few years, i.e., until the financial crisis ends and a new round of global growth is established, emerging countries should grow above the world average, while developed countries should grow below it or even, at times, suffer contraction in their economies.
In this context, questions like the above become relevant, particularly to developing countries like Brazil, Russia, India and China, also known by the acronym BRIC. Knowing the most attractive segments to invest in the BRIC countries by analyzing their profitability, return volatility and conditions of reinvestment, can be useful for all investors.
Comparative performance between sectors of economy over time and how companies stand out in their industries are well-studied issues; we can mention a few seminal papers such as those by Schmalensee (1985) and Rumelt (1991), showing that these are cen-tral subjects in strategy studies.
With alternative views, other researchers have examined the effects of industries, companies, coun-tries, corporations and periods of performance, such as McGahan and Porter (1997), Brush, Bromiley and Hendrickx (1999), Bowman and Helfat (2001) and Goldszmidt, Brito and Vasconcelos (2007).
With regard to finance, many studies have been conducted and improvements made in asset pricing models, expected returns and portfolio optimization, such as those by Fama and French (2004), Shalit (2003), Avramov (2004), Campbell and Voulteenaho (2004 ) and Chan and Lakonishok (2004). However, little research has been conducted regarding industry issues. What are the most favorable sectors for investment, the best way to invest a significant part of one’s personal wealth, like entrepreneurs do, by concentrating investment rather than diversifying it in order to mitigate risks (CHAR and HENRY, 2004)?
In order to answer these questions, and based on the alignment of strategy and finance research, this study aims to determine the most attractive sectors for investment in the BRIC countries according to
risk-return and value generation. This study was based on theory of Industrial Organization (IO) proposed by McGahan and Porter (1997) in the article How much does industry matter, really?
THEORY OF INDUSTRIAL ORGANIZATION
The IO theory is based on the idea that business per-formance is determined by the behavior or conduct of strategic internal and external actors, which, in turn, is determined by the structure of the industry or sector in which companies operate. In this study, IO tradition is assumed in order to measure changes in the level of intersectoral attractiveness and the cost of competitive strategies in several sectors of the economy.
Theories deriving from IO include those elaborat-ed by Porter (1981), emphasizing a sector’s structural characteristics. Other writers emphasize perspectives based on the possession and efficient utilization of es-sential resources (Resource Based View – RBV), such as Barney (1986) and Dierickx and Cool (1989); the latter two are not the object of the present study, since our purpose is to map the most attractive industries for investment, not to study how organizations in all industries can perform above industry average. Conner (1991), in turn, conducted comparisons between the IO and RBV schools of thought.
Schmalensee (1985) suggests that industry charac-teristics have a strong influence on the mean profitabil-ity of sectors, although he recognizes that 80% of the profitability variation of the companies in his study are not related to industry or market share effects. In other words, sectoral differences would be significant, but they alone would not explain the variations of profit-ability of companies.
Rumelt (1991), in turn, found that structural char-acteristics of sectors accounted for 9% to 16% of the variability of returns, while the specific characteristics of companies, such as process differences, product dif-ferentiation, heterogeneity of assets and market share, accounted for 45% of this variability.
were more stable than the specific characteristics of businesses, even in the presence of shocks and busi-ness cycles - two factors often found in the context of emerging countries.
From a more pragmatic perspective, Goldszmidt, Brito and Vasconcelos (2007) warn about the fact that countries with more developed institutions and legis-lation and more effective market mechanisms provide less space for exploiting imperfections and achieving extraordinary profits. Therefore, due to market imper-fections, we can infer that in emerging countries, bar-riers to entry and industry characteristics are stronger than in developed markets, which potentially creates more opportunities for higher returns.
Porter (1996) argues that business strategy seeks to generate gains to the disadvantage of choices that focus on the activities of the organization but limit their op-eration range and market. According to this writer, the essence of strategy is choosing what the organization should not do, by focusing on its activities, manage-ment and market decision-making and creating stra-tegic barriers to other organizations. Strastra-tegic choices are not limited to this; operation costs can be reduced depending on how other activities are performed. A company’s activities and its strategic choices can in-crease its customer-perceived value, thus positioning it in the market.
In the same study, Porter (1996) suggests that strate-gies aiming at broad spectrums of market by emphasiz-ing low prices generally result in the loss of customers sensitive to service quality and differentiation, while strategies for the differentiation of products and services lose price-sensitive customers. Because it is impossible to serve all at the same time, there are barriers between these strategies: there is the cost of implementing and maintaining these strategies, and the cost of changing strategies, in the case of established companies.
This also occurs between sectors of activity. Each sector, as well as each company, will eventually gen-erate its own barriers; these can be either barriers to entry for new entrants or mobility barriers for existing ones (Porter, 1979b). In the case of sectors, barriers to entry can translate into initial investment cost, rein-vestment demand to maintain strategies and possible legal obstacles, for example, when a given sector of the economy is nationalized and requires approval or a special license from the government for operation. Because of this aspect, we chose to exclude from this study any nationalized or state-controlled sectors that might preclude entrepreneurship or investment.
Savvides (2000) identifies two other strategic barri-ers between sectors: the first is that new entrants arouse reactions from industry members; the second concerns trademarks, since these must have a positioning – it is impossible to use the same brand for foods, funeral services and education, even if they belong to same con-glomerate, as this would create an image that would not suit the products and services it is meant to represent. Porter (1979b) found industries in the United States where company size is not relevant to determine its profitability, or even where small companies have a higher profitability than large ones. Therefore, regard-ing sector attractiveness, initial investment was not taken into account, since it depends on the strategy to be designed for the organization, the profile and re-sources available for each investor and entrepreneur; it is for them or the portfolio managers to choose the best viable and available option.
In the IO Theory, the performance of companies is determined by the behavior of existing competitors, which influence the competitive actions of both cur-rent participants and potential entrants into the sector. Porter (1979b) specified the concept of mobility barriers between the groups of an industry as a way for them to mitigate competitors’ imitation and thus establish privileged positioning and higher returns.
Among sectors, mobility barriers are practical, as well as financial and strategic. Practical, since a com-pany who decided to leave the shoe industry to oper-ate in the dairy beverage industry could face such high demands for time, energy and capital that it might find it more interesting to close its shoe operation and open an entirely new one in the dairy beverage industry.
The mobility barriers are also financial. According to Porter (1979a), economies of scale can mean the difference between being able to compete nationally or being pushed into operating locally. The demand for capital - restructuring, research and development, advertising and marketing - can also be a barrier to mobility, both locally and between sectors.
and failure to achieve the desired effect in the new in-dustry. Government can also create barriers by limiting or controlling economic sectors through laws, licenses and nationalization, thereby affecting the operations and investments of businesses.
Still, changing industrial sectors, both for compa-nies and investors, can be the right way forward. Some companies have switched industries completely, like Nokia, which started operating in the paper industry, then moved over to the sectors of rubber and cables and is now the world’s largest cell phone maker (Nokia 2009). From the perspective of investors, the economic conditions of companies, sectors and countries are dy-namic, varying over time; this requires investors to peri-odically review their strategies and positions according to these variations, as well as personal requirements, according to Maenhout (2004).
According to Ghemawat (1999), the performance of companies can be explained by the level of attrac-tiveness of their sector and competitive positioning strategies. The former concerns sectoral effects, while the later refers to the way of competition the company chooses in order to generate competitive advantage and higher returns. Positioning strategies aim to defend the company against competitive forces in its own in-dustry, providing barriers to entry and higher returns. Therefore, industries with high mean profitability can develop barriers to entry against companies from an-other industry. In sectors with high profitability variation between companies, this would show that a successful positioning strategy can lead to competitive advantage and higher returns.
It is not the purpose of this study to identify the best companies in a possible universe, but to examine the segments in which they operate. Therefore, the sec-toral influences found by Schlamensee (1985), Rumelt (1991), McGahan and Porter (1997) and Goldszmidt, Brito e Vasconcelos (2007) are in line with the findings of this study.
METHODS
The methods of this study are based on empirical-an-alytic assessment, using various statistical tests to map the most attractive sectors for investments in BRICs.
To this end, a quantitative empirical study was con-ducted with existing database containing the accounting information provided by companies as legally required;
this study assumes the IO tradition hypothesis according to McGahan and Porter (1997). It also admits investors to be rational and to seek the best risk-return ratio, ac-cording to Fama and French (2004) and Perold (2004).
As Anderson, Sweeney and Williams (2008) sug-gested, exploratory data analysis and descriptive statis-tics are essential for accurate judgment, since they allow to focus on the relevant features of data or select the best model to solve a given problem. As in the study by Mohanram (2005), mean and variance of the variables were analyzed during the studied period; then the re-lation between them were studied, in order to better understand their relations in each country.
The sectoral mapping according to IO, as proposed in this study, involves exploratory analysis without the purpose to find causality or relation between specific features of each company and its industry or country. Therefore, the mapping can be conducted per coun-try, as in Fama and French (1998), with no hierarchy of effects required, as described by Goldszmidt, Brito and Vasconcelos (2007). Hence our choice not to use multilevel analysis.
Results between sectors and between countries were compared using analysis of variance (Anova) and Student’s t-test (ANDERSON, SWENNEY, WILLIAMS, 2008), as used in Bandeira-de-Mello and Marcon (2004), Chung and Pruitt (1994), among others, and suggested by Anderson, Sweeney and Williams (2008).
Anova allows testing the initial hypotheses that re-sults per index and country would all be equal, against the alternative hypothesis that not all means, per index and country, would be equal. Therefore, once the initial hypothesis is refuted for the sectors of a country, it is possible to confirm the IO Theory for each of the BRIC countries. Similarly, it is possible to see the sectors with different performances per index among BRICs using Anova. In addition, Anova allows determining whether the mean per country for a given index is equal for all BRICs or if one mean may be different from the oth-ers, which would indicate whether a given industry has similar or distinct performance levels among the studied countries.
In cases where the initial hypothesis is rejected among BRICs, the Student’s t-test can help to determine which countries have the highest mean per index, thus ranking them if their means are statistically different.
and Strategy, such as McNamara, Vaaler, and Devers (2003) and Goldszmidt, Brito and Vasconcelos (2007), among others.
As with Goldszmidt, Brito and Vasconcelos (2007), ten 5-year temporal windows were generated. The time windows were displaced in 1 year, i.e., the first time window covered the period from 1995 to 1999, the second, from 1996 to 2000 and so on. As in McNamara, Vaaler, and Devers (2003), we used the means of each temporal window in the temporal regressions for in-creased temporal stability. Unlike McNamara, Vaaler, and Devers (2003), all data used were depurated for increased reliability; regressions were not restricted to subsamples.
As with studies aligned with finance research, such as Fama and French (1992) and Mohanram (2005), we also chose to use OLS regression per country between risk-return on equity - as the dependent variable - and value indices, in order to verify its explanatory power regarding the variability of the dependent variable, given the simplicity and robustness of this method, as shown by Avramov (2004) and Campbell and Voul-teenaho (2004), among others.
a) Variables
Pure variables were obtained directly from the Compustat database, which contains the accounting information of companies and harmonizes the annual-ized data according to local, legally defined accounting principles (STANDARD and POOR’s, 2009).
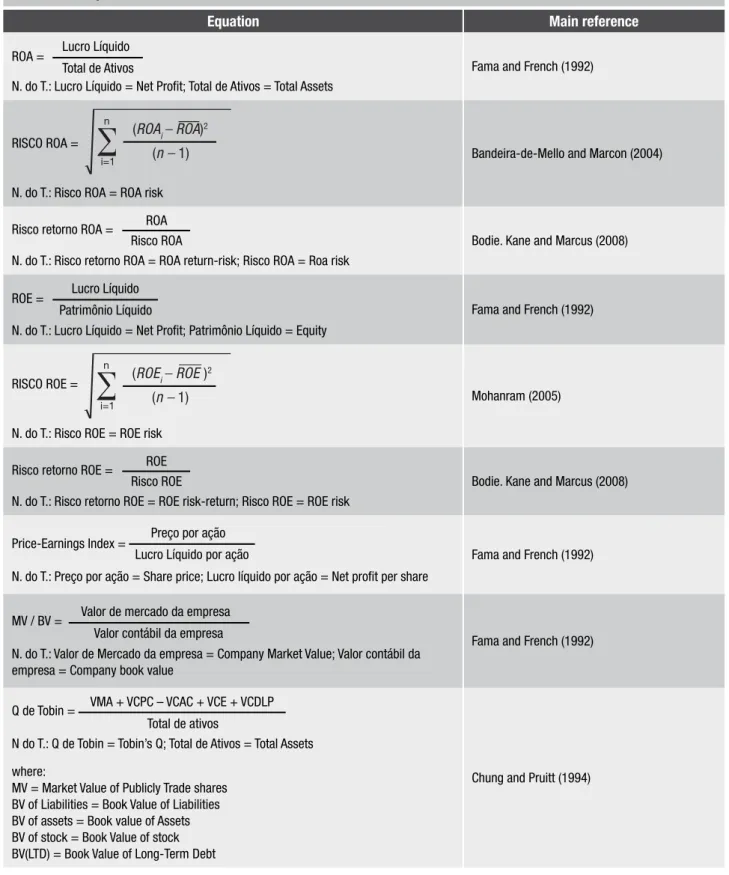
Indices and the other variables were built according to Fame and French (1992), Chung and Pruitt (1994), McGahan and Porter (1997), Bandeira-de-Mello and Marcon (2004), Mohanram (2005) and Bodie, Kane and Marcus (2008). Table 2 summarizes all the equations used to calculate the described indices.
b) Sample
The sample covers the period from 1995 to 2008, to-taling 3,133 records. The period analyzed coincides with the period of economic stabilization for the economies mentioned above. This temporal cut aims to mitigate the problems caused by currency changes, exchange rate instability and economic shocks that cause incon-sistencies in the historical series of these countries. The data used in this study were extracted from Compustat.
The database was treated according to the follow-ing criteria:
1) Due to considerations about construct validity and possible data errors, findings with profitability indi-ces (ROA and ROE) below -100% and over 100% were eliminated, according to the procedure of Goldszmidt, Brito e Vasconcelos (2007).
2) Companies without a Standard Industrial Clas-sification (SIC) or with a SIC code starting with 9 - which regards unclassifiable companies - were also excluded. After excluding companies with insufficient or incomplete data, seemingly spelling and outlier er-rors, the reliability and consistency of data were en-sured.
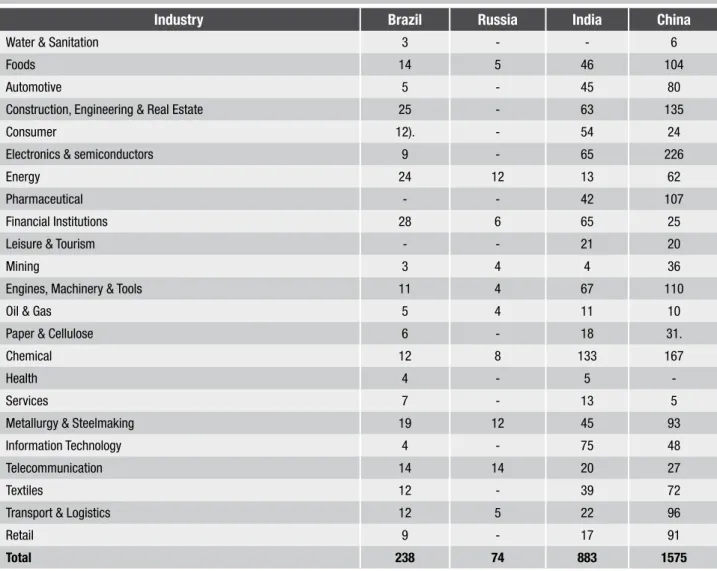
The companies were divided into 23 sectors of economy, as shown in table 1, based on SIC, using two digits (when grouping was necessary to maintain the minimum amount of companies and stocks) or three digits, similarly to Mohanram (2005).
The variables used (table 2) were designed accord-ing to the studies by Fama and French (1992), Chung and Pruitt (1994), McGahan and Porter (1997), Ban-deira-de-Mello and Marcon (2004), Mohanram (2005) and Bodie, Kane and Marcus (2008). This enables the comparison with previous studies using statistical analy-sis and methods similar to the ones used in this study, thus giving it a greater dimension.
To verify the behavior of variables over time, study windows such as those in the study of Gold-szmidt, Brito e Vasconcelos (2007) were designed. Ten 5-year temporal windows were created. The time windows were displaced in 1 year, i.e., the first time window covered the period from 1995 to 1999, the second, from 1996 to 2000 and so on. Therefore, the variables shown in tables 3 to 7 are the means of the variables for the different windows.
Asset risk was calculated according to Bandeira-de-Mello and Marcon (2004), using the standard deviations means of each window. Asset risk tables were omitted due to their physical space, although the analysis of results is shown in the next items.
Finally, in order to verify the temporal evolution of return on assets, OLS linear regressions were designed between the time (temporal windows) and each vari-able separately (temporal regressions). The slope was named variation tendency, because it shows the sign and expected rate of variation that can be used to find the behavior tendency for each variable.
RESULTS
Return on assets
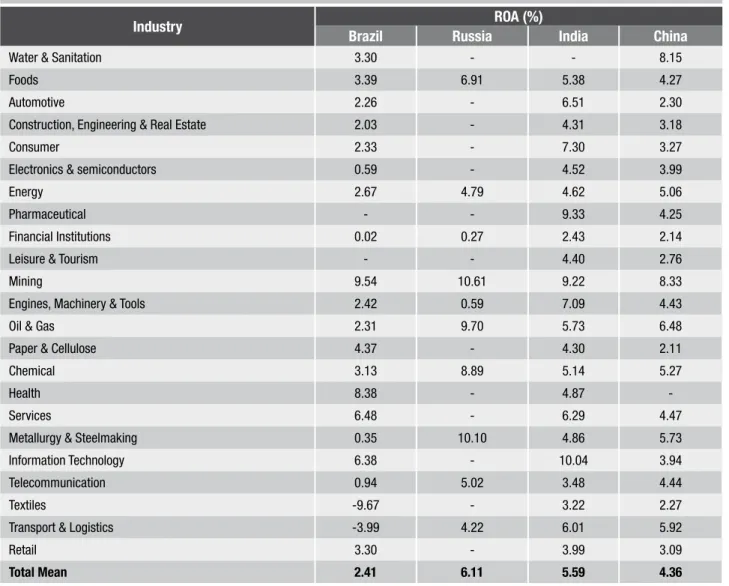
2). A mean test (Student’s t-test) was conducted for ROA, in order to compare the ROA’s of the countries forming the database. The p-value for this test was below 0.0017; the initial hypothesis that total means are equal is therefore rejected. The country with low-est ROA mean between sectors is Brazil, followed by China, India and Russia; values for Russia and India are not statistically different.
These results suggest that Brazil, China, India and Russia not only differ regarding returns, when analyzed as places for investment (generally, for all industries), but its idiosyncratic features could also lead a given investment in the same industry to have different returns according to the country chosen for investment.
The ROA-risk relationship in Brazil is shown in graph 1.
This graph shows that the sectors with best ROA-risk relationship in Brazil are mining, health, water & sanitation, since these have the steepest slopes when straight lines are drawn from the origin to their points in graph 2. In Russia, the same risk-return analysis in-dicates oil & gas, metallurgy & steelmaking and chemi-cal, while in the Chinese market the best relationship is in water & sanitation, mining and oil & gas. In India, consumer, pharmaceutical and oil & gas are the sectors with best ROA-risk.
Temporal evolution analysis for Brazilian compa-nies shows that 16 of the 21 sectors studied have an improvement tendency for risk-return variation, which
Industry Brazil Russia India China
Water & Sanitation 3 - - 6
Foods 14 5 46 104
Automotive 5 - 45 80
Construction, Engineering & Real Estate 25 - 63 135
Consumer 12). - 54 24
Electronics & semiconductors 9 - 65 226
Energy 24 12 13 62
Pharmaceutical - - 42 107
Financial Institutions 28 6 65 25
Leisure & Tourism - - 21 20
Mining 3 4 4 36
Engines, Machinery & Tools 11 4 67 110
Oil & Gas 5 4 11 10
Paper & Cellulose 6 - 18 31.
Chemical 12 8 133 167
Health 4 - 5
-Services 7 - 13 5
Metallurgy & Steelmaking 19 12 45 93
Information Technology 4 - 75 48
Telecommunication 14 14 20 27
Textiles 12 - 39 72
Transport & Logistics 12 5 22 96
Retail 9 - 17 91
Total 238 74 883 1575
Equation Main reference
ROA = Lucro Líquido Total de Ativos
N. do T.: Lucro Líquido = Net Proit; Total de Ativos = Total Assets
Fama and French (1992)
RISCO ROA =
N. do T.: Risco ROA = ROA risk
Bandeira-de-Mello and Marcon (2004)
Risco retorno ROA = ROA Risco ROA
N. do T.: Risco retorno ROA = ROA return-risk; Risco ROA = Roa risk
Bodie. Kane and Marcus (2008)
ROE = Lucro Líquido Patrimônio Líquido
N. do T.: Lucro Líquido = Net Proit; Patrimônio Líquido = Equity
Fama and French (1992)
RISCO ROE =
N. do T.: Risco ROE = ROE risk
Mohanram (2005)
Risco retorno ROE = ROE Risco ROE
N. do T.: Risco retorno ROE = ROE risk-return; Risco ROE = ROE risk
Bodie. Kane and Marcus (2008)
Price-Earnings Index = Preço por ação Lucro Líquido por ação
N. do T.: Preço por ação = Share price; Lucro líquido por ação = Net proit per share
Fama and French (1992)
MV / BV = Valor de mercado da empresa Valor contábil da empresa
N. do T.: Valor de Mercado da empresa = Company Market Value; Valor contábil da empresa = Company book value
Fama and French (1992)
Q de Tobin = VMA + VCPC – VCAC + VCE + VCDLP Total de ativos
N do T.: Q de Tobin = Tobin’s Q; Total de Ativos = Total Assets
Chung and Pruitt (1994) where:
MV = Market Value of Publicly Trade shares BV of Liabilities = Book Value of Liabilities BV of assets = Book value of Assets BV of stock = Book Value of stock BV(LTD) = Book Value of Long-Term Debt
reinforces the results of Goldszmidt, Brito e Vasconcelos (2007), suggesting an improved prospect for invest-ments in Brazil. This result was also found in studies from the World Bank (2008) and the International Mon-etary Fund (2009).
Results for Russia show that 8 of the 10 sectors studied have an upward variation tendency (improve-ment) regarding the risk-return variation, which rein-forces the results of Goldszmidt, Brito e Vasconcelos (2007) and the International Monetary Fund (2009), which could suggest an improved prospect for invest-ments in Russia.
For India, 21 of the 23 sectors studied have an upward variation tendency (improvement) regarding the risk-return relationship, however with lower values than Brazil and Russia, because the tendency mean for returns on assets tends to increase (improvement), but the ROA-risk variation also tends to increase (worsen-ing), suggesting a stable ROA risk-return relationship. Conversely, 19 of the 22 sectors studied in China tend to a downward variation (worsening) of the risk-return relationship. The tendency is one of overall in-crease (mean) of ROA-risk for China, with decreasing ROA’s in the sectors, a result that confirms Goldszmidt, Brito and Vasconcelos (2007), but differs from the World
Bank (2008) and International Monetary Fund (2009), perhaps because the present study, similarly to that of Goldszmidt, Brito and Vasconcelos (2007), focuses on longer-term tendencies.
As Table 3 shows, these results suggest that, among BRICs, the country with the highest potential for improving risk-return in its sectors in the near future is Russia, followed by Brazil, India and China, considering the median of variation tendencies of risk-return.
Return on equity
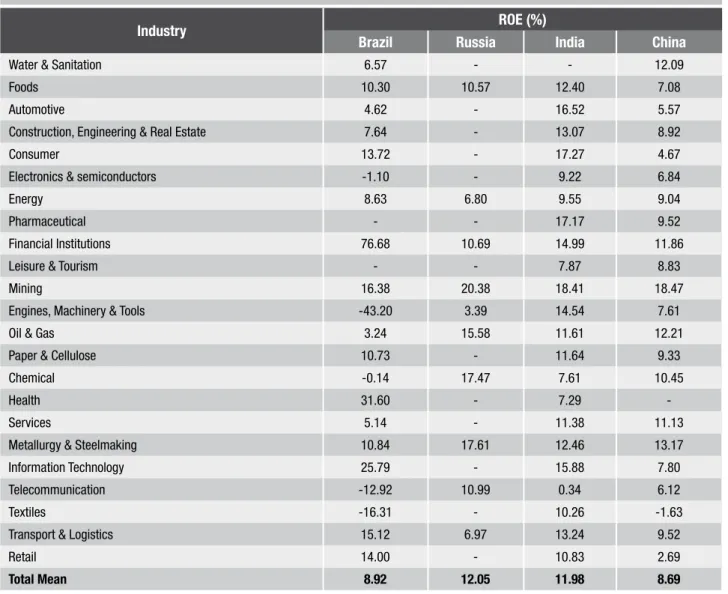
The variable studied here is the return on equity, us-ing the index known as ROE (return on equity) as described in Table 2. ROE was used because it mea-sures the performance of profit to shareholders, thus focusing on profitability for shareholders, the group of interest in this study.
The tests conducted for each country to find whether returns on equity were equal for all of its sec-tors show that a p-value below 0.003 for each country can reject the initial hypothesis that the ROEs for a country’s sector are equal, the same result obtained by McGahan and Porter (1997) and Bandeira-de-Mello and Marcon (2004).
12.0
8.0
4.0 10.0
ROA (%)
ROA risk (%) 6.0
2.0
0.0
0.0 1.0 2.0 3.0 4.0 5.0 6.0 7.0 8.0 9.0
Mining
Water & Sanitation Paper & Cellulose
Construction, Engineering & Real Estate
Health Foods Services Retail
As with ROA, ROE showed no statistical difference between Russia and India. The chi-square test for Brazil and China found a p-value below 0.02, denoting dif-ference between their results.
The analysis of results shows that the sectors with best performance in Brazil, according to this criterion, were water & sanitation, mining and foods; the most unstable profitabilities, or the sectors with highest potential for strategic positioning, were financial institutions, engines, machinery & tools and textiles.
In Russia, the sectors with lowest ROE risk were oil & gas, financial institutions and energy; the sectors with highest risk were engines, machinery & equipment, transport & logistics and foods.
In China, the sectors with lowest volatility were water & sanitation, oil & gas and financial institutions, while in India, these were energy, oil & gas and services. For China and India, telecommunication was among the three worst performing sectors.
With a p-value below 0.005, t-test shows differences among sectoral ROE risks per country.
Once the returns on equity were calculated for each sector and its risks, it was possible to calculate the ROE risk-return, similarly to the indices of Sharpe (BODIE,
KANE, MARCUS, 2008), as ROE over ROE risk. Brazilian sectors with best ROE risk-return rela-tion were mining, informarela-tion technology and water & sanitation. From this perspective, the least attractive segments (with lowest risk-return ratio) are telecom-munications, engines, machinery & tools and textiles, given their negative results.
In Russia, the segments with best ROE risk-return, according to the analysis, are oil & gas, metallurgy & steelmaking and financial institutions, while the sectors with lowest ROE risk-return rela-tion are engines, machinery & tools and transports & logistics.
Among Chinese sectors, this risk and return analysis indicates that water & sanitation, mining and oil & gas are the best segments for investment, while paper & cellulose, automotive and textiles are the least suitable ones. For India, according to this perspective, the best segments to invest are consumer, pharmaceutical and oil & gas, while the least attractive are telecommunica-tions, leisure & tourism and textiles.
The Anova tests have shown that, with a p-value below 0.02, ROE risk-return relations are not different among sectors in a same country and between coun-tries, thereby supporting not only the theory of
Indus-2.0
1.6
0.6 1.2
0.2 1.8
0.8
Mean ROA Risk-return
(%
)
Emporal windows (initial and inal year) 1.4
0.4 1.0
0.0
95-99 96-00 97-01 98-02 99-03 00-04 01-05 02-06 03-07 04-08
trial Organization (MCGAHAN; PORTER, 1997), but also suggesting that markets are not perfectly efficient; if they were, risk-return differences between industries should compensate each other so that they had the same risk-return relation, or investors would migrate from lower to higher risk-return industries (BODIE relationship; KANE; MARCUS, 2008).
Temporal tendency results for Brazil show that 12 of the 21 sectors studied have an improvement ten-dency regarding risk-return variation, which reinforces the results of Goldszmidt, Brito e Vasconcelos (2007). Tendency means for returns on equity and ROE risk also suggest improvement, with increased ROE’s and decreased ROE risks.
Therefore, the sectors with highest improvement tendency regarding the ROE risk-return in Brazil are chemical, consumer, mining and water & sanitation, while this index tends to decrease for information tech-nology, foods and health.
Entrepreneurs can expand and refine their analysis by considering not only current risk-return relation, but also its tendency, in order to seek opportunities in sectors that have both good risk-return on equity and a stable or improvement tendency for this index.
Results for Russia show that 8 of the 10 studied sec-tors have a positive variation tendency (improvement) regarding the risk-return variation, thus confirming the findings of Goldszmidt, Brito e Vasconcelos (2007); this
Industry ROA (%)
Brazil Russia India China
Water & Sanitation 3.30 - - 8.15
Foods 3.39 6.91 5.38 4.27
Automotive 2.26 - 6.51 2.30
Construction, Engineering & Real Estate 2.03 - 4.31 3.18
Consumer 2.33 - 7.30 3.27
Electronics & semiconductors 0.59 - 4.52 3.99
Energy 2.67 4.79 4.62 5.06
Pharmaceutical - - 9.33 4.25
Financial Institutions 0.02 0.27 2.43 2.14
Leisure & Tourism - - 4.40 2.76
Mining 9.54 10.61 9.22 8.33
Engines, Machinery & Tools 2.42 0.59 7.09 4.43
Oil & Gas 2.31 9.70 5.73 6.48
Paper & Cellulose 4.37 - 4.30 2.11
Chemical 3.13 8.89 5.14 5.27
Health 8.38 - 4.87
-Services 6.48 - 6.29 4.47
Metallurgy & Steelmaking 0.35 10.10 4.86 5.73
Information Technology 6.38 - 10.04 3.94
Telecommunication 0.94 5.02 3.48 4.44
Textiles -9.67 - 3.22 2.27
Transport & Logistics -3.99 4.22 6.01 5.92
Retail 3.30 - 3.99 3.09
Total Mean 2.41 6.11 5.59 4.36
could suggest an improved prospect for investments in Russia. Tendency means for returns on assets and ROE risk also suggest improvement, with increased ROE’s and decreased ROE risks.
For India, 21 of the 23 studied sectors have a up-ward tendency (improvement) regarding the risk-return relationship, however with lower values than Brazil and Russia, because the tendency mean for returns on assets tends to increase (improvement), but the ROE-risk variation also tends to increase (worsening), which suggests a stable ROE risk-return relationship. These results generally confirm those obtained by the International Monetary Fund (2009).
Conversely, 19 of the 22 studied sectors in China tend to a negative variation (worsening) of the risk-return relationship.
The only Chinese sectors where improvement tendencies were found for this index are services, financial institutions and water & sanitation. The ten-dency is one of overall increase (mean) of ROE-risk for China, with decreasing sectoral ROEs, a result that confirms Goldszmidt, Brito and Vasconcelos (2007), but differs from the World Bank (2008) and the In-ternational Monetary Fund (2009), perhaps because the present study, similarly to that of Goldszmidt, Brito and Vasconcelos (2007), focuses on longer-term tendencies.
Therefore, the results of ROE risk-return temporal analysis suggest that the BRIC countries with highest increase tendency (improvement) for risk-return in the short term are Brazil and Russia; India tends to remain stable, while China, by contrast, tends to reduce its ROE risk-return as a place for investment (Table 4).
Moreover, Brazil and Russia have improved in this index, with a higher total increase for Russia, thus making it the best ROE risk-return among BRICs in the last temporal window, with an improvement ten-dency. Brazil also tends to improve, albeit at a lower rate than Russia.
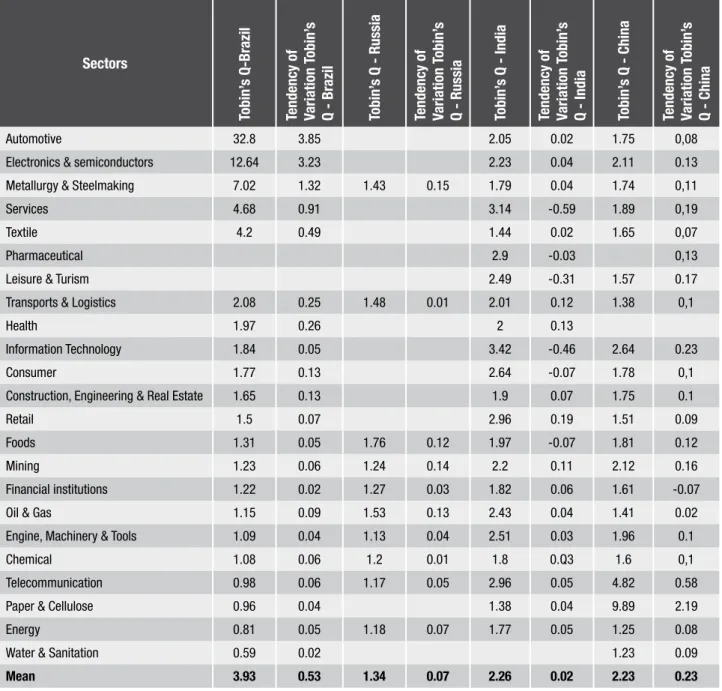
Tobin’s q
Conceptually, Q is determined by the ratio between a company’s market value and the cost of replacing its physical assets; its formula is shown in table 2. Its different levels represent an incentive for new investment. If Q is higher than one, the company has an incentive to invest, since the value of physi-cal capital invested exceeds its cost, adding value to their stocks. If Q is below one, the company has no incentive to invest, since the value of physical
capital invested does not exceed its cost, decreas-ing stock value.
In Brazil, the sectors with more incentives to invest in physical assets are automotive, electronics & semi-conductors, metallurgy & steelmaking; these are also the ones with highest upward tendency for this index.
In Russia, the sectors with more incentives to invest in physical assets are foods and oil & gas; the country has no sector with a Tobin’s q below one. All Russian sectors tend to an increased Q, which suggests im-provement from the point of view of the reinvestments required to maintain assets and company strategies.
In India, the sectors with more incentives to invest in physical assets are information technology, services and retail. However, 6 of the 22 sectors studied have a downward variation tendency, suggesting that reinvest-ment in assets will tend to generate less value.
Results for China show that only financial institu-tions have a negative variation tendency for Tobin’s q. Chinese sectors with highest Q are paper & cellu-lose, telecommunication and information technology; their mean shows an overall Tobin’s q improvement tendency.
With p-value below 0.005, t-test shows differences among sectoral results of Tobin’s q per country. Fur-thermore, Tobin’s q results below one were only found in Brazil. However, Brazil also has the sectors with the highest Tobin’s q, and all of its sectors have an im-provement tendency in this index. Russia also tends to an increased Q for all sectors; China tends negatively only for financial institutions, while India has an overall downward tendency (sectors mean), and for six sec-tors isolatedly.
These results, shown in table 5, may suggest that BRICs growth has not only generated value, but this improvement tends to continue and become stronger. This can be a sign of sustained economic growth, as it shows that the natural replacement of assets can cre-ate value.
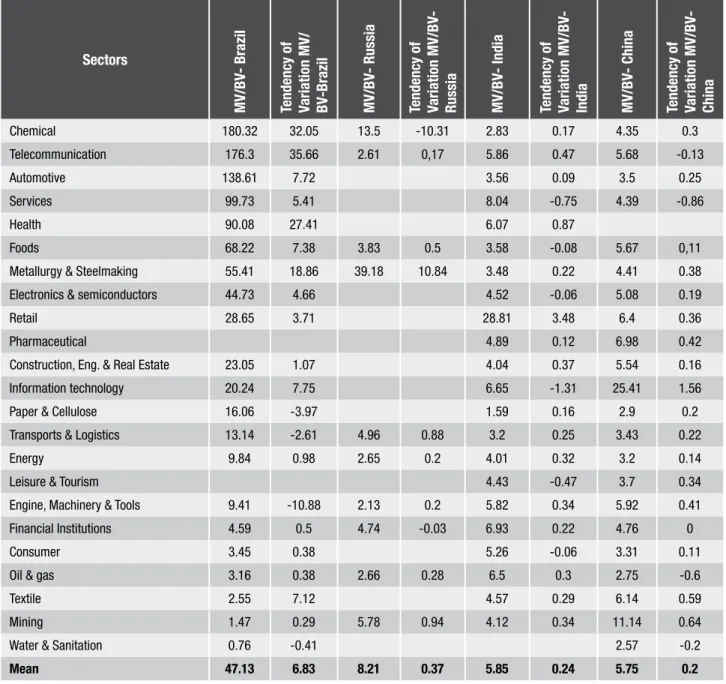
Market value-book value (MV / BV)
For Brazil, the sectors with highest creation of value compared to their historical costs (book value) were chemical, telecommunications and automotive. In other words, these are the sectors that achieved most (or that the market believes will achieve most) value for shareholders in the future (FAMA and FRENCH, 1992). By contrast, the Brazilian sectors with lowest creation of value during the period stud-ied were textile, mining and water & sanitation - the last destroyed value, in the sense that its book value (historical cost) was higher than the market value of the companies in this sector.
Only in four Brazilian sectors this index tends to decrease: paper & cellulose, transport & logistics,
engines, machinery & tools and water and sanitation. Brazil’s sectoral mean, however, is higher than that of BRICs, which suggests that the market foresees greater future value for Brazilian companies compared to their book value - which tends to be tangible for the most part (MOHANRAM, 2005).
In Russia, the sectors with the highest value cre-ation, according to MV/BV index, were metallurgy & steelmaking, chemical and mining, while telecom-munication and engines, machinery & tools were the sectors with lowest (worst) market value-book value relation. Only two Russian sectors tended to decrease their MV / BV indices: chemical and finan-cial institutions.
Industry ROE (%)
Brazil Russia India China
Water & Sanitation 6.57 - - 12.09
Foods 10.30 10.57 12.40 7.08
Automotive 4.62 - 16.52 5.57
Construction, Engineering & Real Estate 7.64 - 13.07 8.92
Consumer 13.72 - 17.27 4.67
Electronics & semiconductors -1.10 - 9.22 6.84
Energy 8.63 6.80 9.55 9.04
Pharmaceutical - - 17.17 9.52
Financial Institutions 76.68 10.69 14.99 11.86
Leisure & Tourism - - 7.87 8.83
Mining 16.38 20.38 18.41 18.47
Engines, Machinery & Tools -43.20 3.39 14.54 7.61
Oil & Gas 3.24 15.58 11.61 12.21
Paper & Cellulose 10.73 - 11.64 9.33
Chemical -0.14 17.47 7.61 10.45
Health 31.60 - 7.29
-Services 5.14 - 11.38 11.13
Metallurgy & Steelmaking 10.84 17.61 12.46 13.17
Information Technology 25.79 - 15.88 7.80
Telecommunication -12.92 10.99 0.34 6.12
Textiles -16.31 - 10.26 -1.63
Transport & Logistics 15.12 6.97 13.24 9.52
Retail 14.00 - 10.83 2.69
Total Mean 8.92 12.05 11.98 8.69
In India, the sectors with highest capital gain to shareholders were retail, services and financial institu-tions. The Indian sectors with poorest performance in this index for the studied period were paper & cellu-lose, chemical and transport & logistics. Although six sectors indicate a downward tendency in the MV/BV
relation, India’s sectoral mean suggests an increase in this index.
The results for China (Table 6) show that informa-tion technology, textile and pharmaceutical sectors had a better performance (value creation) in the market value-book value comparison. Chinese sectors with
Tobin’s Qt, country, sector = aTobin’s Q, country, sector + bTobin’s Q, country, sector + ε (error )Tobin’s Q, country, sector
Table 5 – Tobin’s Q
Sectors
Tobin’
s Q-Brazil
Tendenc
y of
V
ariation T
obin’
s
Q - Brazil Tobin’
s Q - Russia
Tendenc
y of
V
ariation T
obin’
s
Q - Russia Tobin’
s Q - India
Tendenc
y of
V
ariation T
obin’
s
Q - India Tobin’
s Q - China
Tendenc
y of
V
ariation T
obin’
s
Q - China
Automotive 32.8 3.85 2.05 0.02 1.75 0,08
Electronics & semiconductors 12.64 3.23 2.23 0.04 2.11 0.13
Metallurgy & Steelmaking 7.02 1.32 1.43 0.15 1.79 0.04 1.74 0,11
Services 4.68 0.91 3.14 -0.59 1.89 0,19
Textile 4.2 0.49 1.44 0.02 1.65 0,07
Pharmaceutical 2.9 -0.03 0,13
Leisure & Turism 2.49 -0.31 1.57 0.17
Transports & Logistics 2.08 0.25 1.48 0.01 2.01 0.12 1.38 0,1
Health 1.97 0.26 2 0.13
Information Technology 1.84 0.05 3.42 -0.46 2.64 0.23
Consumer 1.77 0.13 2.64 -0.07 1.78 0,1
Construction, Engineering & Real Estate 1.65 0.13 1.9 0.07 1.75 0.1
Retail 1.5 0.07 2.96 0.19 1.51 0.09
Foods 1.31 0.05 1.76 0.12 1.97 -0.07 1.81 0.12
Mining 1.23 0.06 1.24 0.14 2.2 0.11 2.12 0.16
Financial institutions 1.22 0.02 1.27 0.03 1.82 0.06 1.61 -0.07
Oil & Gas 1.15 0.09 1.53 0.13 2.43 0.04 1.41 0.02
Engine, Machinery & Tools 1.09 0.04 1.13 0.04 2.51 0.03 1.96 0.1
Chemical 1.08 0.06 1.2 0.01 1.8 0.Q3 1.6 0,1
Telecommunication 0.98 0.06 1.17 0.05 2.96 0.05 4.82 0.58
Paper & Cellulose 0.96 0.04 1.38 0.04 9.89 2.19
Energy 0.81 0.05 1.18 0.07 1.77 0.05 1.25 0.08
Water & Sanitation 0.59 0.02 1.23 0.09
lowest MV/BV index for the studied period were water & sanitation, oil & gas and paper & cellulose. Only four of the 22 sectors in China indicated a downward tendency in the MV/BV index: telecommunication, services, water & sanitation and oil & gas; for the two latter, the analysis not only indicates low value creation
compared with other sectors of the country, but also that this tendency should grow deeper.
Generally, however, the mean for Chinese in-dustries tends to increased values in the comparison between market value and historical accounting costs.
These results suggest that the market foresees
MV/BVt,country, sector = aMV/BV, country, sector
Table 6 – MV/BV
Sectors
MV/BV
- Brazil
Tendenc
y of
V
ariation MV/
BV
-Brazil
MV/BV
- Russia
Tendenc
y of
V
ariation MV/BV
-Russia MV/BV
- India
Tendenc
y of
V
ariation MV/BV
-
India MV/BV
- China
Tendenc
y of
V
ariation MV/BV
-
China
Chemical 180.32 32.05 13.5 -10.31 2.83 0.17 4.35 0.3
Telecommunication 176.3 35.66 2.61 0,17 5.86 0.47 5.68 -0.13
Automotive 138.61 7.72 3.56 0.09 3.5 0.25
Services 99.73 5.41 8.04 -0.75 4.39 -0.86
Health 90.08 27.41 6.07 0.87
Foods 68.22 7.38 3.83 0.5 3.58 -0.08 5.67 0,11
Metallurgy & Steelmaking 55.41 18.86 39.18 10.84 3.48 0.22 4.41 0.38
Electronics & semiconductors 44.73 4.66 4.52 -0.06 5.08 0.19
Retail 28.65 3.71 28.81 3.48 6.4 0.36
Pharmaceutical 4.89 0.12 6.98 0.42
Construction, Eng. & Real Estate 23.05 1.07 4.04 0.37 5.54 0.16
Information technology 20.24 7.75 6.65 -1.31 25.41 1.56
Paper & Cellulose 16.06 -3.97 1.59 0.16 2.9 0.2
Transports & Logistics 13.14 -2.61 4.96 0.88 3.2 0.25 3.43 0.22
Energy 9.84 0.98 2.65 0.2 4.01 0.32 3.2 0.14
Leisure & Tourism 4.43 -0.47 3.7 0.34
Engine, Machinery & Tools 9.41 -10.88 2.13 0.2 5.82 0.34 5.92 0.41
Financial Institutions 4.59 0.5 4.74 -0.03 6.93 0.22 4.76 0
Consumer 3.45 0.38 5.26 -0.06 3.31 0.11
Oil & gas 3.16 0.38 2.66 0.28 6.5 0.3 2.75 -0.6
Textile 2.55 7.12 4.57 0.29 6.14 0.59
Mining 1.47 0.29 5.78 0.94 4.12 0.34 11.14 0.64
Water & Sanitation 0.76 -0.41 2.57 -0.2
growth for the sectors studied for each of the BRIC countries, which in turn suggests (i) investor confi-dence in the future of these sectors and countries, and (ii) market confidence in administrations and entrepreneurs who are working for this end, with a greater positive expectation for Brazil, especially in the chemical, automotive, telecommunications,
services and health sectors; and (iii) that the market believes that the sectors of BRICs tend to generate even more value compared to book value.
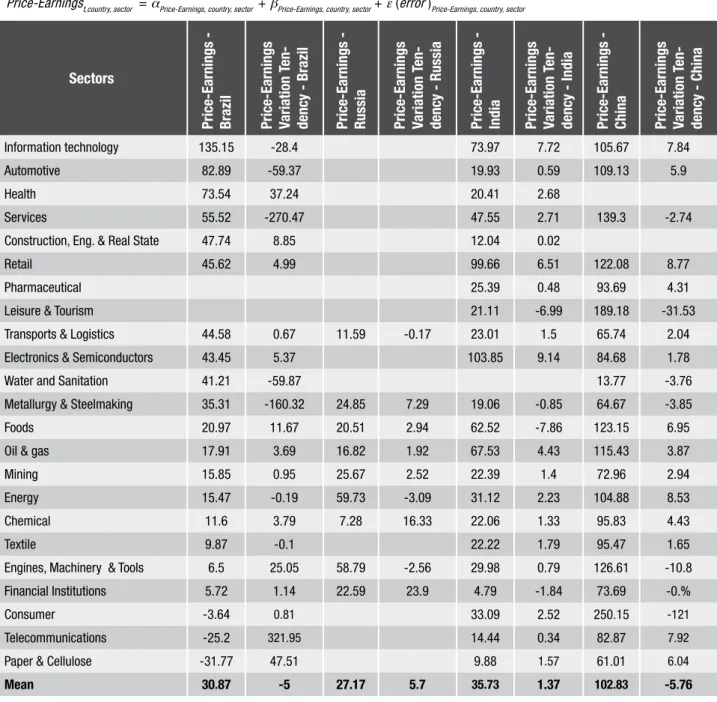
Price and Earnings
The higher the profits of a company, or the expecta-tion of future profits (cash flow to shareholders), the
Price-Earningst,country, sector = aPrice-Earnings, country, sector + bPrice-Earnings, country, sector + ε (error )Price-Earnings, country, sector
Table 7 – Price-Earnings
Sectors
Price-Earnings - Brazil Price-Earnings Variation T
en-denc
y - Brazil
Price-Earnings - Russia Price-Earnings Variation T
en-denc
y - Russia
Price-Earnings - India Price-Earnings Variation T
en-denc
y - India
Price-Earnings - China Price-Earnings Variation T
en-denc
y - China
Information technology 135.15 -28.4 73.97 7.72 105.67 7.84
Automotive 82.89 -59.37 19.93 0.59 109.13 5.9
Health 73.54 37.24 20.41 2.68
Services 55.52 -270.47 47.55 2.71 139.3 -2.74
Construction, Eng. & Real State 47.74 8.85 12.04 0.02
Retail 45.62 4.99 99.66 6.51 122.08 8.77
Pharmaceutical 25.39 0.48 93.69 4.31
Leisure & Tourism 21.11 -6.99 189.18 -31.53
Transports & Logistics 44.58 0.67 11.59 -0.17 23.01 1.5 65.74 2.04
Electronics & Semiconductors 43.45 5.37 103.85 9.14 84.68 1.78
Water and Sanitation 41.21 -59.87 13.77 -3.76
Metallurgy & Steelmaking 35.31 -160.32 24.85 7.29 19.06 -0.85 64.67 -3.85
Foods 20.97 11.67 20.51 2.94 62.52 -7.86 123.15 6.95
Oil & gas 17.91 3.69 16.82 1.92 67.53 4.43 115.43 3.87
Mining 15.85 0.95 25.67 2.52 22.39 1.4 72.96 2.94
Energy 15.47 -0.19 59.73 -3.09 31.12 2.23 104.88 8.53
Chemical 11.6 3.79 7.28 16.33 22.06 1.33 95.83 4.43
Textile 9.87 -0.1 22.22 1.79 95.47 1.65
Engines, Machinery & Tools 6.5 25.05 58.79 -2.56 29.98 0.79 126.61 -10.8
Financial Institutions 5.72 1.14 22.59 23.9 4.79 -1.84 73.69 -0.%
Consumer -3.64 0.81 33.09 2.52 250.15 -121
Telecommunications -25.2 321.95 14.44 0.34 82.87 7.92
Paper & Cellulose -31.77 47.51 9.88 1.57 61.01 6.04
greater the share price and, consequently, the greater the value of this company (CHENG and DONG, 2001). To assess this variable, we used the price-earnings in-dex (see Table 2). Therefore, companies with highest relation of share price over current earnings are those for which the market expects highest future growth of cash flows to shareholders, either in the form of capital gain or profit distribution (FAMA and FRENCH, 1992).
With a p-value below 0.05, Anova test showed sectoral price-earnings indices to differ per country.
The Anova between the means of the countries also shows differences between the BRICs, with p-value below 0.10.
The market believes that the Brazilian sectors with highest potential to create value, i.e. greatest profit-earnings index, are information technology, automotive and health; the sectors with lowest po-tential for value creation (lowest price-earnings) are consumer, financial institutions and engines, ma-chinery & tools. It is noteworthy, however, that the
BRAZIL
Industry
Companies ROE Risk-return Trend of ROE risk-return variation (p
.p
.)
ROE (%) ROE Risk (%) RO
A (%)
RO
A Risk (%)
Tobin’
s q
Price-Proit MV / BV
Mining 3 1.9 0.3 16.4 8.5 9.5 4.1 1.2 15.9 1.5
Information Technology 4 1.4 -1.1 25.8 18.5 6.4 16.3 1.8 135.2 20.2
Water & Sanitation 3 1.1 0.2 6.6 6.3 3.3 3.1 0.6 41.2 0.8
Health 4 0.9 -0.2 31.6 34.1 8.4 7.0 2.0 73.5 90.1
Foods 14 0.8 -0.3 10.3 13.6 3.4 3.6 1.3 21.0 68.2
Paper & Cellulose 6 0.7 0.2 10.7 14.7 4.4 5.3 1.0 -31.8 16.1
Consumer 12 0.6 0.3 13.7 22.3 2.3 15.1 1.8 -3.6 3.4
Retail 9 0.5 -0.1 14.0 25.5 3.3 6.5 1.5 45.6 28.6
Construction, Engineering & Real Estate 25 0.5 0.1 7.6 15.5 2.0 3.1 1.7 47.7 23.0
Metallurgy & Steelmaking 19 0.4 0.2 10.8 24.4 0.3 10.2 7.0 35.3 55.4
Financial Institutions 28 0.4 0.1 76.7 174.2 0.0 8.8 0.2 5.7 4.6
Energy 24 0.4 0.0 8.6 23.3 2.7 5.4 0.8 15.5 9.8
Transport & Logistics 12 0.3 0.2 15.1 60.5 -4.0 19.6 2.1 44.6 13.1
Automotive 5 0.2 -0.1 4.6 24.3 2.3 6.3 32.8 82.9 138.6
Services 7 0.2 -0.1 5.1 31.4 6.5 8.2 4.7 55.5 99.7
Oil & Gas 5 0.1 0.3 3.2 22.0 2.3 7.5 1.2 17.9 3.2
Chemical 12 0.0 0.3 -0.1 32.2 3.1 7.6 -1.1 11.6 180.3
Electronics & semiconductors 9 0.0 -0.1 -1.1 23.3 0.6 7.6 12.6 43.5 44.7
Textiles 12 -0.2 -0.1 -16.3 67.8 -9.7 9.3 4.2 9.9 2.5
Engines, Machinery & Tools 11 -0.3 0.2 -43.2 150.9 2.4 8.2 -1.1 6.5 9.4
Telecommunication 14 -0.3 0.0 -12.9 41.6 0.9 5.5 1.0 -25.2 176.3
Total 238
Mean 0.5 0.0 8.9 39.7 2.4 8.0 3.9 30.9 47.1
paper & cellulose, telecommunication and consumer industries have negative values due to the loss found during the studied period. In addition, a positive ten-dency (growth) in the price-earnings index was found in 15 of the 21 Brazilian sectors studied.
In Russia, the sectors with highest potential for value creation are energy, engines, machinery & tools and mining, while the sectors with lowest potential to generate value (lower price-earnings index) are chemical, transport & logistics and oil & gas. A reduc-tion tendency in the price-earnings index was found in three of the 10 Russian sectors analyzed in this study.
In India, the sectors with highest price-earnings index are electronics & semiconductors, retail and infor-mation technology. The industries with lowest potential for value creation – lowest price-earnings – are financial institutions, paper & cellulose and construction. Down-ward tendency in the price-earnings index was found for only four of the 22 Indian sectors analyzed in this study, suggesting confidence of the markets in future cash flow increase for Indian companies.
Chinese sectors with highest potential for value creation, due to the expectation of future cash flows
to shareholders, are consumer, leisure & tourism and services. By contrast, water & sanitation, paper & cellu-lose, metallurgy & steelmaking were found to have the lowest price-earnings index in the country. Seven of the 22 Chinese industries tended to a decreased price-earnings index, which confirms the results for ROE risk and ROE risk-return (suggesting an upward tendency for the former and downward for the latter), which could lead to decreased effect of profit on company value, due to increased risk, in line with the results of Mohanram (2005).
The analysis of price-earnings index found that Brazil and China tend to suffer a slowdown in the in-crease of market-perceived value for each incremental unit of profit, which suggests the development and maturation of these markets.
The results for the price-earnings index shown in Table 7 also indicate that, although findings suggest a tendency to create value, the market may not be will-ing to pay for the unit of profit per share in the same proportion as companies tend to generate future value, perhaps due to increased risk, which would compro-mise the risk-return relation.
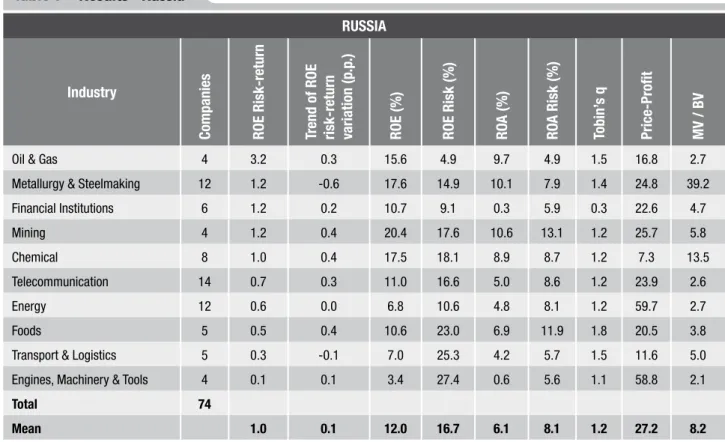
RUSSIA
Industry
Companies ROE Risk-return Trend of ROE risk-return variation (p
.p
.)
ROE (%) ROE Risk (%) RO
A (%)
RO
A Risk (%)
Tobin’
s q
Price-Proit MV / BV
Oil & Gas 4 3.2 0.3 15.6 4.9 9.7 4.9 1.5 16.8 2.7
Metallurgy & Steelmaking 12 1.2 -0.6 17.6 14.9 10.1 7.9 1.4 24.8 39.2
Financial Institutions 6 1.2 0.2 10.7 9.1 0.3 5.9 0.3 22.6 4.7
Mining 4 1.2 0.4 20.4 17.6 10.6 13.1 1.2 25.7 5.8
Chemical 8 1.0 0.4 17.5 18.1 8.9 8.7 1.2 7.3 13.5
Telecommunication 14 0.7 0.3 11.0 16.6 5.0 8.6 1.2 23.9 2.6
Energy 12 0.6 0.0 6.8 10.6 4.8 8.1 1.2 59.7 2.7
Foods 5 0.5 0.4 10.6 23.0 6.9 11.9 1.8 20.5 3.8
Transport & Logistics 5 0.3 -0.1 7.0 25.3 4.2 5.7 1.5 11.6 5.0
Engines, Machinery & Tools 4 0.1 0.1 3.4 27.4 0.6 5.6 1.1 58.8 2.1
Total 74
Mean 1.0 0.1 12.0 16.7 6.1 8.1 1.2 27.2 8.2
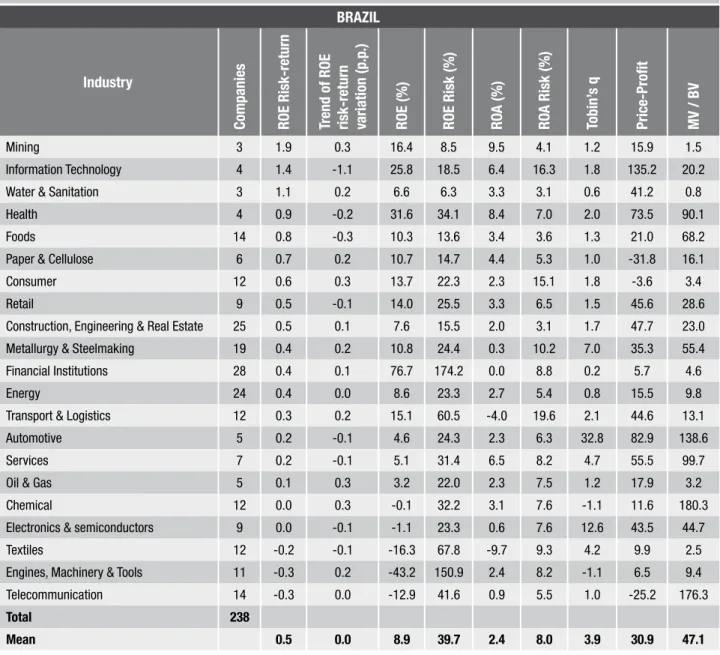
ANALYSIS OF RESULTS
The results of Tobin’s Q, MV / BV and price-earnings combined with ROE risk-return and its temporal varia-tion, suggest that, as a place for investment, Bra-zil is improving its risk-return relation; the country has the potential (according Tobin’s Q results) and
the tendency to increase value creation (according to MV / BV results), through strategic investment; however it will tend to have a slowdown in the increase of market-perceived value for each incre-mental unit of profit, according to the price-earnings index in general (MOHANRAM, 2005). It is worth to analyze more specifically each sector of each country separately.
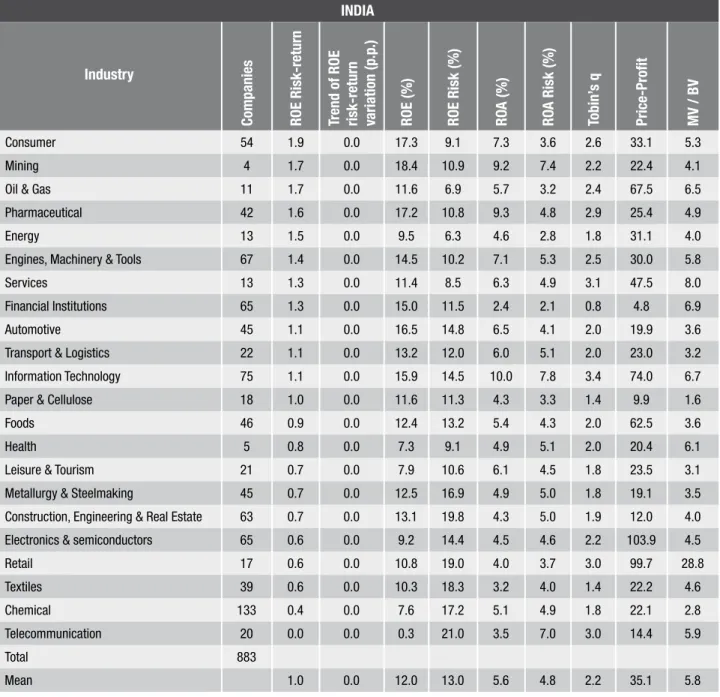
INDIA
Industry
Companies ROE Risk-return Trend of ROE risk-return variation (p
.p
.)
ROE (%) ROE Risk (%) RO
A (%)
RO
A Risk (%)
Tobin’
s q
Price-Proit MV / BV
Consumer 54 1.9 0.0 17.3 9.1 7.3 3.6 2.6 33.1 5.3
Mining 4 1.7 0.0 18.4 10.9 9.2 7.4 2.2 22.4 4.1
Oil & Gas 11 1.7 0.0 11.6 6.9 5.7 3.2 2.4 67.5 6.5
Pharmaceutical 42 1.6 0.0 17.2 10.8 9.3 4.8 2.9 25.4 4.9
Energy 13 1.5 0.0 9.5 6.3 4.6 2.8 1.8 31.1 4.0
Engines, Machinery & Tools 67 1.4 0.0 14.5 10.2 7.1 5.3 2.5 30.0 5.8
Services 13 1.3 0.0 11.4 8.5 6.3 4.9 3.1 47.5 8.0
Financial Institutions 65 1.3 0.0 15.0 11.5 2.4 2.1 0.8 4.8 6.9
Automotive 45 1.1 0.0 16.5 14.8 6.5 4.1 2.0 19.9 3.6
Transport & Logistics 22 1.1 0.0 13.2 12.0 6.0 5.1 2.0 23.0 3.2
Information Technology 75 1.1 0.0 15.9 14.5 10.0 7.8 3.4 74.0 6.7
Paper & Cellulose 18 1.0 0.0 11.6 11.3 4.3 3.3 1.4 9.9 1.6
Foods 46 0.9 0.0 12.4 13.2 5.4 4.3 2.0 62.5 3.6
Health 5 0.8 0.0 7.3 9.1 4.9 5.1 2.0 20.4 6.1
Leisure & Tourism 21 0.7 0.0 7.9 10.6 6.1 4.5 1.8 23.5 3.1
Metallurgy & Steelmaking 45 0.7 0.0 12.5 16.9 4.9 5.0 1.8 19.1 3.5
Construction, Engineering & Real Estate 63 0.7 0.0 13.1 19.8 4.3 5.0 1.9 12.0 4.0
Electronics & semiconductors 65 0.6 0.0 9.2 14.4 4.5 4.6 2.2 103.9 4.5
Retail 17 0.6 0.0 10.8 19.0 4.0 3.7 3.0 99.7 28.8
Textiles 39 0.6 0.0 10.3 18.3 3.2 4.0 1.4 22.2 4.6
Chemical 133 0.4 0.0 7.6 17.2 5.1 4.9 1.8 22.1 2.8
Telecommunication 20 0.0 0.0 0.3 21.0 3.5 7.0 3.0 14.4 5.9
Total 883
Mean 1.0 0.0 12.0 13.0 5.6 4.8 2.2 35.1 5.8
Table 8 allows the analysis of this study to be more directly examined; it shows the results for Brazil, both in general and per sector.
Using the same methods, the results for Russia indicate a tendency of improvement in the risk-return relation, a potential to generate value for reinvest-ment in physical assets and increased market value compared to book value and marginal profit. Table 9 shows the results per sector for Russia.
Results for India generally suggest stability regard-ing ROE risk-return, increased generation of value (MV / BV) and decreased potential of value creation for investment in assets (Tobin’s Q). The results for India are consolidated in table 10.
Similarly, results for China indicate a tendency to decreased ROE risk-return, the creation of value for re-investment in physical assets and increased market value compared to book value; however, they also indicate
CHINA
Industry
Companies ROE Risk-return Trend of ROE risk-return variation (p
.p
.)
ROE (%) ROE Risk (%) RO
A (%)
RO
A Risk (%)
Tobin’
s q
Price-Proit MV / BV
Water & Sanitation 6 2.2 0.0 12.1 5.5 8.2 3.6 1.2 13.8 2.6
Oil & Gas 10 1.9 0.0 12.2 6.6 6.5 3.2 1.4 115.4 2.7
Financial Institutions 25 1.7 0.3 11.9 6.9 2.1 1.6 0.6 73.7 4.8
Mining 36 1.5 0.0 18.5 12.1 8.3 4.0 2.1 73.0 6.1
Metallurgy & Steelmaking 93 0.9 -0.1 13.2 14.5 5.7 3.9 1.7 64.7 4.4
Services 5 0.9 0.4 11.1 12.9 4.5 4.7 1.9 139.3 4.4
Transport & Logistics 96 0.8 -0.1 9.5 12.0 5.9 4.6 1.4 65.7 3.4
Energy 62 0.7 -0.3 9.0 12.2 5.1 3.9 1.2 104.9 3.2
Chemical 167 0.7 -0.2 10.5 14.6 5.3 6.5 1.6 95.8 4.3
Leisure & Tourism 20 0.7 0.0 8.8 12.6 2.8 8.4 1.6 189.2 3.7
Pharmaceutical 107 0.6 -0.2 9.5 15.0 4.2 7.4 1.9 93.7 7.0
Engines, Machinery & Tools 110 0.4 0.0 7.6 18.2 4.4 5.3 2.0 126.6 5.9
Paper & Cellulose 31 0.4 -0.1 9.3 23.2 2.1 11.7 9.9 61.0 2.9
Construction, Engineering & Real Estate 135 0.4 -0.1 8.9 25.2 3.2 5.8 1.8 91.6 5.5
Information Technology 48 0.3 -0.2 7.8 22.7 3.9 11.7 2.6 105.7 25.4
Electronics & semiconductors 226 0.3 -0.1 6.8 22.6 4.0 7.4 2.1 84.7 5.1
Foods 104 0.2 -0.3 7.1 28.5 4.3 8.2 1.8 123.1 5.7
Automotive 80 0.2 -0.1 5.6 23.1 2.3 9.8 1.8 109.1 3.5
Telecommunication 27 0.2 -0.1 6.1 32.5 4.4 11.8 4.8 82.9 5.7
Consumer 24 0.2 -0.3 4.7 26.5 3.3 8.0 1.8 250.1 3.3
Retail 91 0.1 0.0 2.7 28.5 3.1 4.9 1.5 122.1 6.4
Textiles 72 0.0 -0.3 -1.6 41.8 2.3 9.3 1.7 95.5 11.1
Total 1575
Mean 0.7 -0.1 9.0 18.5 4.4 6.7 2.2 102.8 5.8
a slowdown in the effect of marginal profit on created value. Table 11 shows the consolidated results for China.
Table 12 provides a clearer overview of the most attractive sectors for investment in Brazil, Russia, India and China according to risk-return and value creation; this table ranks ROE risk-return according to value and tendency for the BRIC countries.
CONCLUSION
In this context, this article contributes for the first time to a joint analysis of BRICs with regard to their
industries, according to the Tradition of Industrial Organization; it also includes the financial perspec-tive previously unavailable in strategy studies, using financial indices widely accepted.
This study also suggests that, in the BRIC countries, industry creates differences in corporate performance, as previously shown in other countries by Schmalensee (1985), Rumelt (1991), McGahan and Porter (1997), Brito and Vasconcelos ( 2003) and Victer and McGahan (2006), among others.
The analysis of price-earnings index found that Bra-zil and China tend to suffer a slowdown in the increase of market-perceived value for each incremental unit of profit, which suggests the development and maturation of these markets.
The combined results of value and risk-return indi-ces suggest that both Brazil and Russia are improving their attractiveness for investment, while India remains attractive with relatively stable results, and China, despite having attractive sectors, shows signs of de-creased potential and a slowdown in value generation.
Results also suggest differences among the BRICs regarding the correlation of indices, which can be at-tributed to different investor readings according to the place of investment, perhaps due to structural, economic and legislative factors that differ between countries, as suggested by Shleifer and Vishny (1997). Therefore, value and profitability indices would differ as to their correlation and intensity of effect on inves-tors’ perception of profitability, according to place of investment, as argued from other perspectives by Slovic (1972), Avramov (2004), Fama and French (1992) and Mohanram (2005), among others.
In summary, the evidence suggests that strategic barriers differ not only between sectors, as the Theory of Industrial Organization classically proposes, but they also seem to differ between countries for some sec-tors, as suggested by the results of this study and by Victer and McGahan (2006) and Shleifer and [Robert] Vishny (1997).
The temporal analysis suggest that the BRIC coun-tries with highest increase tendency (improvement) for risk-return in the short-term are Brazil and Russia; India tends to remain stable, while China, by contrast, tends to reduce its ROE risk-return as a place for in-vestment. These results reinforce those of Fama and French (1992), Mohanram (2005) and Goldszmidt, Brito e Vasconcelos (2007).
Further research can also examine the regulatory, statutory and legislative framework of sectors in
dif-Ranking of ROE Risk-return according to value and tendency for the BRICs
Country Industry
ROE Risk-Return
Russia Oil & Gas 3.192
Brazil Mining 1.924
India Mining 1.693
India Oil & Gas 1.692
China Mining 1.526
India Energy 1.525
India Engines, Machinery & Tools 1.420
Russia Metallurgy & Steelmaking 1.184
Russia Mining 1.160
India Transport & Logistics 1.105
India Paper & Cellulose 1.033
India Health 0.805
Russia Telecommunication 0.662
India Construction, Engineering & Real Estate 0.659
India Retail 0.571
India Textiles 0.562
Brazil Construction, Engineering & Real Estate 0.493
Russia Foods 0.459
India Chemical 0.443
Brazil Oil & Gas 0.148
India Telecommunication 0.016
ferent emerging countries, in order to provide a bet-ter presentation of deadlines, costs, procedures and risks of opening and maintaining business in these countries.
REFERENCES
ANDERSON, D; SWEENEY, D; WILLIAMS, T. Estatística aplicada à administração e economia. 2. ed. São Paulo: Cengage Learning, 2008.
AVRAMOV, D. Stock return predictability and asset pri-cing models. The Review of Financial Studies, v. 17, n. 3, p. 699-738, 2004.
BANDEIRA-DE-MELLO, R; R. MARCON. Avaliação da eficá-cia das estratégias de posicionamento e do nível de atrati-vidade setorial, do ponto de vista do acionista. Revista de Administração Contemporânea, v. 8, n. 2, p. 27-49, 2004.
BARNEY, J. Strategic factor markets: expectations, luck and business strategy. Management Science, v. 32, n. 10, p. 1231-1241, 1986.
BASU, S. Investment performance of common stocks in relation to their price-earnings ratios: a test of the efficient market hypothesis. The Journal of Finance, v. 32, n. 3, p. 663-682, 1977.
BLACK, F. Capital market equilibrium with restricted bor-rowing. Journal of Business. v. 45, n. 3, p. 444-454, 1972.
BODIE, Z.; KANE, A.; MARCUS, A. J. Investments. 8. ed. Nova York: McGraw-Hill Irwin, 2008.
BOWMAN, E. H; HELFAT, C. E. Does corporate strategy mat-ter? Strategic Management Journal, v. 22, n. 1, p. 1-23, 2001.
BRITO, L. A. L; VASCONCELOS, F. C. How much does coun-try matter? In: ENCONTRO DA ASSOCIAÇÃO NACIONAL DOS PROGRAMAS DE PÓS-GRADUAÇÃO EM ADMINIS-TRAÇÃO, 27., 2003, Atibaia. Anais. Atibaia: ANPAD, 2003. 1 CD-ROM.
BRUSH, T. H; BROMILEY, P; HENDRICKX, M. The relative influence of industry and corporation on business segment performance: an alternative estimate. Strategic Management Journal, v. 20, n. 6, p. 519-547, 1999.
CAMPBELL, J; VOULTEENAHO, T. Bad beta, good beta. The American Economic Review, v. 94, n. 5, p. 1249-1275, 2004.
CHAN, L; LAKONISHOK, J. Values and growth investing: review and update. Financial Analysts Journal, v. 60, n. 1, p. 71-86, 2004.
CHARI, A; HENRY, P. Risk sharing and asset prices: evi-dence from a natural experiment. The Journal of Finance, v. 59, n. 3, p. 1295-1324, 2004.
CHENG, Z; DONG, M. Stock valuation and investment strategies. Chicago: Yale International Center for Finance Press, 2001. Disponível em: http://papers.ssrn.com/abs-tract=277008. Acesso em 12.02.2009.
CHUNG, K; PRUITT, S. A simple approximation of Tobin’s Q. Financial Management, v. 23, n. 3, p. 70-74, 1994.
CONNER, K. R. A Historical comparison of resource ba-sed-theory and five schools of thought within industrial organization economics: do we have a new theory of the firm? Journal of Management, v. 17, n. 1, p. 121-154, 1991.
CRAGG, J; MALKIEL, M. Expectations and the structure of share prices. Chicago: University of Chicago Press, 1982.
DIERICKX, I; K. COOL. Asset stock accumulation and sus-tainability of competitive advantage. Management Science, v. 35, n. 12, p. 1504-1513, 1989.
DORNBUSCH, R; FISCHER, S; STARTZ, R. Macroeconomia. 8. ed. Rio de Janeiro: McGraw-Hill, 2003.
FAMA, E; FRENCH, K. The capital asset pricing model: the-ory and evidence. The Journal of Economic Perspectives, v. 18, n. 3, p. 25-46, 2004.
FAMA, E; FRENCH, K. The cross-section of expected sto-ck returns. The Journal of Finance, v. 47, n. 2, p. 427-465, 1992.
FAMA, E; FRENCH, K. Value versus growth: the interna-tional evidence. The Journal of Finance, v. 53, n. 6, p. 1975-1999, 1998.
FUNDO MONETÁRIO INTERNACIONAL (FMI). World Eco-nomic Overview: a survey by the staff of the Fundo Mone-tário Internacional. Washington, abr. 2009. Disponível em: <http://www.imf.org /external/pubs/ft/weo/2009/01/pdf/ text.pdf>. Acesso em: 12 jan. 2010.
GHEMAWAT, P. Competition and business strategy in his-torical perspective. Business History Review, v.76, n.1, p.37-74, 2002.
GOLDSZMIDT, R. G. B; BRITO, L. A. L; VASCONCELOS, F. C. O efeito país sobre o desempenho da firma: uma abordagem multinível. RAE- Revista de Administração de Empresas, v. 47, n. 4, p. 12-25, 2007.
HAYASHI, F. Tobin’s marginal Q and average Q. Econome-trica, v. 50, n. 1, p. 213-224, 1982.
LAKONISHOK, J; SCHLEIFER, A; VISHNY, R. Contrarian in-vestment, extrapolation and risk. The Journal of Finance, v. 44, n. 5, p. 1541-1578, 1994.
LINDENBERG, E; ROSS, S. Tobin’s Q ratio and industrial organization. Journal of Business, v. 54, n. 1, p. 1-33, 1981.
LINTNER, J. The valuation of risk assets and the selection of risky investments in stock portfolios and capital
bud-gets. Review of Economics and Statistics. v. 47, n. 1, p.
13-37, 1965.
MAENHOUT, P. Robust porfolio rules and asset pricing. The Review of Financial Studies, v.17, n.4, inverno, 2004.
MALAGA, F. K; SECURATO, J. R. Aplicação do modelo de três fatores de Fama e French no mercado acionário brasileiro: um estudo empírico do período 1995-2003. XVIII Encontro da Anpad. Anais. Curitiba: Enanpad, 2004.
MARKOWITZ, H. Portfolio selection. The Journal of Finan-ce. v. 7, n. 1, p. 77-99, 1952.
MCGAHAN, A. M; PORTER, M. E. How much does indus-try matter, really? Strategic Management Journal, v. 18, n. 1, p. 15-30, 1997.
MCNAMARA, G.; VAALER, P. M.; DEVERS, C. Same as it ever was: the search for evidence on increasing hyper-competition. Strategic Management Journal, v. 24, n.3, p.261-278, 2003.
MERTON, R. C. An intertemporal capital asset pricing mo-del. Econometrica, v. 41, n. 5, p. 867-887, 1973.
MOHANRAM, P. S. Separating winners from losers among low book-to-market stocks using financial statement
analy-sis. Review of Accounting Studies, v. 10, n. 2-3, p.
133-170, 2005.
NOGUEIRA, I; LAMOUNIER, W; COLAUTO, R. Q de Tobin e medidas financeiras tradicionais em companhias siderúr-gicas brasileiras e americanas com ações na BOVESPA e na NYSE. In: 7º Congresso USP de Controladoria e Conta-bilidade, 2007, São Paulo. Anais. São Paulo: 7º Congresso USP de Controladoria e Contabilidade, v. 1, p. 1-15, 2007.
NOKIA to cut production as phone markets dive. Thom-son Reuters, Nova York, 11 fev. 2009. Disponível em: <http://www.reuters.com/article/technologyNews/idUS-TRE51A1Y620090 211>. Acesso em: 23 mar. 2009.
PEROLD, A. The capital asset price model. The Journal of Economic Perspectives, v. 18, n. 3, p. 3-24, 2004.
PORTER, M. E. The contributions of industrial organization to strategic management. Academy of Management Review, v.6, n.4, p.609-620. 1981.
PORTER, M. E. What is strategy? Harvard Business Review, nov./dez., p.61-78. 1996.
PORTER, M. E. How competitive forces shape strategy. Harvard Business Review, v.57, n.2, p.137. 1979a.
PORTER, M. E. The structure within industries and compa-nies’ performance. The Review of Economics and Statistics, v. 61, n.2, 1979, p. 214-227. 1979b.
RAKHMAYIL, S. Essays on asset pricing: linking macroeco-nomic factors to expected returns. Tese de Doutorado, Fa-culty of Graduate Studies, The University of Manitoba, 2005.
ROSS, S. A. The arbitrage theory of capital asset pricing. Journal of Economic Theory, v. 13, n. 3, p. 341-360, 1976.
RUMELT, R. How much does industry matter? Strategic Ma-nagement Journal, v. 12, n. 3, p. 167-190, 1991.
2000. Disponível em: <http://ssrn.com/abstract=262014>. Acesso em: 12 fev. 2009.
SCHMALENSEE, R. Do markets differ much? American Eco-nomic Review, v. 75, n. 3, p. 341-251, 1985.
SHALIT, H. An asset allocation puzzle: comment. The Ame-rican Economic Review, v. 93, n. 3, p. 1002-1008, 2003.
SHARPE, W. F. Capital asset prices: a theory of market equilibrium under conditions of risk. Journal of Finance, v. 19, n. 3, p. 425-442, 1964.
SHLEIFER, A; VISHNY, R. W. A survey of corporate gover-nance. The Journal of Finance, v. 52, n. 2, p. 737-783, 1997.
SLOVIC, P. Psychological study of human judgment: im-plications for investment decision making. The Journal of Finance, v. 27, n. 4, p. 779-799, 1972.
STANDARD & POOR’S. Research Insight COMPUSTAT (Glo-bal). Englewood, CO: The McGraw-Hill Companies, Inc., 2009. 1 CD-ROM.
TOBIN, J. A general equilibrium approach to monetary theory. Journal of Money, Credit and Banking, v. 1, n. 1, p. 15-29, 1969.
VICTER, R; MCGAHAN, A. The effect of industry and lo-cation on firm profitability in the global market: empirical evidence that firm performance depends on the interaction between industry affiliation and country identity. In: DRUID SUMMER CONFERENCE, 2006. Proceedings. Druid, 2006.