109 Rev. Bras. Pesq. Tur. São Paulo, 11(1), pp. 109-132, jan./abr. 2017.
Determinant attributes in the purchase decision: a study on
street food establishments
Atributos Determinantes na Decisão de Compra e Satisfação dos
Clientes: Um Estudo em Estabelecimentos que Comercializam
Comida de Rua
Atributos determinantes de decisiones en la compra y la satisfacción
del cliente: un estudio en los establecimientos que comercializan
alimento en la calle
Hannah Nicchio Loriato1
Anderson Soncini Pelissari2
Abstract: The importance of the attributes of a product can vary greatly according to the different consumers, thus we start from the idea that there are different degrees of importance in relation to the attributes and that this importance influences the buying decision. The purpose of this study is to identify which attributes are key in the buying decision-making process for consumers in making buying decisions in establishments that sell street food. It is a study of both qualitative and quantitative nature. In the qualitative phase we conducted semi-struc-tured interviews with 16 customers and we analyzed them using content analysis. Also, we carried out a survey, applying 200 questionnaires, to survey data for the quantitative phase. The analysis of this quantitative phase was carried out using Excel and SPSS, with the use of multivariate statistical techniques. The results indicated that the service offered is the key construct to the customers' buying decision. In addition, this study may be extended to other national contexts and may assist street food entrepreneurs to come up with strategies in order to maintain themselves firmly in the market.
Keywords: Importance of the attribute. Determinant attribute. Buying decision. Satisfaction. Street food.
1 Federal University of Espírito Santo (UFES), Brasília, DF, Brazil. Conception and design of the scientific work, formulation of ideas, data collection, data analysis, preparation of the scientific paper.
2 Federal University of Espírito Santo (UFES), Brasília, DF, Brazil. Analysis and adjustment of the design of the scientific work, analysis and adjustment of formulation of ideas, analysis and adjustment for data collection, adjustment and adequacy of data analysis, analysis, adjustment and adequacy of the scientific paper.
110 Rev. Bras. Pesq. Tur. São Paulo, 11(1), pp. 109-132, jan./abr. 2017.
Resumo: Os atributos de um produto podem variar substancialmente na importância que eles têm para diferen-tes consumidores, assim a partir da concepção de que há diferendiferen-tes graus de importância em relação aos atri-butos e que essa importância influência na decisão de compra. Este artigo tem como objetivo identificar quais atributos são determinantes para os consumidores na tomada de decisão de compra em estabelecimentos que comercializam comida de rua. Trata-se de um estudo de natureza qualitativa e quantitativa. Na fase qualitativa foi realizada uma entrevista semiestruturada com 16 clientes e analisada por meio da análise de conteúdo. Para o levantamento dos dados na fase quantitativa foi realizado um survey, com a aplicação de 200 questionários. A análise desta fase quantitativa foi realizada com a utilização do Excel e do SPSS, com emprego de técnicas de estatística multivariada. Os resultados indicaram que o serviço oferecido é o constructo considerado determi-nante para a decisão de compra dos clientes. Esta pesquisa propicia a ampliação desse escopo de pesquisas no país, bem como contribui para os empreendedores no setor de street food que buscam estratégias para se man-terem firmes no mercado.
Palavras-chave: Importância do Atributo. Atributo Determinante. Decisão de Compra. Satisfação. Comida de Rua.
Resumen: Los atributos de un producto pueden variar mucho en la importancia que tienen para diferentes consumidores, y de la idea de que hay diferentes grados de importancia en relación con los atributos y la importancia que influyen en la decisión de compra. Este artículo tiene como objetivo identificar los atributos que son cruciales para los consumidores en el tomado de decisión de compra en establecimientos que venden comida en la calle. Se trata de un estudio de naturaleza cualitativa y cuantitativa. En la fase cualitativa fue realizada una entrevista semiestructurada con 16 clientes y analizados por meio del análisis de contenido. Para el estudio de los datos en la fase cuantitativa fue realizada una encuesta, mediante la aplicación de 200 cuestionarios. El análisis desta fase fue realizada con el uso de Excel y SPSS, con el uso de técnicas estadísticas multivariantes. Los resultados indicaron que el servicio prestado és el constructo considerado determinante en la decisión de compra de los clientes. Esta investigación propicia el aumento de este ámbito de investigación en el país, así como contribuye a los emprendedores en el campo de la comida en la calle buscando estrategias para permanecer firme en el mercado.
Palavras clave: Importancia del atributo. Atributo determinante. Decisión de Compra. Satisfacción. Comida en la calle.
1 INTRODUCTION
Consumption permeates the lives of everyone in society (Peter & Olson, 2009). "Being a consumer is to be human "(Karsaklian, 2004, p. 13). In this scenario, the importance of consumers and customers is indisputable, since companies, in the midst of competition, seek to diversify the way they offer the products and services that consum-ers need in order to make them loyal (Peter & Olson, 2009).
Peter and Olson (2009) posit that the con-sumer is dynamic as well as the environment in which they are immersed and where
changes are permanent. Such
transformations have affected, among others, the food sector (Lima Filho et al., 2004).
110 Rev. Bras. Pesq. Tur. São Paulo, 11(1), pp. 109-132, jan./abr. 2017.
Street food appears, in this context, as a financially viable option by offering diverse and ready food for immediate consumption, meeting the growing demand for conven-ience food (Cardoso, Santos & Silva, 2009). This type of development has become com-mon in Brazilian cities and also abroad (Car-doso, Santos & Silva, 2009). Globally, around 2.5 billion people eat street food daily (FAO, 2011).
Pigatto and Nishimura (2012) claim that street food vendors operate in an ex-tremely competitive market, due to the fact that food service has a large variety of offer, in addition there are no barriers to entry, it does not require high initial investment and offers short-term financial return (WHO, 1996; FAO, 2011). In this context, a key factor for advantage, to adapt to new require-ments, to ensure the survival and longevity in the market is to assess which attributes pre-sent in products or services generate cus-tomer satisfaction (Pelissari et al., 2011; Ma-chado, Queiroz & Martins, 2006).
Within this setting, the following issue arises: what are the determinant attributes in the buying decision making process, in a square in Vitória/ES which has street food market? In order to answer this question we lassified the att i utes a o di g to Alpe t s (1971) proposal and developed a scale of measurement of the attributes in the context of street food.
Thus, the theoretical hypothesis to be tested in this study was: H: there is a differ-ence in degree of importance attributed by customers, to attributes. When testing this hypothesis, it is possible to sort the attributes in their degree of importance, according to
Alpe t s 97 typology, hi h is o e of the goals to be achieved in this research.
The results of this study contribute to extend the scope of street food research na-tionwide, and also it is relevant for entrepneurs to establish strategies to allocate its re-sources assertively, improve the market posi-tioning, obtain better financial results, attract new customers and keep them satisfied.
2 THEORETICAL FRAMEWORK
2.1 The importance of the attributes in the buying decision
Attentive to the needs of consumers, the modern businessman shows a growing in-terest in the decision-making process re-search, in order to understand how consum-ers make buying decisions in a competitive environment (Bandara, 2014).
Vieira and Slongo (2008) say that every object of consumption can be envis-aged by the consumer as a set of attributes that influence at the time of purchase. There-fore, knowing the attributes and their values is considered an important aspect, responsi-ble for purchasing decisions (Vieira & Slongo, 2008), since it is common for consumers to define a product according to its attributes and, from the perception, they make buying decisions (De Moura, Nogueira & Gouvêa, 2012).
111 Rev. Bras. Pesq. Tur. São Paulo, 11(1), pp. 109-132, jan./abr. 2017.
(2007) highlight the choice based on attrib-utes such as one of the ways to assess the al-ternatives to make a purchase.
In this context, there is a consensus in the literature in which authors (Alpert, 1971; Mowen & Minor, 2003; Engel, Blackwell & Miniard, 2005; Zeithaml, 1988; Taplin, 2012) consider that the attributes differ considera-bly in importance that they have for consum-ers, i.e., the importance of the attributes of a product can vary considerably from one con-sumer to another, according to the specific characteristics of each individual (Engel, Blackwell & Miniard, 2005). Alpert (1971), from the conception that there are different degrees of importance in relation to the at-tributes, and that this importance influences the purchasing decisions, we propose the fol-lowing classification of attributes:
• Salient Attributes: are the attributes that consumers can perceive in a given product, brand, company or in-stitution, but do not determine the
buying process (Alpert, 1971).
McMillan and McGrath (1996) explain that these attributes will only influ-ence directly the purchase as a tie-breaker, i.e., if all the other product features are equivalent.
• Important Attributes: are those perceived by a certain group of consumers as important at the time of purchase, but which not determine it (Alpert, 1971). These are aspects that are not able to determine the choice of purchase and therefore does not influence or add value by the fact of being present in a similar category of products (Alpert, 1971). Thus, many do not consider the important
attributes because these are present in all products of a given class (Alpert, 1971).
• Determinant Attributes: for Alpert (1971) they are of great importance to the consumer, influencing the buying decision. Thus, these are perceived as
the best option to maximize
satisfaction and achieve the desired values by the consumer. Effectively, they are able to direct the choice. The determinant attributes present them-selves for the consumer as the best
possibility to answer to the
satisfaction of their desires in a specific product or brand (Alpert, 1971).
This esea h is ased o Alpe t s
(1971) classification of the different degrees of importance of the attributes, highlighting in particular the determinant attributes iden-tified in the marketing of street food.
The next topic focuses on present as-pects related to food outside the home, which consists of a habit present in the daily life of individuals, in which a range of ven-tures in this attractive market, as is the case of street foods.
2.2Street Food: An alternative to food out-side the home
112 Rev. Bras. Pesq. Tur. São Paulo, 11(1), pp. 109-132, jan./abr. 2017.
people s li es, hi h o se ue tly i gs about changes in the habits of people and groups, including with regard to food. In this context, people search food services outside the home, because they satisfy their food needs in the time they have available (Fanti-nel, Teixeira & Ghizzo, 2011; Diez Garcia, 1999, Lambert et al., 2005, Balogun, Souza & Pereira, 2013; Schlindwein & Silva, 2010).
Consumption of food outside the home is increasingly common in everyday life, happening frequently. It is a worldwide phenomenon, either in developed countries or in developing countries (Bezerra, Souza & Pereira, 2013; Fantinel, Teixeira & Ghizzo, 2011; Edwards, Hartwell & Brown, 2013; Nordström & Thunström, 2015). The trend is that new food niches outside the home keep popping up (Liu, Kasteridis & Yen, 2013; Mauro, 2013).
An example of the new trends in food out of the household is the emergence of a new segment originating from the street food sector, the so-called food trucks, which consist of small trucks or vans that specialize in serving different kinds of food; they are practically mobile restaurants (Piza, 2014). In São Paulo this market segment has strengthened, especially after the regulation of the activity, with the approval of the bill regulating street food vending in the city (Simon, 2013). Street food is becoming an option that supports the development of the habit of eating out (Castro, 2008), comprising a viable alternative for a large part of the population (Santos et al., 2012; Cardoso, Santos & Silva, 2009)
Studies conducted by the American Institute IBISWorld (2014) point out that street food vendors are in a growth phase.
They were able to avoid recession and offer new products capable of attracting a more di-verse clientele (IBISWorld, 2014). The food is varied and attractive for tourists, with many options of local cuisine, appreciated for its flavor (WHO, 1996; Rane, 2011; Newman & Burnet, 2013; Pigatto & Nishimura, 2012; Samapundo et al., 2015). Also, it is an im-portant source of income, as it provides live-lihood for a large number of workers, in par-ticular in developing countries (Santos, 2011).
This type of food is part of everyday life, present in places near the commercial ar-eas (Cardoso, Santos & Silva, 2009), as well as industrial facilities and squares (Muyanja et al., 2011). Normally these are lively places, with immediate and numerous clientele (Muyanja et al., 2011).
3 METHODOLOGY
Aiming to unveil the determinant at-tributes to consumers in the buying decision in street food establishments, this study ana-lyzed the street market in the Praça Regina Frigeri Furno, a square located in the city of Vitoria, ES. The subjects of research are the street food consumers of the establishments in the square.
113 Rev. Bras. Pesq. Tur. São Paulo, 11(1), pp. 109-132, jan./abr. 2017.
installation and operation (BRAZIL, 2003). The square today is a place with great variety of foods with approximately 43 food booths. It works from Wednesday to Friday, from 5:00 pm to 11:00 pm. Fridays are the busiest days, with a large number of people.
To respond to the problem proposed in this study, we developed two research stages: one that uses qualitative exploratory
methods – since it is a little studied subject
and with a lot of gaps to be filled, initially we developed a preliminary study in order to adapt the measuring instrument to the reality of the context - and other that is of a quantitative descriptive nature - aiming to describe certain specific characteristics of the market and relevant groups for this research (Malhotra, 2006), which enables to establish correlations between variables (Vergara, 2011), as follows in the next topic.
3.1 Qualitative Stage: Interviews with the customers
The qualitative stage included individ-ual interviews carried out with customers who consume street food on the analyzed square, with the aim of identifying the deter-minant attributes in the purchase decision. Sixteen interviews were conducted, until reaching saturation point, divided into two different days of operation of establish-ments, June 3 and 12, 2015.
Data was analyzed through content analysis, which consist of "[...] a set of com-munication analysis techniques, using sys-tematic and objective procedures to describe message contents [...]" whose relevance lies in the findings that result from their treat-ment (Bardin, 1977, p. 38).
After this analysis the responses were categorized (Bardin, 1977). The categories identified in the interviews in the qualitative phase, along with the attributes found in the literature, were used to identify and define the attributes to be included in the question-naire survey, used in the quantitative phase of this research.
3.2 Quantitative Stage: Survey
In this stage, the primary data were obtained through the survey technique, i.e., data collection, which according to Hair et al. (2005), is a technique that uses a question-naire to gather information about a popula-tion from a significant sample.
The questionnaire was structured with close-ended questions, using a six-point ordinal scale. Malhotra (2006) explains that the ordinal scale is a graduated scale, in which it is possible to assign numbers to cer-tain items to indicate to what extent a char-acteristic is present in a given thing, and thus it can be determined if an item/object has this characteristic to a greater or lesser de-gree. In this scale the degree of agreement grows if a greater number of points are marked with declarations relating to the atti-tude that is being measured. A central or neu-tral point was not considered in order to avoid the central tendency. The objective was that customers indicated a positive or negative position rather than a neutral atti-tude.
114 Rev. Bras. Pesq. Tur. São Paulo, 11(1), pp. 109-132, jan./abr. 2017.
(1991) argues that a central category can dis-tort the results.
Before the application of the
questionnaire we run a pre-test with 10 subjects to check the clarity of the questionnaire, the scope of the questions, as well as the acceptability of the questions by respondents, and thus making the necessary corrections (Rea & Parker, 2000)
Data collection initiated after the ad-justments and completion of the survey questionnaire. The survey took place in two consecutive weeks, on Wednesdays, Thurs-days and FriThurs-days (operating Thurs-days of the street market), in the month of June 2015 (17, 18, 19, 24 and 26). It is important to note that the dates for data survey was chosen disregard-ing vacation or holidays, because due to these aspects changes could occur in the field of study. Data analysis was performed through Excel on the statistical software tool SPSS (Statistical Package for the Social Sci-ences).
In relation to sampling, Malhotra (2006) states that the size considered ideal to ensure a robust research to estimate market trends should be of 200 samples. Another
way of defining the sample is using the for-mula for interval estimation of a population mean based on Anderson, Sweeney and Wil-liams (2002). For this calculation it is neces-sary to determine the confidence interval, the sampling error and standard deviation of the population. To set the size of the sample of this research, the confidence interval con-sidered was 99 percent with a critical value Z equal to 2.57 and an error of 0.226.
Anderson, Sweeney and Williams (2002) explain that, when the population standard deviation is not known, one alterna-tive is to adopt the standard deviation found from a pilot study done with a preliminary sample. Thus, the sample standard deviation used for the calculation of the sample was obtained from a study conducted by the searcher, prior to the development of this re-search, in the same population studied here. On that occasion 51 samples were used, in which the value of the standard deviation ob-tained was equal to 1.240809. Thus reaching the 200 samples needed (n = 200), according to the formula below.
(�. � � ��� � )2= � �� ͢ ( , . ,, )2= ��, �
The sampling was probabilistic, in which each element of the population has the same chance of being included in the sample, allowing for better representation of the population (Malhotra, 2006). The system-atic technique was used, i.e. each interviewer started from a given point. From that point the first table was chosen at random and, in the sequence, each two tables occupied, one
110 Rev. Bras. Pesq. Tur. São Paulo, 11(1), pp. 109-132, jan./abr. 2017.
4 ANALYSIS AND DISCUSSION OF DATA
This section presents the data col-lected from the customers who consume street food in the Jardim da Penha square.
4.1 Analysis of the Qualitative Stage
In this step, we tried to identify which attributes are considered most important by consumers when buying street food, in order to gather data to structure the questionnaire with the attributes inherent to street food consumption. The data generated from these interviews were studied through content analysis, which resulted in a list of attributes and their respective categories.
Bardin (1996) explains that to per-form a content analysis it is necessary to de-velop three steps: pre-analysis, exploration of the material and treatment of the results (inference). In pre-analysis we read and se-lected the materials to be evaluated: the studies that used scales related to food con-sumption in various types of restaurants and the interviews. Thus, the analysis of content included two corpora: the material obtained in the literature review and from the semi-structured interviews carried out with cus-tomers who consume street food, generating a list of attributes.
The exploration stage is the moment of encoding, wherein the attributes that have the same meaning were aggregated. Later, each of these coded groups was named ac-cording to its meaning. To define those who would be used in the study, it was considered the number of appearances, i.e., the fre-quency, as well as the adequacy to the topic and object of study. Finally, the categories
were defined. To create the categories of this study, we used the semantic criterion, i.e. the themes that are semantically linked to a cat-egory, defined by the author, are grouped to-gether (Bardin, 1996).
A total of eighteen (18) attributes were defined, divided into five (5) categories, as shown in Table 4. After the conclusion of the content analysis we structured the ques-tionnaire survey, the data collection instru-ment, used in the quantitative stage of this work.
4.2 Analysis of the Quantitative Stage
Data collection was carried out through a questionnaire-type survey in the quantitative stage. After its implementation, the data were properly prepared and aligned in a format suitable for analysis, as indication of Malhotra (2006) and Hair et al., (2005). Following, we present the results.
4.2.1 Profile
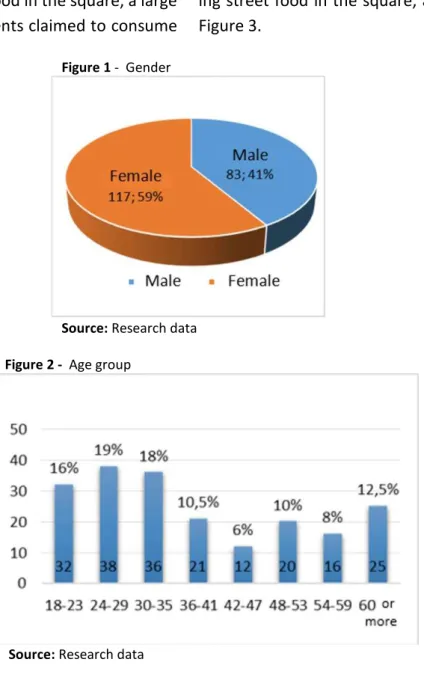
We sought to identify the clients who consume street food in Jardim da Penha Square. Specifically, information regarding gender, the frequency of purchase of street food in the square, age group, place of resi-dence, and household income of the re-spondents.
111 Rev. Bras. Pesq. Tur. São Paulo, 11(1), pp. 109-132, jan./abr. 2017.
those with the highest representation in food consumption, in Jardim da Penha Square.
When asked about the frequency of purchase of street food in the square, a large number of respondents claimed to consume
it every week (41.5 percent). Thus, from these results we can say that the majority of respondents have the habit of regularly buy-ing street food in the square, as depicted in Figure 3.
Figure 1 - Gender
Source: Research data
Figure 2 - Age group
Source: Research data
Figure 3 - Frequency of purchase
110 Rev. Bras. Pesq. Tur. São Paulo, 11(1), pp. 109-132, jan./abr. 2017.
To identify the social class of respond-ents, we asked about the household income, i.e. the combine incomes of all people living at home. The income ranges used in this work were based on the criteria of economic clas-sification of ABEP (Brazilian Marketing Re-search Association), in which the strata of Brazil Criteria represent the average monthly income for the economic strata. This stratify-
cation is not based on the value of the current minimum wage. As of January 2015, income strata adopted are described in Figure 4. It is important to note that, in order to facilitate the application of the questionnaire and sim-plify the reading of the numbers, the digits that represent the cents have been rounded up.
Figure 4 - Household income
Source: Research data
By analyzing Figure 4, it can be no-ticed that most of the people who partici-pated in this study belong to the economic groups B1 (32 percent) and B2 (32 percent). Thus, we can affirm that consumers of Jardim
da Penha Square are mostly people from middle and upper middle classes. This result does ot suppo t FAO s epo t , hi h states that most people who consume street food have low purchasing power.
Figure 5 - Place of residence
Source: Research data
109 Rev. Bras. Pesq. Tur. São Paulo, 11(1), pp. 109-132, jan./abr. 2017.
In relation to the place of residence, 126 people (63 percent) stated that they live in the region of the Jardim da Penha, as shown in Figure 5. This figure clearly indicates that the square is frequented mostly by peo-ple from the neighborhood.
4.2.2 Importance of the Attributes in the Purchase Decision
In the second part of the question-naire, customers were questioned on the im-portance of attributes in the purchase deci-sion when buying street food, since that in the process leading up to the purchase, as ex-pressed by Blackwell, Miniard and Engel (2005), consumers evaluate the different possibilities available to make their purchas-ing decision, in order to best satisfy their de-mands.
However, because this is an explora-tory study, we developed a scale to measure the importance of these attributes, which made necessary the use of exploratory factor analysis (EFA). According to Brown (2006) EFA is generally conducted when the re-searcher does not have an underlying theory or sufficient empirical evidence which clearly indicates how items of a given instrument must be grouped and evaluated.
4.2.2.1Exploratory Factor Analysis (EFA) of the Importance of the Attributes
Considering that the attributes identi- fied in the qualitative stage formed an 18-items scale, it was relevant to verify the dis-tribution of these data. To this end, we used the statistical procedure of exploratory factor
analysis (EFA). Factor analysis helps in the ev-idences relating to the validity of question-naires, commonly used in research (Hair et al., 2005).
The EFA was held separately in each of the dimensions (categories) in order to as-sist in the evaluation of the distribution of at-tributes in the dimensions, thus the distribu-tion and organizadistribu-tion of the scale reflected
the theory of core attributes and EFA.
The analytical technique employed was the exploratory perspective as it is "[...] useful in searching for structure among a set of variables or as a data reduction method [...]" (Hair et al., 2005, p. 92). Normally the exploratory factor analysis (EFA) is used in in-itial research with the purpose of exploring the data.
For the development of this analysis we used oblique rotation, identifying the cor-relation degree of each factor (Hair et al., 2005). Factor rotation was performed aiming factor adjustment in search of simple and more significant solutions, to improve the in-terpretation and reduce the ambiguity (Hair et al., 2005). The factor analysis was per-formed using SPSS Software. Next we present the criteria and results of the EFA.
4.2.2.2Exploratory Factor Analysis Results
110 Rev. Bras. Pesq. Tur. São Paulo, 11(1), pp. 109-132, jan./abr. 2017.
(p < 0.05). As depicted in Table 1, all values are within the limits indicated.
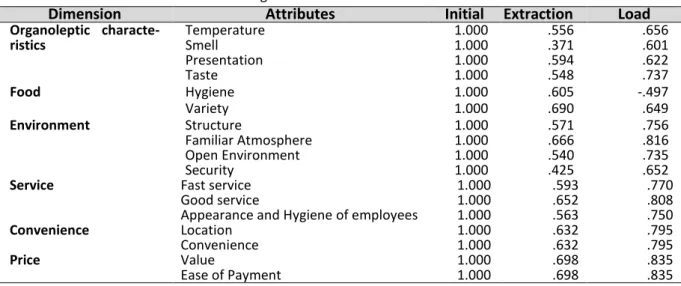
The number of factors to be extracted was determined by the latent root criterion, in which the eigenvalues greater than 1 should be retained, always trying to reach the recommended minimum of 60 percent of ac-cumulated variance, indicated by Hair et al. (2005). To perform this procedure, the attrib-utes of the dimension "food" were distrib-uted in three components to a higher cumu-lative variance. However the variable "healthy food" would form a single construct. This gave rise to a theoretical reflec- tion on this variable. Despite the studies by
Liu and Jang (2009); Harrington, Ottenbacher and Way (2011) and Castelo Branco (2000) that highlighted only the variable healthy food, other authors such as Steptoe, Pollard and Wardle (1995) and Yuksel and Yukesel (2002) provide evidence that the variable "healthy food" can be composed of other fac-tors, considering, for example, the caloric content of food and the amount of vitamins, nutrients, proteins and fat. Thus, it appears that this variable is not complete in the way it was measured, so we decided to remove this variable. Two components were then formed and renamed as shown in Table 1.
Table 1 - Data from Exploratory Factor Analysis
Dimension KMO
and Bartlett
Cumulative Variance
Description of the components Excluded
Variable
Food .753 .000
56.055 Component 1: Presentation, taste, smell and tem-perature. This component was called organoleptic characteristics of food.
Component 2: Variety and Hygiene. This compo-nent remained in Food category since it is related to food non-organoleptic characteristics.
Healthy Food
Environment .742 .000
55.036 Structure, Familiar Atmosphere, Open Environ-ment, Security
---
Service .655 .000
60.282 Fast service, Good Service, Appearance and per-sonal Hygiene of employees
---
Convenience .500 .000
63.203 Location, Convenience
---Price .500 .000
69.772 Ease of Payment and Value
---Source: Research data from SPSS
After the EFA, the remaining dimen-sions remained with the same structure of the scale originally used, as depicted in Table 2.
The communalities represent the to-tal amount of variance that an original varia-ble shares with all other included in the anal-ysis. Hair et al. (2005) suggest that the ac-ceptable levels of communality must be
110 Rev. Bras. Pesq. Tur. São Paulo, 11(1), pp. 109-132, jan./abr. 2017.
Table 2 - Communalities and Factor Loading
Dimension Attributes Initial Extraction Load
Organoleptic characte-ristics
Temperature 1.000 .556 .656
Smell 1.000 .371 .601
Presentation 1.000 .594 .622
Taste 1.000 .548 .737
Food Hygiene 1.000 .605 -.497
Variety 1.000 .690 .649
Environment Structure 1.000 .571 .756
Familiar Atmosphere 1.000 .666 .816
Open Environment 1.000 .540 .735
Security 1.000 .425 .652
Service Fast service 1.000 .593 .770
Good service 1.000 .652 .808
Appearance and Hygiene of employees 1.000 .563 .750
Convenience Location 1.000 .632 .795
Convenience 1.000 .632 .795
Price Value 1.000 .698 .835
Ease of Payment 1.000 .698 .835
Source: Research data from SPSS
The values of factor loadings of the components are shown in Table 2. Hair et al. (2005) explain that factor loading is the cor-relation between the variable and the factor. It represents the acceptable limit of contribu-tion of the variable to the factor in order to avoid the problem of the indeterminacy of the relationship between variables and fac-tors. For statistical significance of a sample of 200, as in the case of this study, the loads must be equal or greater than 0.4 (Hair et al., 2005).
Reliability was tested with Cronbach's Alpha coefficient, which constitutes one of
the most widely adopted procedures to as-sess the reliability of a scale (Malhotra, 2001). According to Hair et al. (2005), the acceptable values of Cronbach's alpha should vary be-tween 0.6 and 0.9.
The value of Cronbach's alpha is influ-enced both by the value of the correlations of the items, and the number of items. Thus, factors with few items tend to have smaller Cronbach's alpha (Cortina, 1993). The con-structs "convenience" and "price" have Cronbach's alpha values (see Table 3) below the acceptable values indicated by the litera-ture.
Table 3 - Reliability statistics
Dimension Food
Environ-ment
Service Conveni-ence
Price
Cronbach’s Alpha .676 .721 .660 .417 .554
Source: Research data from SPSS
From the development of exploratory factor analysis, it was possible to infer some modifications in relation to the attributes and constructs initially used in this research, so
110 Rev. Bras. Pesq. Tur. São Paulo, 11(1), pp. 109-132, jan./abr. 2017.
Table 4 - Results of the exploratory factor analysis
Conceptual scale (before factor analysis) Empirical evaluation of the scale (after factor analy-sis)
Component Variable Component Variable
1. Food
B1.Healthy food B2. Variety B3. Presentation B4. Taste B5. Smell B6. Temperature B7. Hygiene
1.Organoleptic charac-teristics
B1.Healthy Food B2. Presentation B3. Taste B4. Smell B5. Temperature
2.Food B6. Variety B7. Hygiene
2. Environment
B8. Physical Structure B9. Familiar Atmosphere B10. Open Environment B11. Security
3.Environment
B8. Physical Structure B9. Familiar Atmosphere B10. Open Environment B11. Security
3. Service
B12. Fast Service B13. Good Service
B14. Appearance and personal Hygiene of employees
4.Service
B12. Fast Service B13. Good Service
B14. Appearance and personal Hygiene of employees
4. Convenience B15. Location B16. Convenience 5.Convenience B15. Location B16. Convenience
5. Price B17. Value B18. Ease of Payment 6.Price B17. Value B18. Ease of Payment Source: The authors
Factor analysis led to changes in the scale shown in Table 5. This new structure was considered for the analysis of the importance of attributes presented in the next topic.
4.2.2.3 Analysis of the importance of the attributes
The guiding hypothesis of this study is based on the theory of Alpert (1971), which notes that the attributes can have different degrees of importance. To answer the prob-lem of this research, the hypothesis was based on identifying whether there is a differ-ence in degree of importance assigned by the customers to the attributes.
Therefore, we developed hypotheses to test the similarities and differences be-tween the averages, in order to prove or dis-prove the theory of Alpert (1971). The first hypothesis is as follows:
Ha: There is no difference in the degree of im-portance assigned by customers, to attrib-utes.
This test considered a confidence in-terval of 95 percent, with the significance le el α of . 5. A o di g to Le i e et al. (2012), if the p-value falls below the prede-te i ed sig ifi a e le el α = . 5 H is not confirmed, which shows that at least one of the averages is different from the other. When the p-value is above the previously es-ta lished sig ifi a e le el α = . 5 H is not rejected.
110 Rev. Bras. Pesq. Tur. São Paulo, 11(1), pp. 109-132, jan./abr. 2017.
Table 5 - ANOVA of importance
Variation source SQ Gl MQ F P- Value Critical F
Between groups 36.5716666 5 7.314333333 11.7025 4.609E-11 2.22159
Inside groups 746.2775 1194 0.625023032
Total 782.849166 1199
Source: Research data
The analysis the p-value (4.609E-11) showed that it is less than 0.05. In common numbers that scientific notation is equivalent to approximately 0 (zero). This indicates that H0 is rejected, i.e. at least one of the means is different from the others. This information assumes that at least one of the constructs exerts different influence from the others on the buying decision, then there are different degrees of importance, assigned by the cus-tomers to the constructs. In this way, the the-ory of Alpert (1971) is verified as to the exist-ence of differexist-ences in the degree of im-portance assigned by customers to the attrib-utes.
4.2.2.4 Classification of the Attributes
It is also necessary to know which con-structs have different means and put them in
descending order of importance for, if possi-ble, sort them in determinant, important and salient. Only constructs that presented statis-tically equal averages were classified in the same way.
110 Rev. Bras. Pesq. Tur. São Paulo, 11(1), pp. 109-132, jan./abr. 2017.
Table 6 - Tested Hypotheses
Hypothesis: H0 (µ = µ ) P-Value Situation
Haa: There is not a difference of the level of the importance, assigned by customers, between the constructs organoleptic characteristics and food.
0.87149 H0 not rejected, means are not dif-ferent
Hab: There is not a difference of the level of the importance, assigned by customers, between the constructs organoleptic characteristics and envi-ronment.
0.05205 H0 not rejected, means are not dif-ferent
Hac: There is not a difference of the level of the importance, assigned by customers, between the constructs organoleptic characteristics and ser-vice.
0.01180 H0 not confirmed, means are differ-ent
Had: There is not a difference of the level of the importance, assigned by customers, between the constructs organoleptic characteristics and con-venience.
0.00106 H0 not confirmed, means are differ-ent
Hae: There is not a difference of the level of the importance, assigned by customers, between the constructs organoleptic characteristics and price.
1.28E-05 H0 not confirmed, means are differ-ent
Haf: There is not a difference of the level of the importance, assigned by customers, between the constructs food and environment.
0.08847 H0 not rejected, Means are not dif-ferent
Hag: There is not a difference of the level of the importance, assigned by customers, between the constructs food and service.
0.01094 H0 not confirmed, means are differ-ent
Hah: There is not a difference of the level of the importance, assigned by customers, between the constructs food and convenience.
0.00230 H0 not confirmed, means are differ-ent
Hai: There is not a difference of the level of the importance, assigned by customers, between the constructs food and price.
4.14E-05 H0 not confirmed, means are differ-ent
Haj: There is not a difference of the level of the importance, assigned by customers, between the constructs environment and service.
7.35E-05 H0 not confirmed, means are differ-ent
Hak: There is not a difference of the level of the importance, assigned by customers, between the constructs environment and convenience.
0.10985 H0 not rejected, means are not dif-ferent
Hal: There is not a difference of the level of the importance, assigned by customers, between the constructs environment and price.
0.0092 H0 not confirmed, means are differ-ent
Ham: There is not a difference of the level of the importance, assigned by customers, between the constructs service and convenience.
1.05E-06 H0 not confirmed, means are differ-ent
Han: There is not a difference of the level of the importance, assigned by customers, between the constructs service and price.
4.45E-09 H0 not confirmed, means are differ-ent
Hao: There is not a difference of the level of the importance, assigned by customers, between the constructs convenience and price.
0.39113 H0 not rejected, means are not dif-ferent
Source: The authors
To classify the degree of importance, those constructs with averages no different between themselves were considered within
110 Rev. Bras. Pesq. Tur. São Paulo, 11(1), pp. 109-132, jan./abr. 2017.
along with "price", but separated from "envi-ronment", because "price" and "environ-ment" did not presented equal means (see Table 6), which demonstrates the existence of a gray area, depicted in Figure 6. This shows that there may be other possible
forms of classifications. This work followed the theory of Alpert (1971), thus the classifi-cation was limited to a maximum of three al-ternatives, regarding the importance of the constructs. It was obtained the classification shown in Figure 6.
Figure 6 - Classification of the importance of the constructs, with the gray area highlighted
Source: The authors
Responding to the research problem, it can be observed that the determinant con-struct is service. This concon-struct is formed by the attributes: fast service, good service, ap-pearance and personal hygiene of employ-ees. The important constructs are: organo-leptic characteristics, formed by: presenta-tion, taste, smell, temperature. Food, is formed by variety and hygiene. And environ-ment comprised of: physical structure, famil-iar atmosphere, open environment and secu-rity. The salient constructs are convenience, consisting of: convenience and location, and price, formed by value and ease of payment. These results will meet those revealed by Mhlanga, Hattingh and Moolman (2014),
in which these authors showed that the level of service is the main factor considered by customers in the context of restaurants. Ac-cording to the same study, the organoleptic characteristics are essential to provide good food and they were also highlighted as im-portant and come right after service.
Regarding services, Sanches and Salay (2011) reveal that the personal hygiene of the employees is the most important factor when it comes to choosing a restaurant to have meals away from home.
The study of Namkung and Jang (2007) showed that the presentation, taste and temperature (organoleptic characteris-tics) were the most significant for customer Determinant
Service 5,45
Outgoing
Convenience 5,01
Price 4,92
Subtitle Gray Important
Organoleptic characteristics
5,27
Foods 5,26
127 Rev. Bras. Pesq. Tur. São Paulo, 11(1), pp. 109-132, jan./abr. 2017.
satisfaction in restaurants. Similarly Liu and Jang (2009) revealed that the taste of food is essential to influence purchase decisions. The service offered appears next. In the study of Park (2004) the taste of food was also consid-ered the most important, followed by hy-giene and service.
Soriano (2002) obtained similar re-sults, in which the variety and presentation of the food were the most important influence on customers' decisions to return to a restau-rant for another meal. The service was the second most important factor.
Yuksel and Yuksel (2002) revealed that, although important, the environment appears as the last relevant factor influencing the selection and evaluation of restaurants. Similarly, Soriano (2002) obtained that envi-ronment was the least important factor con-sidered in the influence of customers' deci-sions to return to a restaurant.
Harrington, Ottenbacher and Way (2011) showed that price and distance (loca-tion), although important, are not among the first factors in the ranking of importance. The results of Park (2004) and Sanches and Salay (2011) also highlight this fact.
The factor that stands out for being classified in different ways is price. In some studies, like Abdullah, Abdurahman and
Ha-ali , a d Ehsa s , the p i e as regarded as the most important dimension of customer preference in the food sector to se-lect restaurants. In the studies of Siebene-ichle et al. (2007) and Souki (2010), the price and ease of payment appear as the last factor in the order of importance. Thus, although important in the decision to purchase, there are other factors, such as high performance,
that make the consumer less sensitive to price.
The results of this study identified that price is an important variable for the purchasing decision, however it is not the most important. Thus, consistent with the re-sults of Pelissari et al. (2011), in which the au-thors claim that, although the price is an in-fluential variable in purchasing decisions, it is not necessarily determinant for customers. However, it is important to highlight that price acts directly as a factor of competitive-ness. Similarly, Reis (2004) posits that in face of a market in which products and services are becoming more alike, customers give im-portance to other factors besides price.
This study confirms the theory of Grif-fin (1998), in which he states that consumers are becoming more interested in customer service when buying something, representing the service factor in this study. Thus, the im-portance of service surpasses price and prod-uct factors (Griffin, 1998).
5 FINAL CONSIDERATIONS
The objective of this study was to ex-amine a field still little explored, seeking to understand and deepen existing gaps regard-ing the consumption of street food. The gen-eral objective of this research focused on identifying which attributes are determinant fo o su e s uyi g de isio s i esta lish-ments that sell street food, from data collec-tion and analysis in a street market in a square located in the city of Vitória/ES.
128 Rev. Bras. Pesq. Tur. São Paulo, 11(1), pp. 109-132, jan./abr. 2017.
research on the street food sector, with re-gard to the measurement of importance and satisfaction of attributes and constructs.
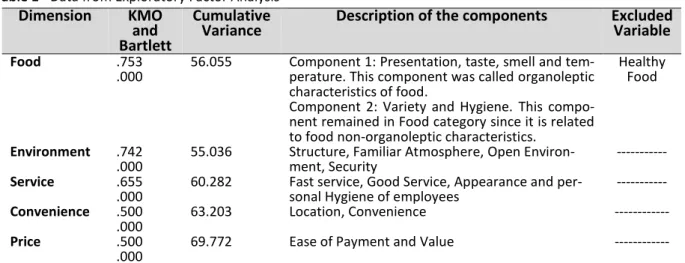
From data obtained in the quantitati-ve stage, it was possible to identify the profile of street food consumers. Most consumers are women (59 percent). The predominant frequency of purchase is weekly (41.5 per-cent) or monthly (23 perper-cent), which indi-cates regularity of street food consumption. The age groups that stand out are: 24 to 29 years (19 percent) and 30 to 35 years (18 per-cent), followed by the seniors, 60 years or more, representing (12.5 percent). Thus, highlighting the attendance at these places of young people, between 24 to 35 years, which represent the largest number of people eat-ing weekly in the square. This is an audience which most represents the economic strata A and B. Most of those going to the street mar-ket, 63 percent, live in Jardim da Penha neighborhood.
These results reflect the profile of the population of this neighborhood. It is a young population in a neighborhood located in front of the campus of the Federal University of Es-pírito Santo (UFES) with brings many young students to this area.
It was possible to test and confirm the hypothesis based on the theory of Alpert (1971), which stated: there is a difference in the degree of importance, assigned by cus-tomers, to attributes. The tests conducted al-lowed to confirm the hypothesis, thus re-sponding to the research problem. It can be affirmed that there are attributes that influ-ence more than others the buying decision and it is possible to sort these attributes as to their degree of importance. "Service" has been identified as the determinant construct.
Its attributes are: fast service, good service, appearance and personal hygiene of employ-ees. These are the aspects to which managers must pay attention in order to continuous im- provement.
To complement, given the other ob-jectives of the research, we have as impo ta t o st u ts: o ga olepti ha a te -istics", with the attributes: presentation, taste, smell and temperature; "food", formed by variety and hygiene; and "environment", formed by physical structure, familiar atmos-phere, open environment, and security. The salient constructs are "convenience", com-posed of location and convenience; and "price", formed by value and ease of pay-ment.
Therefore, the top-ranked attribute ide tified is "se i e , ith a deg ee of i -portance of 5.45 (on a scale of 6). It follows "organoleptic characteristics" (5.27), "food" (5.26), "environment" (5.14), convenience (5.01), and "price" (4.92).
It is concluded that the attention of the man-agers of such enterprises must address ser-vice-related attributes. Muller and Woods (1994) claim that managers must spend con-siderable resources in the attributes identi-fied as those that will satisfy the largest num-ber of potential customers.
129 Rev. Bras. Pesq. Tur. São Paulo, 11(1), pp. 109-132, jan./abr. 2017.
REFERENCES
Abdullah, F., Abdurahman, A. Z. A., & Hamali, J. (2013). The dimensions of customer preference in the foodservice industry. Business: Theory and
Practice/Verslas: Teorija ir Praktika, 14(1), 64-73.
Alpert, M. I. (1971). Identification of determinant attributes: a comparison of methods. Journal of
Marketing Research, 184-191.
Anderson, D. R.; Sweeney, D. J.; Williams, T. A. (2002) Estatística Aplicada à Administração e
Eco-nomia. Ed. Pioneira.
ABRASEL (2014). Gastos com alimentação fora de
casa crescem em Itapetininga, SP. Recuperado em
15 de mar, 2015, de http://www.sp.abra- sel.com.br/noticias/1663-06062014-gastos-com- alimentacao-fora-de-casa-crescem-em-itapeti-ninga-sp.
ABIA (2013) . Indústria brasileira da alimentação:
desafios e oportunidades. Recuperado em 06 de
jan, 2013, de
http://www.abia.org.br/vst/publica-coes.html.
Bardin, L. (1977). Análise de Conteúdo. Lisboa: Edi-ções 70.
Bezerra, I. N., Curioni, C., & Sichieri, R. (2012). Asso-ciation between eating out of home and body weight. Nutrition reviews, 70(2), 65-79.
Bezerra, I. N., & Sichieri, R. (2010). Características e gastos com alimentação fora do domicílio no Bra-sil. Rev Saúde Pública, 44(2), 221-9.
Bezerra, I. N., Souza, A. M. Pereira, R. A., & SichieriI, R. (2013). Consumo de alimentos fora do domicílio no Brasil. Rev Saúde Pública, 47(1Supl), 200S-11S.
Blackwell, R. D.; Miniard, P. W.; Engel, J. F. (2005).
Comportamento do consumidor. São Paulo:
Pio-neira Thomson Learning.
BRASIL. Decreto nº. 11.787, de 27 de novembro de 2003. Regulamenta a Lei nº 5.949, de 16 de julho de 2003, que criou o Programa de Feiras Comunitárias Regionais do Município de Vitória e dá outras provi-dências.
Cardoso, R. D. C. V., Santos, S. M. C. D., & Silva, E. O. (2009). Comida de rua e intervenção: estratégias e propostas para o mundo em desenvolvimento. Cien
Saude Colet, 14(4), 1215-1224.
Castro, O. B. (2008). Uma leitura sobre alimentos seguros em restaurantes populares de Salvador. Es-
critas e narrativas sobre alimentação e cultura, 149-
173.
Cho, K., Park, S., & Joo, N. (2011). Study on a model of street vended food choices by Korean high school students. Nutrition research and practice, 5 (5), 481-488.
Cortina, J. M. (1993). What is coefficient alpha? An examination of theory and applications. Journal of
applied psychology, 78(1), 98.
De Moura, F. A., Nogueira, C. M., & Gouvêa, M. A. (2012). Atributos determinantes na decisão de com-pra de consumidores de alimentos orgânicos.
Agro-alimentaria, 18(35), 75-86.
Edwards, J. S., Hartwell, H. J., & Brown, L. (2013). The relationship between emotions, food consump-tion and meal acceptability when eating out of the home. Food Quality and Preference, 30(1), 22-32.
Ehsan, U. (2012). Factors important for the selec-tion of fast food restaurants: an empirical study across three cities of Pakistan. British Food Journal,
114 (9), 1251-1264.
Fantinel, A. L., Teixeira, J. M. C., & Ghizzo, M. R. (2011). O consumo de restauração fora de casa: uma amostra de indivíduos como parâmetro analí-tico. Revista Percurso, 3(1), 193-205.
FAO (2011). Food and Agriculture Organization.
Dis-ponível em:
<http://www.fao.org/do-crep/014/a1124p/a1124p.pdf>. Acesso em: 10 out. 2014.
Diez Garcia, R. W. (2003). Reflexos da globalização na cultura alimentar: considerações sobre as mu-danças na alimentação urbana. Rev. Nutr, 16(4), 483-492.
Griffin, J. (1998). Como conquistar e manter o
cliente fiel: transforme seus clientes em verdadeiros
130 Rev. Bras. Pesq. Tur. São Paulo, 11(1), pp. 109-132, jan./abr. 2017.
Hair Jr, J. F.; Black, W. C , Babin B. J. Anderson, R. E. & Tatham, R. L. (2005). Análise multivariada de da-dos. 5. ed. Porto Alegre: Bookman.
Harrington, R. J., Ottenbacher, M. C., & Kendall, K. W. (2011). Fine-dining restaurant selection: Direct and moderating effects of customer attributes.Jour-
nal of Foodservice Business Research, 14(3),
272-289.
Hawkins, D. I.; Mothersbaugh, D. L. & Best, R. J. (2007). Comportamento do consumidor: constru-indo a estratégia de marketing. 10. ed. Rio de Janeiro: Elsevier.
IBISWORLD (2014). Street Vendors in the US: Market
Research Report. Recuperado em 27 de mar, 2015,
de
http://www.ibisworld.com/industry/de-fault.aspx?indid=1683.
Karsaklian, E. (2004). Comportamento do consumi-dor. 2. ed. São Paulo. Atlas.
Lambert, J. L., Batalha, M. O., Sproesser, R. L., Silva, A. L. D., & Lucchese, T. (2005). As principais evolu-ções dos comportamentos alimentares: o caso da França. Revista de Nutrição, 18(5), 577-591.
Leal, D. (2010). Crescimento da alimentação fora do domicílio. Segurança Alimentar e Nutricional, 17, 133-143.
Levine, D.M.; Stephan, D.F.; Krehbiel, T.C. & Beren-son, M.L. (2012). Estatística: Teoria e Aplicações (6ª Edição). Livros Técnicos e Científicos Editora, Rio de Janeiro.
Lima Filho, D. O; Maia, F. S.; Mantovani, D. & Ara-kaki, R. (2004) Comportamento Alimentar do Con-sumidor Idoso In: EnANPAD - Encontro da Associa-ção Nacional de Pós-GraduaAssocia-ção e Pesquisa em
Ad-ministração (Evento Nacional), Anais, 2004.
Liu, M., Kasteridis, P., & Yen, S. T. (2013). Breakfast, lunch, and dinner expenditures away from home in the United States. Food Policy, 38, 156-164.
Liu, Y., & Jang, S. S. (2009). Perceptions of Chinese restaurants in the US: what affects customer satis-faction and behavioral intentions? International
Journal of Hospitality Management, 28(3), 338-348.
Machado, M. D., Queiroz, T. R., & Martins, M. F. (2006). Mensuração da qualidade de serviço em empresas de fast food.Gestão & Produção, 13(2), 261-270.
Malhotra, N. (2006) Pesquisa de Marketing: uma
orientação aplicada. Trad. Laura Bocco. Porto
Ale-gre: Bookman.
Mauro, Paulo César. (2013) Fast casual: a revolução na área de alimentação. Portal do Franchising. Re-cuperado em 15 de mar, 2015, de http://www.por- taldofranchising.com.br/artigos-sobre-franchi- sing/fast-casual-a-revolucao-na-area-de-alimenta-cao.
MacMillan, I. C., & McGrath, R. G. (1996). Discover your products' hidden potential. Harvard Business Review, 74(3), 58.
Mhlanga, O., Hattingh, Z. & Moolman, H.J. (2014).
The effe t of estau a t att i utes o usto e s
expectations and experiences in formal full servisse restaurants in Port Elizabeth, South Africa. African
Journal of Hospitality, Tourism and Leisure, 3(1).
Mowen, J. C. & Minor, M. S. (2003).
Comporta-mento do consumidor. São Paulo: Prentice Hall.
Muller, C. C., & Woods, R. H. (1994). An expanded restaurant typology. Cornell Hospitality Quar-terly, 35(3), 27.
Muyanja, C., Nayiga, L., Brenda, N., & Nasinyama, G. (2011). Practices, knowledge and risk factors of street food vendors in Uganda. Food Control,22(10), 1551-1558.
Namkung, Y., & Jang, S. (2007). Does food quality really matter in restaurants? Its impact on customer satisfaction and behavioral intentions.Journal of
Hospitality & Tourism Research, 31(3), 387-409.
Newman, L. L., & Burnett, K. (2013). Street food and vibrant urban spaces: lessons from Portland, Ore-gon. Local Environment, 18(2), 233-248.
Nordström, J., & Thunström, L. (2015). The impact of price reductions on individuals' choice of healthy meals away from home. Appetite, 89, 103-111.
Park, C. (2004). Efficient or enjoyable? Consumer values of eating-out and fast food restaurant con-sumption in Korea. International Journal of
131 Rev. Bras. Pesq. Tur. São Paulo, 11(1), pp. 109-132, jan./abr. 2017.
Pelissari, A. S., de Oliveira, A. R., Gonzalez, I. V. D. P., Fabrini, M. F., & da Silveira, R. C. (2011). Determi-nantes da satisfação dos clientes: Estudo de caso em uma loja de departamentos. Revista de
Adminis-tração da Unimep-Unimep Business Journal, 32-48.
Peter, J. P. & Olson, J. C. Comportamento do consu-
midor e estratégia de marketing. 8. ed. São Paulo:
McGraw-Hill, 2009.
Pigatto, G. & Nishimura, J. R. (2012). O Perfil do Em-preendedor no Serviço de Alimentação de Rua. In:
Encontro Nacional de Engenharia de Produção,
2012, Bento Gonçalves. XXXII Encontro Nacional de Engenharia de Produção.
Piza, P. T. (2014). Capital da gastronomia', SP agora
aposta no sucesso dos 'food trucks'. G1. Recuperado
em 20 dez, 2014, de http://g1.globo.com/sao- paulo/noticia/2014/03/capital-da-gastronomia-sp-agora-aposta-no-sucesso-dos-food-trucks.html.
Rane, S. (2011). Street vended food in developing world: hazard analyses.Indian journal of microbiol-ogy, 51(1), 100-106.
Reis, L. (2007). Relacionamento a longo prazo com os clientes. Em Questão,10(2), 405-418.
Rezende, C. D., & Alberto Rodrigues Silva, M. (2013). Eating-out and experiential consumption: a typol-ogy of experience providers. British Food Jour-nal, 116(1), 91-103.
Samapundo, S., Climat, R., Xhaferi, R., & Devlieghere, F. (2015). Food safety knowledge, atti-tudes and practices of street food vendors and con-sumers in Port-au-Prince, Haiti. Food Control, 50, 457-466.
Sanches, M., & Salay, E. (2011). Alimentação fora do domicílio de consumidores do município de Campi-nas, São Paulo. Rev. nutr, 24(2), 295-304.
Santos, K. B. O comércio da comida de rua no carna-val de Salvador-BA: desvendando as dimensões
so-cial, econômica, alimentar e sanitária. Dissertação
(Mestrado em Alimentos, Nutrição e Saúde) Pro- grama de Pós-Graduação da Escola de Nutrição, Universidade Federal da Bahia, Salvador/BA, 2011.
Schlindwein, M. M., & Kassouf, A. L. (2007). Influên-cia do custo de oportunidade do tempo da Mulher
sobre o padrão de consumo alimentar no Brasil.
Pesquisa e Planejamento Econômico, 37, 489-520.
Schlindwein, M. M., & Silva, A. B. M. (2010). Gasto domiciliar com alimentos: uma análise para a Re-gião Centro-Oeste. Informe Gepec, 14(2), 129-48.
Siebeneichler, T., Wienningkamp, D., Ruchel, A. P., Trombini, E. S., & Zamberlan, L. (2013). A Satisfação de Clientes de Restaurantes: Uma Avaliação da Sa-tisfação e da Importância dos Atributos. Revista de
Administração, 6(11), p-39.
Simon, G. (2013). Co eito o solidado, st eet
food fatu a ilhões de dóla es os Estados Uni-
dos.Folha de São Paulo. [São Paulo, BR].
Recupe-rado em 10 de out, 2013, de http://www1.fo- lha.uol.com.br/comida/2013/09/1340115-con- ceito-consolidado-street-food-fatura-milhoes-de-dolares-nos-estados-unidos.shtml.
Soriano, R. D. (2002). Customers' expectations fac-tors in restaurants: The situation in Spain. Interna-tional Journal of Quality & Reliability Manage-ment, 19(8/9), 1055-1067.
Souki, G. Q., Madureira, K. T., Gonçalves Filho, C., & Neto, M. T. R. (2010). Desenvolvimento e Validação de uma Escala de Atributos Utilizados pelos Consu-midores na Escolha de Restaurantes de Comida a Quilo. DOI: 10.15600/1679-5350/rau.
v8n2p72-90. Revista de Administração da Unimep-Unimep
Business Journal, 8(2), 72-90.
Taplin, R. H. (2012). The value of self-stated attrib-ute importance to overall satisfaction. Tourism
Ma-nagement, 33(2), 295-304.
Vergara, S. C. (2011). Projetos e relatórios de
pes-quisa em administração.13. ed. São Paulo: Atlas.
Vieira, V. A., & Slongo, L. A. (2008). Uma análise dos atributos importantes no processo de decisão de compra de notebooks utilizando análise fatorial e escalonamento multidimensional. Revista de
Ad-ministração Mackenzie, 7(4).
WHO. (1996). Division of Food and Nutrition.
Essen-tial safety requirements for street-vended foods
(Re-vised Edition). Recuperado em 29 de out, 2013, de
132 Rev. Bras. Pesq. Tur. São Paulo, 11(1), pp. 109-132, jan./abr. 2017.
Zeithaml, V. A. (1988). Consumer perceptions of price, quality, and value: a means-end model and synthesis of evidence. The Journal of marketing, 52 (2), 2-22.
Information on the authors
Hannah Nicchio Loriato
Federal University of Espírito Santo (UFES), Espírito Santo, DF. Maste s deg ee i Ad i ist atio f o the Federal University of Espírito Santo. Email: [email protected]
Anderson Soncini Pelissari