Aquaporins and the control of the water
status in coffee plants
Adriana Brombini dos Santos, Paulo Mazzafera
*Department of Plant Biology, Institute of Biology, State University of Campinas, Campinas, SP, Brazil
*Corresponding author: [email protected] Received: 14 June 2013; Accepted: 19 June 2013
ABSTRACT: Six aquaporin (AQP) homologues were identified in three coffee species (Coffea arabica, C. Canephora, and C. racemosa), including four plasma membrane intrinsic proteins (PIP1;1, PIP1;2, PIP2;1, and PIP2;2) and two tonoplast intrinsic proteins (TIP1;1 and TIP1;2). In order to better understand the role of these genes in coffee, C. arabica cvs Catuaí and Mundo Novo, C. canephora cv. Apoatã, and a graft of Mundo Novo on Apoatã were water stressed, and the expression levels of PIP1;2, PIP2;1, PIP2;2, and TIP1;2 were analyzed in the roots and leaves. The expression of PIP2;1 and PIP2;2 was clearly up-regulated in the leaves and roots by water deficit, suggesting the possible involvement of these genes in controlling the water status of plants and in the post-stress recovery of irrigated plants. The most strongly induced expression in roots was found in both grafted and non-grafted Apoatã plants. Interestingly, the level of PIP2;1 transcripts in roots continued to rise even after the plants were watered and were, therefore, no longer subjected to the water stress, suggesting that this gene may be actively involved in the regulation of water uptake in coffee tree roots, especially when there is a water deficit in the soil.
KEYWORDS: aquaporins, PIPs, Coffea arabica, Coffea canephora, water stress, root.
INTRODUCTION
Aquaporins (AQPs) are protein channels that facilitate the transport of water and/or small neutral solutes and gases through membranes (Maurel et al. 2008). They belong to the conserved superfamily of major intrinsic proteins (MIP) and have been identified in all groups of living organisms (Agre et al. 1993). In contrast with the 13 genes identified in mammals, AQPs constitute a broad gene family in plants, with 35 members identified in Arabidopsis thaliana ( Johanson et al. 2001), 31 in Zea mays (Chaumont et al. 2001), 33 in
Oryza sativa (Sakurai et al. 2005), 55 in Populus trichocarpa
(Gupta and Sankararamakrishnan 2009), and 71 in
Gossypium hirsutum (Park et al. 2010). The diversity of AQPs
in plants appears to be related to the following factors: a high degree of compartmentalization in plant cells; AQP selectivity for different substrates; organ, tissue, and cell type-specific localization of AQPs; and functional specialization of each AQP isoform (Maurel et al. 2008, Wudick et al. 2009). In addition, the need to finely control the water balance of the
plant during growth and under various conditions of stress also explains the abundance of AQPs in plants (Aroca et al. 2012, Luu and Maurel 2005, Maurel et al. 2008).
AQPs have been classified into five subfamilies: plasma membrane intrinsic proteins (PIPs), tonoplast intrinsic proteins (TIPs), NOD26-like intrinsic proteins (NIPs), small basic intrinsic proteins (SIPs) and uncharacterized intrinsic proteins (XIPs) (Chaumont et al. 2001, Danielson and Johanson 2008, Johanson et al. 2001, Sakurai et al. 2005). Based on the sequence homology of isoforms, the PIP subfamily can be divided into two groups: PIP1 and PIP2 (Schaffner 1998). The heterologous expression of plant PIP2 in Xenopus oocytes produced strong water channel activity, while PIP1 isoforms were either inactive or showed only slight activity (Chaumont et al. 2001, Fetter et al. 2004, Katsuhara et al. 2002).
of water from the soil (Javot et al. 2003, Kaldenhoff et al. 2008, Postaire et al. 2010). Studies of silenced PIP1 and PIP2 genes in
A. thaliana and Nicotiana tabacum have demonstrated the role
of these proteins in the transport of water in roots (Martre et al. 2002, Siefritz et al. 2002). In addition, the analysis of Arabidopsis mutants with a knockout version of PIP2;2 (an isoform strongly expressed in roots) demonstrated the role of this AQP in controlling the water permeability of cells in the root cortex and the osmotic transport of water in the roots (Javot et al. 2003).
Water has long been considered the main limiting factor for plant productivity in natural environments and agriculture. Maintaining proper water status or a balance between the rates of water absorption and loss through transpiration is a major challenge for plants. AQPs become important in this context, as plants have developed a wide variety of responses to water shortages at the physiological, biochemical, and molecular levels throughout the course of evolution. Studies of the expression patterns of various AQPs in response to water stress have yielded highly complex results that vary depending on the isoform investigated; studies were not always able to find a direct correlation between the expression level and the abundance of the protein (Alexandersson et al. 2005). The response of AQPs to water stress can lead to up- or down-regulation of gene expression or even no change depending on the duration and intensity of the stress (Galmes et al. 2007). Analyses of the expression of 13 PIP genes in Arabidopsis under different abiotic stresses demonstrated that each gene was predominantly expressed in one organ (roots or shoots) and some genes were strongly up- or down-regulated depending on the type of stress (dry, cold, salinity and ABA) ( Jang et al. 2004).
Other studies have suggested that AQPs may play a major role in drought tolerance in plants. The use of an antisense version of the NtAQP1 gene in tobacco plants produced a reduction in the hydraulic conductivity of the roots and a consequently enhanced susceptibility to water stress (Siefritz et al. 2002). The levels of transcripts of the RWC3 gene (PIP1 gene) and of the respective protein were high in a drought-resistant rice cultivar (upland), and the over-expression of RWC3 in a non-resistant cultivar improved the performance of transgenic plants under conditions of water stress (Lian et al. 2004). Similarly,
Arabidopsis plants over-expressing the PgTIP1 gene from Panax
ginseng were more tolerant to salinity and water stress, suggesting
that the larger root system of these plants may be directly related to their better performance under conditions of water stress (Peng et al. 2007). These results illustrate the role of AQPs in the water balance of plants, suggesting that each isoform may play a specific role in specific organs/tissues and may possibly directly affect the plant’s response to conditions of environmental stress.
Coffee is one of the most important crops worldwide and is an essential source of commercial trade for many countries. Brazil is a dominant producer and exporter of coffee in the world (Dias et al. 2007). Coffee farming around the world is limited to the inter-tropical zone, mainly because of climatic factors related to temperature and humidity (Smith 1989). In these regions, drought is considered the main environmental stressor affecting crop productivity. In certain remote regions lacking irrigation, production losses can surpass 80% during years of prolonged drought (DaMatta and Ramalho 2006). Globally, coffee production is based on two species, Coffea arabica L. (Arabica coffee) and Coffea
canephora Pierre ex Froehner (Robusta coffee) (Dias et al.
2007). The differential adaptation to drought adopted by the Arabica and Robusta coffee genotypes is behavioral and is related to the rates of water usage and/or the efficiency of water uptake from the soil (DaMatta et al. 2003, Dias et al. 2007, Pinheiro et al. 2005).
The objective of this study was to determine the role of AQPs in maintaining the water status of Arabica and Robusta coffee plants. Initially, AQP homologues were identified from an EST (Expressed Sequence Tags) database for coffee containing nearly 200,000 ESTs generated from various EST libraries for C. arabica, C. Canephora, and Coffea racemosa (Lin et al. 2005, Vieira et al. 2006). Expression analyses of the genes identified in C. Arabica were performed on various plant organs (Arabica coffee) and on the roots and leaves of water-stressed plants (Arabica and Robusta coffee). The data obtained suggest that some of the studied AQPs are involved in the control of water balance in coffee.
MATERIAL AND METHODS
Moraes and Franco (1973) were produced from seeds provided by the Center of Coffee, Agronomic Institute (IAC), Campinas, SP, Brazil. Plants were grown in 3.8 L conical plastic pots containing a mix of soil and sand (1:1, v/v) until they reached a stage with six to seven pairs of leaves (experiment 1, E1). Another group of C. arabica cv. Catuaí IAC-81 plants was grown in 0.5 L plastic bags containing a mix of soil and sand (3:1, v/v) until they reached a stage with four pairs of leaves, and this group was then subjected to water stress (experiment 2, E2). All plants were kept under greenhouse conditions with full irrigation until the beginning of water treatments.
In E1, water stress was imposed by complete suspension of irrigation until the leaf water potential (ψw) reached
about -2.0 MPa at predawn (5:00 to 6:00 am). This reference ψw was measured when plants had visual leaf wilting at 12:00
am and also during the next day at predawn, as established in a previous study (Santos and Mazzafera 2012). In E1, the plants presenting the wilting phenotype at 12:00 am showed mean leaf water potential of about -2.5 MPa during the next day (10:00 to 11:00 am). Measurements were taken from one of the leaves of the third pair of leaves of four plants of each cultivar in each treatment (dry or irrigated control) using a pressure chamber (Corvallis, Oregon, USA). Root samples were collected, immediately frozen in liquid nitrogen, and stored at -80°C until RNA extraction. In E2, Catuaí plants were subjected to a complete suspension of irrigation. Between the fourth and tenth day of treatment, measurements of leaf water potential were taken in plants showing symptoms of leaf wilting. This procedure allowed the formation of subgroups of plants under distinct degrees of water stress: T0=control (-0.25 MPa), T1 (-1.0 MPa), T2 (-1.8 MPa), and T3 (-3.5 MPa). The predawn water potential was measured in three leaves of different plants in each subgroup by using a pressure chamber. Leaves and roots were collected, frozen in liquid nitrogen, and stored at -80°C until processing. In addition, two other subgroups of plants which were placed under conditions of water stress and that reached a leaf water potential of -2.0 MPa (T4) and -3.5 MPa (T5) were rehydrated. Twenty-four hours later, the leaves and roots were collected. The water stress experiments were conducted under greenhouse conditions, with a mean air temperature between 19.1±2.0ºC (minimum) and 34.1±2.0ºC (maximum) and a relative humidity of 73.0±2.0%.
Sequence analysis: Aquaporin (AQPs) sequences were obtained from the Brazilian Coffee Genome Project database (CafEST - http://www.lge.ibi.unicamp.br/coffea), which contains Expressed Sequence Tags (EST) from the species
C. arabica, C. canephora and C. racemosa (Vidal et al. 2010,
Mondego et al. 2011). CafEST has a collection of nearly 200,000 ESTs that are derived from 37 cDNA libraries (Vieira et al. 2006) and from 5 more cDNA libraries which are generated by the Cornell–Nestlé Coffee Project EST (Lin et al. 2005). The EST database was queried by keyword (aquaporin) and by similarity to partial or complete sequences of genes identified in other plant species (A. thaliana, Vitis vinifera, and N. tabacum). The sequences identified from the cDNA libraries were assembled using the CAP3 program (Huang 1992) and the Bioedit software (Hall 1999). Analyses of contigs obtained in coffee were performed using the BLASTn and BLASTx tools from NCBI. Probable coding sequences (cds) for each identified unigene were determined by a comparison with homologous genes in other plant species. Homologous protein sequences obtained from non-redundant protein databases (UniProtKB/Swiss-Prot, RefSeq/NCBI, and TAIR) were used to generate multiple alignments using the program ClustalW (Thompson, Higgins and Gibson 1994) included in the Bioedit software (Hall 1999). Phylogenetic analyses were conducted using protein alignments in the program MEGA4.0 (Tamura et al. 2007) by the neighbor-joining method (bootstrap 1,000 replicates). Complete PIP and TIP protein sequences previously described in V. vinifera (VvPIP and VvTIP), A. thaliana (AtPIP and AtTIP), N. tabacum (NtPIP and NtTIP), Solanum
tuberosum (StPIP), Solanum lycopersicum (SlTIP), O. sativa
AtTIP3;2 (O22588), AtTIP4;1 (O82316), AtTIP5;1 (Q9STX9), NtTIP1;1 (BAF95576), NtTIP2 (P24422), VvTIP1;1 (AAW02943), VvTIP1;2 (XP_002267788), VvTIP2;1 (ABN14354), SlTIP1 (NP_001234103), OsTIP1;1 (P50156), OsTIP1;2 (Q94CS9), OsTIP2;2 (Q5Z6F0), ZmTIP1;1 (O64964), ZmTIP1;2 (Q9ATM0), ZmTIP2;1 (Q9ATL9), CaTIP1;2 ( JAA775510), CrTIP1;1 ( JAA775515), CrTIP1;2 ( JAA775514), and CcTIP1;2 (Contig4922).
RNA isolation and expression analysis of coffee aquaporins: Total RNA was extracted from 300 mg of tissue (Rezaian and Krake 1987), and contaminant genomic DNA was removed using DNase I (DNA-FreeTM Kit, Applied Biosystems,
USA). The first cDNA strand was synthesized from 1.0 µg of total RNA using a SuperscriptTM III Reverse Transcriptase kit
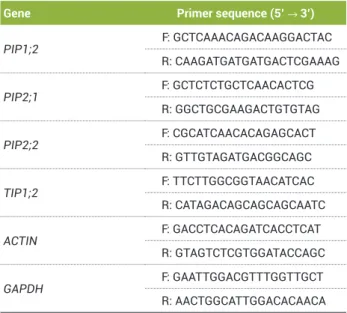
(Invitrogen, Carlsbad, CA, USA) following the manufacturer’s instructions. RT-PCR analyses were performed on 15-µL reactions using the Taq DNA Polymerase kit (QIAGEN, Germany) and 2 µL of cDNA (diluted 100 to 300 times). The primer sequences used to amplify PIP1;2, PIP2;1, PIP2;2,
and TIP1;2 were designed based on sequences identified in
CafEST (Vieira et al. 2006). The primers used in the RT-PCR reactions for all genes except TIP1;2 corresponded to sequences from the 5´ and 3´ untranslated regions (UTRs) (Table 1). The RT-PCR products were quantified on 1.5% agarose gels, and the band densities were measured using the Quantity One software (Biorad, USA). GAPDH and ACTIN were used as reference genes (Barsalobres-Cavallari et al. 2009).
Statistical analysis: Experiments E1 and E2 were designed in completely randomized blocks. E1 included eight treatment combinations (4 × 2 factorial, four cultivars, and two water regimes) with four independent replicates. E2 included six treatment combinations (one cultivar and six water regimes) with three biological replicates. The results are presented as the mean and standard error (±SE).
RESULTS
Identification and sequence analysis of aquaporins in coffee: Six complete unigenes were obtained from the EST sequences of the three Coffea species studied. Partial sequences for other possible homologous genes were found but not used in this study. Analyses (re-sequencing) of clones were necessary to confirm the homology of these sequences. Phylogenetic trees generated using alignments of deduced protein sequences demonstrated that AQPs can be classified into two subfamilies (PIP and TIP); four were classified as belonging to the PIP subfamily, and two were classified as belonging to the TIP subfamily (Figures 1 and 2). The complete nucleotide sequence for each unigene was represented by the consensus sequence generated from an alignment of the coffee reads that was most similar to MIP genes from V. vinifera and A. thaliana. The nomenclature for coffee unigenes followed the standard established for AtMIPs ( Johanson et al. 2001) and took into account, when possible, the phylogenetic proximity to probable homologues in
V. vinifera. Coffee and grapevine appear to be derived from the
same ancestral genome (Cenci et al. 2010).
Unigenes classified as belonging to the PIP subfamily
(PIP1;1, PIP1;2, PIP2;1, and PIP2;2) were found in one or
more of the studied coffee species (Table 2). The homology between coffee unigenes ranged from 77 to 99% for members of the PIP1 group and from 70 to 99% for members of the PIP2 group. Comparisons of the PIP1;2 gene among the three coffee species indicated six single-base alterations in the open-reading frame (ORF) and some differences in the untranslated regions, including a 4-base gap in the 3´UTR of C. canephora. Differences in the ORF (26 bp) of the PIP2;2 gene and in the untranslated regions (several mutated bases and one 5-base gap in the 3´UTR) were also found. Within the TIP subfamily, two unigenes (TIP1;1 and TIP1;2) were isolated from coffee (Table 2). TIP1;1 was identified in C. racemosa but neither
in C. arabica nor in C. canephora, and it differed from TIP1;2
by changes in the coding region (68% identity) and in the 3´ and 5´ UTRs. The homology between TIP1;2 genes was
Table 1. List of primers used for semi-quantitative RT–PCR experiments
Gene Primer sequence (5’ → 3’)
PIP1;2
F: GCTCAAACAGACAAGGACTAC
R: CAAGATGATGATGACTCGAAAG
PIP2;1
F: GCTCTCTGCTCAACACTCG
R: GGCTGCGAAGACTGTGTAG
PIP2;2
F: CGCATCAACACAGAGCACT
R: GTTGTAGATGACGGCAGC
TIP1;2
F: TTCTTGGCGGTAACATCAC
R: CATAGACAGCAGCAGCAATC
ACTIN
F: GACCTCACAGATCACCTCAT
R: GTAGTCTCGTGGATACCAGC
GAPDH
F: GAATTGGACGTTTGGTTGCT
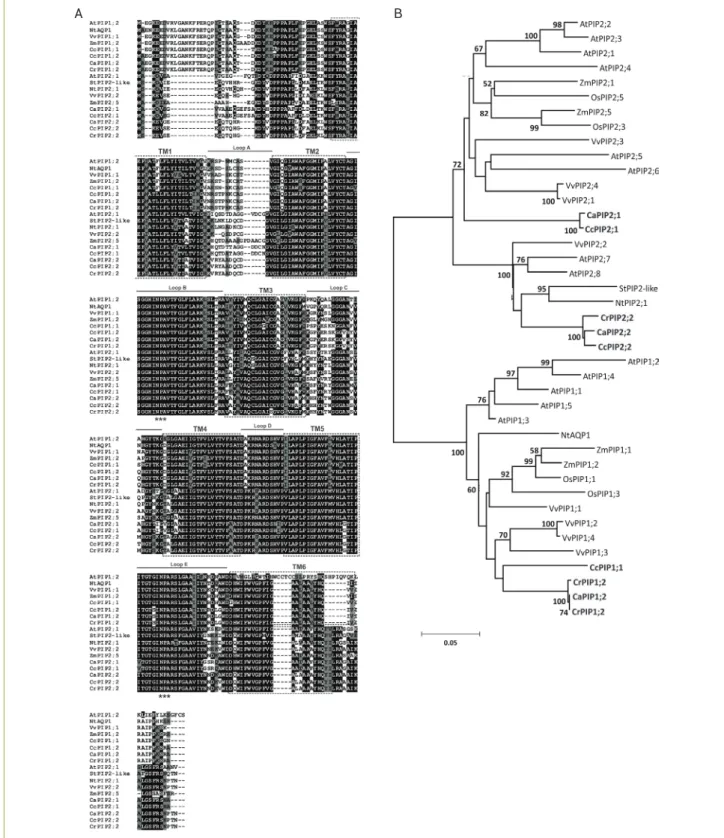
Figure 1. Deduced amino acid sequences of PIP proteins in different Coffea species and their phylogenetic tree. (A) Alignment and the deduced structure of the coffee PIP proteins. Two conserved NPA motifs are shown with triple asterisks. Rectangles with broken lines indicate the position of the six transmembrane spanning domains (TM1-6) and the connecting loops (A-E) are indicated by solid line. ClustalW (Bioedit) was used to generate multiple sequence alignments. (B) Phylogenetic relationships of the PIP proteins from coffee (CaPIP, CcPIP and CrPIP), Arabidopsis (AtPIP), grapevine (VvPIP), tobacco (NtPIP), potato (StPIP), rice (OsPIP) and maize (ZmPIP) based on the deduced amino acid sequences. The phylogenetic tree of the full-length PIP subfamily was conducted in MEGA4 using the neighbour-joining method. All positions containing alignment gaps and missing data were eliminated only in pairwise sequence comparisons (pairwise deletion). The PIP cDNAs
identified in this study are in bold. Branches with a bootstrap value of less than 50% are omitted. (Accession numbers in M&M)
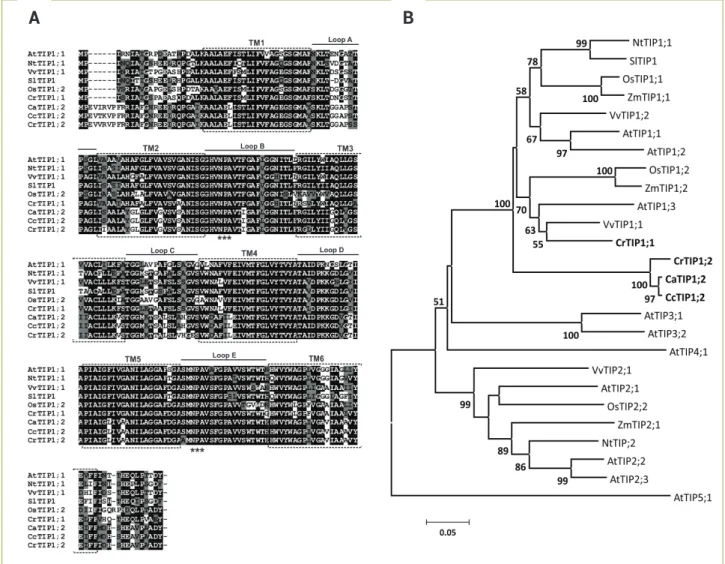
Figure 2. Deduced amino-acid sequences of TIP proteins in different Coffea species and their phylogenetic tree. (A) Alignment and the deduced structure of the coffee TIP proteins. (B) Phylogenetic relationships of the TIP proteins from coffee (CaTIP, CcTIP, and CrTIP), Arabidopsis (AtTIP), grapevine (VvTIP), tobacco (NtTIP), tomato (SlTIP), rice (OsPIP), and maize (ZmPIP) based on the deduced
amino-acid sequences. Further details are provided in Figure 1. (Accession numbers in M&M).
greater than 97% among the coffee species. Similarity analyses indicated that point mutations in the ORF (23 base) and in the 5´ and 3´UTRs of the unigenes (a 10-base gap in the 3´UTR
of C. racemosa) had occurred. The four PIP proteins in coffee
have predicted sizes ranging from 282 to 288 amino acids and molecular weights of approximately 30 kDa. The two TIP proteins have estimated sizes of 251 and 257 amino acids and an estimated molecular weight of 26 kDa.
Multiple alignments of the amino-acid sequences for the AQPs in coffee using the ClustalW (Thompson et al. 1994) program revealed a high homology between MIP proteins obtained from non-redundant protein databases (Figures 1A and 2A). In silico analyses of predicted amino-acid sequences for MIPs in coffee which were performed using the TMHMM (http://www.cbs.dtu.dk/services/) tool suggest
that there are six transmembrane helices (TM1 to TM6) in the protein structure. The two Asn-Pro-Ala (NPA) motifs that compose the AQP pore are highly conserved and are located between the second and third transmembrane domains (loop B) and between the fifth and sixth domains (loop E) (Figures 1A and 2A). An analysis of the primary sequence of AQPs identified in coffee shows that the protein identity among members of the PIP subfamily ranged from 86 to 100% for PIP1, from 75 to 99% for PIP2, and from 70 to 99% for the TIP subfamily. As described for Arabidopsis ( Johanson et al. 2001), the N- and C-terminal regions of AQPs tended to exhibit a higher degree of heterogeneity among subfamilies and between different groups within each subfamily. Thus, the phylogeny of PIP proteins shows the clear separation of two distinct clades known as PIP1 and PIP2 (Figure 1B) due
A B
to a lower degree of conservation of amino-acid residues at the ends of the proteins; in particular, an additional 11–15 residue segment could be found at the N terminal of group PIP1 members (Figure 1A). The identity of PIP proteins in coffee and grapevine reached 85% for PIP1 (CcPIP1;1 and VvPIP1;1) and 88% for PIP2 (CaPIP2;2 and VvPIP2;2). The PIP1 and PIP2 proteins of C. arabica had 86 and 77% identity with the equivalent maize proteins, respectively.
The alignment of TIP proteins revealed a high degree of similarity between predicted proteins in Coffea and TIP proteins described in other plant species. The analysis of TIP1;1 proteins revealed an identity of 79% between coffee and
Arabidopsis and of 86% between coffee and grapevine. Despite
the high number of conserved sequences found in TIPs, the predicted TIP1;2 protein in coffee had a six amino-acid residue segment (EV(I/T/V)(R/K)VP) in the N-terminal region that was shared by the three coffee species and different from the other alignment proteins (Figure 2A). The phylogenetic tree for TIPs showed that all predicted proteins in coffee were grouped together as TIP1 with proteins previously described
in Arabidopsis, grapevine, tobacco, maize, and rice (Figure 2B).
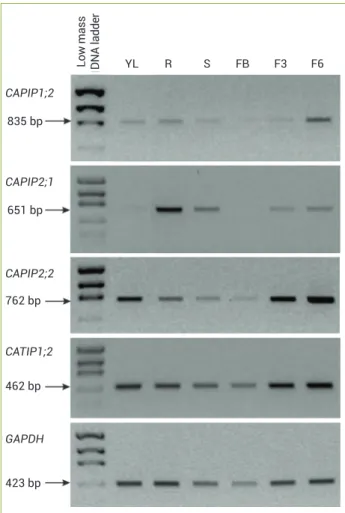
RT–PCR expression analysis of AQPs in various coffee organs: The abundance of transcripts for the genes PIP1;2, PIP2;1, PIP2;2 and TIP1;2 was evaluated in organs from an adult C. arabica cv. Mundo Novo plant (Figure 3). While TIP1;2 was constitutively expressed in all
organs, the other genes were differentially expressed in the various organs analyzed. Transcripts of PIP1;2 tended to accumulate at low levels in most organs except for late green fruits. The expression levels of PIP2;1 were high in roots and almost or completely absent in young leaves and flower buds.
The PIP2;2 gene preferentially accumulated in young leaves
and green fruits, where it appeared that transcripts in the late stage (F6) were more abundant than transcripts in the early stage (F3).
Expression of aquaporins in coffee plants under drought stress: The expression patterns for PIP1;2,
PIP2;1, PIP2;2, and TIP1;2 in Arabica and Robusta coffee
plants under water stress were analyzed by semi-quantitative RT-PCR with two distinct approaches. In the first approach (E1), plant irrigation was suspended, and expression analyses were performed after the stress had been established. The leaf water potential (ψw) measured at approximately
10:00–11:00 am was -2.5 MPa for stressed plants and -1.1 MPa for irrigated control plants. In the second approach (E2), the irrigation of plants was suspended, and expression analyses were performed on various leaves during the onset of water stress.
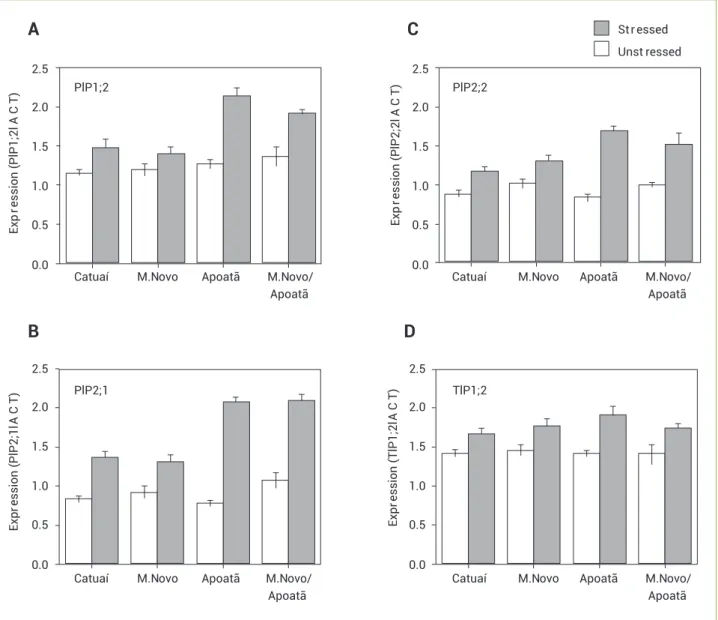
The analyses of PIP1;2, PIP2;1, PIP2;2, and TIP1;2 expression in roots of plants in E1 showed that the levels of transcripts of all analyzed genes increased in water-stressed plants, especially for the first three genes in Apoatã and MN/
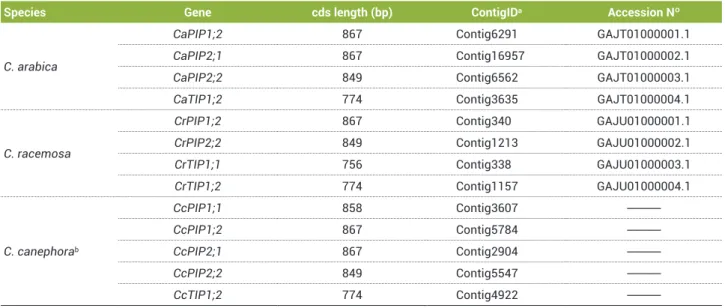
Table 2. Aquaporins identified in the Brazilian Coffee Genome EST database (CafEST)
Species Gene cds length (bp) ContigIDa Accession Nº
C. arabica
CaPIP1;2 867 Contig6291 GAJT01000001.1
CaPIP2;1 867 Contig16957 GAJT01000002.1
CaPIP2;2 849 Contig6562 GAJT01000003.1
CaTIP1;2 774 Contig3635 GAJT01000004.1
C. racemosa
CrPIP1;2 867 Contig340 GAJU01000001.1
CrPIP2;2 849 Contig1213 GAJU01000002.1
CrTIP1;1 756 Contig338 GAJU01000003.1
CrTIP1;2 774 Contig1157 GAJU01000004.1
C. canephorab
CcPIP1;1 858 Contig3607
---CcPIP1;2 867 Contig5784
---CcPIP2;1 867 Contig2904
---CcPIP2;2 849 Contig5547
---CcTIP1;2 774 Contig4922
---a ContigID indicates the reference contig for each of unigenes generated by the CafEST database.
b The unigenes identified in C. canephora were generated by sequences originating from two different databases, the Brazilian Coffee Genome Project (CafEST) and the
Apoatã (Figure 4). TIP1;2 expression appeared to increase the least under conditions of water stress (Figure 4D). The expression levels of the four genes of the Arabica, Catuaí, and Mundo Novo coffee plants were similar for irrigated and non-irrigated plants. A similar finding was obtained in the roots of Apoatã and MN/Apoatã.
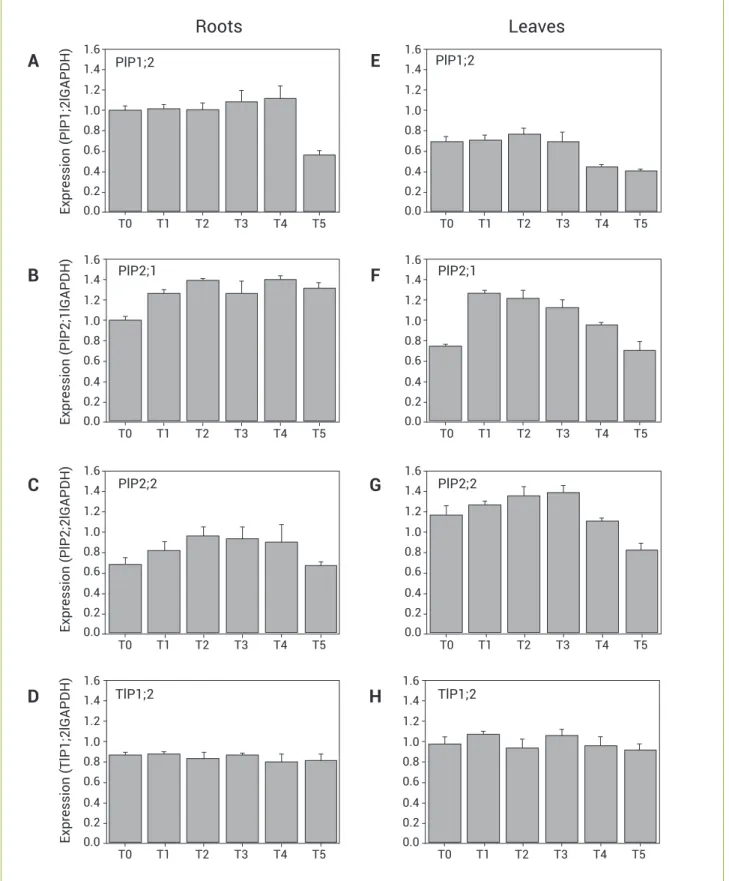
The water status of Catuaí plants in experiment E2 was assessed through measurements of leaf water potential over the course of the onset of water stress, and four levels were established: T0 (-0.3 MPa, irrigated plants), T1 (-1.0 MPa), T2 (-1.8 MPa), and T3 (-3.5 MPa). Some of the plants were irrigated when ψw reached a value of -2.0 MPa
(T4) or -3.5 MPa (T5) and were analyzed after 24 h. The AQP expression of roots and leaves collected from plants at these stages of stress was analyzed. All four genes showed normal baseline levels of expression under normal irrigation conditions (T0). As water stress developed (T1-T3), the
expression profiles for PIP1;2, PIP2;1, PIP2;2, and TIP1;2 were similar in the roots and shoots of Arabica coffee plants; however, differences in the intensity of transcript accumulation were found in these tissues. The expression levels of the PIP1;2 gene were higher in the roots (Figure 5A) than in the leaves (Figure 5E). Similar levels of transcripts were found in both types of tissues in water-stressed plants (T0-T3). The expression of the PIP2;1 and PIP2;2 genes clearly increased under conditions of water stress (T0-T3 in Figures 5B, C, F, and G). The TIP1;2 gene was expressed at similar levels in roots and leaves, and its expression was neither up-regulated by water stress nor changed after stressed plants were rehydrated (T4-T5).
In treatments T4 and T5, the levels of transcripts of PIP genes varied. The expression of PIP1;2 was even lower than that of the control in roots of T5 plants and in leaves of T4 and T5 plants (Figures 5A and E). In contrast, the expression levels of PIP2;1 were greater than those of the control in the roots of T4 and T5 plants; however, these levels returned to the level of the control in T5 leaves (Figures 5B and F). The expression pattern of PIP2;2 was intermediate compared with that of PIP1;2 and PIP2;1; the PIP2;2 levels in T4 and T5 roots were similar to those of the control, but the PIP2;2 levels in the leaves of T5 remained lower than those of the control (Figures 5C and G).
DISCUSSION
Identification and phylogenetic analysis of coffee aquaporins: Aquaporins regulate the flow of water through cell membranes (Maurel et al. 2008). Since the control of water status in plants is highly complex, a fine regulation of AQP activity may be one way of maintaining an appropriate water balance when water availability becomes a growth- limiting factor.
The screening of two coffee EST collections for PIP and TIP cDNAs resulted in the identification of six unigenes in the species C. arabica, C. canephora, and C.
racemosa. The analysis of sequence homology with other
plants enabled the identification of members of the MIP superfamily, including four genes belonging to the PIP subfamily and two belonging to the TIP subfamily (Table 2). The comparison of nucleotide sequences of unigenes common to all three coffee species (PIP1;2, PIP2;2, and TIP1;2) revealed that homology is greater between C. arabica and
C. canephora than between C. arabica and C. racemosa
and C. canephora and C. racemosa for all cases. The untranslated
Figure 3. Expression patterns of PIP and TIP genes in various organs of a coffee plant (C. arabica cv. Mundo Novo). The GAPDH gene was used as a reference gene in the semi-quantitative RT-PCR reactions. YL= young leaf; R= root; S= stem; FB= flower buds (stage G6); F3= green fruits (stage 3); F6= green fruits (stage 6).
YL
CAPIP1;2
CAPIP2;1
CAPIP2;2
CATIP1;2
GAPDH 835 bp
651 bp
762 bp
462 bp
423 bp
R S FB F3 F6
Low mass DN
regions (5´ and 3´UTRs) of these unigenes reinforced the similarities between the two coffee species. The close relationship between the two Coffea species is likely related to the origin of C. arabica, an allotetraploid (amphidiploid; 2n=4×=44) resulting from a cross between C. canephora and
C. eugenioides (Lashermes et al. 1999).
The PIP genes identified in the present study were highly similar among the Coffea species at both the nucleotide (identity 70–99%) and amino-acid (identity 75–100%) levels. The high homology among the coffee species is exemplified by the PIP1;2 gene, which exhibits 99% identity between
C. arabica and C. canephora and encodes identical proteins in
these species. The high homology among PIP proteins has been observed for other species, including Arabidopsis ( Johanson et al. 2001), maize (Chaumont et al. 2001), rice (Sakurai et al. 2005), wheat (Forrest and Bhave 2008), grapevine (Shelden et al. 2009), and cotton (Park et al. 2010). The striking sequence conservation within the PIP subfamily suggests strong functional restrictions/pressures and/or a relatively recent origin (Zardoya 2005). The TIP subfamily has been divided into five groups (TIP1-5) that exhibit various levels of homology but which are clearly more divergent than the groups of the PIP subfamily ( Johanson et al. 2001, Chaumont et al. 2001). The comparison of the unigenes found in C. racemosa (TIP1;1
Figure 4. Semi-quantitative RT-PCR expression analysis of coffee AQPs in roots of plants under water stress (ψw= −2.5 MPa). The white
bars indicate the expression of AQP unigenes in the roots of unstressed plants (ψw = −1.1 MPa). Relative density of PIP1;2 (A), PIP2;1 (B), PIP2;2 (C), and TIP1;2 (D) expression after normalisation with GAPDH. The data are means of n = 3 plants ± standard error.
Exp
ression
(PlP1;2l
A
C
T)
Exp
ression
(PlP2;1l
A
C
T)
Exp
ression
(TlP1;2l
A
C
T)
Exp
ression
(PlP2;2l
A
C
T)
PlP1;2
PlP2;1 TlP1;2
PlP2;2
St r essed
Unst ressed
0.0
Catuaí M.Novo Apoatã M.Novo/ Apoatã
Catuaí M.Novo Apoatã M.Novo/ Apoatã
Catuaí Apoatã
Catuaí Apoatã
0.5 1.0 1.5 2.0 2.5
0.0 0.5 1.0 1.5 2.0 2.5
0.0 0.5 1.0 1.5 2.0 2.5 0.0 0.5 1.0 1.5 2.0 2.5
M.Novo/ Apoatã M.Novo
M.Novo/ Apoatã M.Novo
A
C
Figure 5. Semi-quantitative RT-PCR expression analysis of coffee aquaporins in C. arabica cv. Catuaí plants during the onset of water stress. Relative densities of PIP1;2, PIP2;1, PIP2;2, and TIP1;2 in the roots (A – D) and leaves (E – H) are shown after normalisation with GAPDH. T0:
ψw = −0.3 MPa (irrigated control); T1: ψw = −1.0 MPa; T2: ψw = −1.8 MPa; T3: ψw = −3.5 MPa; T4: ψw = plants stressed to ψw = −2.0 MPa and
analysed after 24 h of rehydration; and T5: plants stressed to ψw = −3.5 MPa and analysed after 24 h of rehydration. All ψw measurements were performed at predawn (06:00 am). The data are means of n = 3 plants ± standard error.
Roots
Leaves
Expr
ession
(PlP1;2lGAPDH)
Expr
ession
(PlP2;1lGAPDH)
Expr
ession
(PlP2;2lGAPDH)
Expr
ession
(TlP1;2lGAPDH)
0.0 0.2 0.4 0.6 0.8 1.0 1.2 1.4 1.6
0.0 0.2 0.4 0.6 0.8 1.0 1.2 1.4 1.6
0.0 0.2 0.4 0.6 0.8 1.0 1.2 1.4 1.6
0.0 0.2 0.4 0.6 0.8 1.0 1.2 1.4 1.6
0.0 0.2 0.4 0.6 0.8 1.0 1.2 1.4 1.6
0.0 0.2 0.4 0.6 0.8 1.0 1.2 1.4 1.6
0.0 0.2 0.4 0.6 0.8 1.0 1.2 1.4 1.6
0.0 0.2 0.4 0.6 0.8 1.0 1.2 1.4 1.6
T0 T1 T2 T3 T4 T5
T0 T1 T2 T3 T4 T5
T0 T1 T2 T3 T4 T5
T0 T1 T2 T3 T4 T5 T0 T1 T2 T3 T4 T5
T0 T1 T2 T3 T4 T5
T0 T1 T2 T3 T4 T5
T0 T1 T2 T3 T4 T5
PlP1;2
PlP2;1
PlP2;2
TlP1;2 TlP1;2
PlP2;2 PlP2;1 PlP1;2
A
E
C
G
B
F
and TIP1;2) revealed 68% similarity among the genes, suggesting a lower level of homology among members of the TIP subfamily than among members of the PIP subfamily in coffee. The greater phylogenetic proximity between coffee and species such as grapevine, tomato, and tobacco (Guyot et al. 2012; Lin et al. 2005) was confirmed by the greater homology between PIP and TIP proteins in these species than
in Arabidopsis, maize and rice (Figures 1 and 2).
The wide diversity of AQPs in plants has been reported for various species such as Arabidopsis (35 genes), maize (31 genes), rice (33 genes), cotton (71 genes), and Populus (55 genes) (Chaumont et al. 2001, Gupta and Sankararamakrishnan 2009, Johanson et al. 2001, Park et al. 2010, Sakurai et al. 2005). Six unigenes were found in the present study, and their complete sequences were identified based on information produced by transcriptome projects for three distinct Coffea species. This is the first report to describe the AQPs of this genus. However, it is highly likely that the AQPs presented here only represent a sample of the diverse groups of AQPs in coffee. Other partial sequences were found while querying the CafEST database, but these sequences were not presented. A more detailed study of the information contained in this EST database may increase the number of identified AQPs, and the re-sequencing of clones containing these partial sequences would certainly add to the knowledge of AQP diversity in coffee.
Expression profile of aquaporins in various coffee organs: In plants, AQPs constitute a broad and highly divergent family of proteins (Chaumont et al. 2001; Danielson and Johanson 2008; Johanson et al. 2001; Sakurai et al. 2005). The characterization of their expression patterns at different developmental stages and under various environmental conditions can add to the understanding of their multiple physiological functions. Earlier studies have shown that AQPs appear to be present in all plant organs/ tissues and their expression is spatiotemporally regulated by various stimuli, including abiotic (drought, salinity, and low temperature) and biotic (reviewed by Maurel et al. 2008) stressors. Various studies evaluating the expression of AQPs in different plant organs suggest that AQPs appear to play more important functions in the roots than in the leaves under normal conditions (Baiges, Schaffner and Mas 2001, Smart et al. 2001; Zhang et al. 2008). In contrast, other studies have demonstrated that some AQPs accumulate at similar quantities in roots and leaves, while other studies report that AQPs are present in greater quantities in the roots or are specific to leaves ( Jang et al. 2004; Sakurai et al. 2008; Sakurai et al. 2005).
As was found in Arabidopsis (Jang et al. 2004), no PIPs in coffee exhibited organ-specific expression (Figure 3). Our results show that PIP genes were differentially expressed in the various coffee organs, while TIP genes appeared to be constitutively expressed in all organs. However, it is important to note that the expression levels measured for TIP1;2 may not represent the actual accumulation of transcripts which are specific to that gene due to a technical limitation (position of primers inside the ORF), and more than one member of the TIP subfamily could have been amplified. PIP2;1 transcripts were very abundant in the roots and practically absent in leaves and flower buds. In contrast, PIP2;2 expression was more strongly detected in green coffee fruits at different developmental stages than in leaves or roots. The variation in abundance of homologous AQP transcripts among different organs has been reported for many plant species. In maize, ZmPIP1;1, ZmPIP1;2,
and ZmPIP2;5 expression was found to be greater in roots than
in leaves at both the transcript and protein level (Chaumont et al. 2000, Hachez et al. 2008, Hachez et al. 2006). Organ-specific expression was found for PIP genes in rice seedlings; one gene was leaf specific (OsPIP2;6) and three genes were root specific
(OsPIP1;3, OsPIP2;2, and OsPIP2;7) (Guo et al. 2006); indeed,
according to Guo et al. (2006), the organ-specific expression pattern of OsPIPs suggests that these genes may be involved in the absorption and transport of water in specific areas, directly affecting the regulation of the water balance of the plant.
In Arabidopsis, the accumulation of AtPIP2;6 was greater in
the shoots than in the roots: while the expression of other PIPs
(AtPIP1;1, AtPIP2;2, and AtPIP2;3) was lower or similar in
both organs ( Jang et al. 2004). Analyses of TIP gene expression in cotton showed that TIP1;8 was only detected in the stem and fibers, while TIP2;3 and TIP2;6 were more abundant in young roots (Park et al. 2010). The analysis of AQP expression profiles in coffee revealed a differential accumulation of these genes in various plant organs. These findings highlight the importance of AQPs, which maintain the coordinated flow of water during growth and throughout the developmental stages of plant organs.
obtained by nine studies analyzing PIP expression in roots under water stress showed that the expression levels of 15 out of the 37 analyzed PIP genes decreased, while those of 13 genes increased and those of 9 genes remained unchanged (Aroca et al. 2012). In addition to the wide variation in AQP responses to drought-induced stress, some authors report that the activation/repression of these genes can be modified by the intensity and duration of stress (Bogeat-Triboulot et al. 2007, Galmes et al. 2007).
In the present study, two experiments were conducted to determine the expression patterns of AQPs in four distinct coffee genotypes. In the first experiment (E1), expression was analyzed in the roots of plants that were stressed until a value of ψw = -2.5 MPa was reached in the leaves. In the second
experiment (E2), expression was analyzed in leaves and roots during the onset of stress that produced a water tension of ψw
= -3.5 MPa in the leaves. In E1, all four genes were expressed at baseline levels in the roots of control plants, and gene expression was up-regulated by water stress. In contrast, in E2, only genes PIP2;1 and PIP2;2 were induced by stress. This difference in expression patterns may be related to the speed at which stress developed. The plants used in E1 had 6 to 7 pairs of leaves and were grown in 3.8 L pots until a value of ψw = -2.5
MPa was reached in the leaves 9 to 12 days after the suspension of watering. Smaller plants (four pairs of leaves) grown in smaller pots (0.5 L) for ten days (with a lower ψw value of -3.5
MPa) were used in E2. PIP2;1 and PIP2;2 were the two genes with consistently up-regulated expression profiles in both experiments. A similar finding was obtained in the leaves of experiment E2.
Many studies have demonstrated an increase in the level of transcripts of PIP genes during water stress in various plant species, including Arabidopsis ( Jang et al. 2004), rice (Lian et al. 2004), grapevine (Galmes et al. 2007, Vandeleur et al. 2009), tobacco (Mahdieh et al. 2008), and maize (Manuel Ruiz-Lozano et al. 2009). In contrast, other studies have shown that the expression levels of PIP genes are negatively affected by water shortage (Alexandersson et al. 2005, Aroca et al. 2006).
Such contrasts can be partially explained by the variety of PIP isoforms. The mutant analysis of T-DNA insertions demonstrated the specific function of the PIP2;2 isoform, which is highly expressed in roots of Arabidopsis and participates in the control of osmotic equilibrium of root cortical cells ( Javot et al. 2003). Moreover, the heterologous expression of plant PIP2 in Xenopus oocytes resulted in much greater water channel activity than the PIP1 isoform, which was inactive or only slightly active (Chaumont et al. 2001, Fetter et al. 2004, Katsuhara et al. 2002). While some studies have shown that the over-expression of particular
PIP isoforms promote tolerance to water stress [PIP1;4 and PIP2;5 – ( Jang et al. 2007a)], other studies have shown that opposite responses can be produced. For example, the over-expression of cucumber PIP1;1 in Arabidopsis worsened plant performance under conditions of water stress, while the figleaf gourd PIP2;1 gene improved performance in
Arabidopsis ( Jang et al. 2007a, Jang et al. 2007b). The
over-expression of rice PIP1;1 or PIP2;2 genes in Arabidopsis induced greater tolerance to salt and drought (Guo et al. 2006). The overexpression of the Arabidopsis PIP1;2 gene in tobacco improved the vigor of plants under favorable growth conditions but had a negative effect under conditions of water stress (Aharon et al. 2003).
The results obtained in the present study clearly show that the expression levels of the PIP genes were greatest in the roots of stressed Apoatã (C. canephora) and MN/Apoatã plants (Figure 4). Morphological features of the root system of genotypes of C. canephora cultivars have been thought to be responsible for the greater ability of these plants to exploit larger volumes of soil (Fahl et al. 2001, Pinheiro et al. 2005). The use of C. canephora genotypes as rootstocks for commercial Arabica coffee cultivars has been shown to be beneficial (Fahl et al. 1998). In addition, earlier results have demonstrated that Apoatã and MN/Apoatã plants were better able to tolerate water stress, showing fewer losses of leaf and root mass than Arabica coffee cultivars (Santos and Mazzafera 2012). Our results suggest that the greater abundance of PIPs found in roots of Apoatã may help maintain a more appropriate water status during conditions of water stress.
The analysis of AQP expression in Catuaí plants undergoing different intensities of water stress showed that the accumulation of transcripts varied depending on the gene, the level of stress, and the plant organ (leaves and roots). While PIP1;2 and PIP2;1 were expressed more in the roots, PIP2;2 transcripts were more abundant in the leaves of unstressed plants. The expression of
the PIP2;1 and PIP2;2 genes in the leaves and roots was clearly
In conclusion, our results revealed the involvement of PIPs in coffee water relations under low water availability. The over-expression of PIP2;1 and PIP2;2 genes in coffee plants under water stress may be associated to their role as water channels. Once confirmed, such a strategy may improve coffee cultivation in areas in which drought is a limiting factor.
REFERENCES
Agre P, Sasaki, S, Chrispeels MJ (1993) Aquaporins: a family of water channel proteins. American Journal of Physiology - Renal Physiology 265:F461-F461.
Aharon R, Shahak Y, Wininger S, Bendov R, Kapulnik Y, Galili G (2003) Overexpression of a plasma membrane aquaporin in transgenic tobacco improves plant vigor under favorable growth conditions but not under drought or salt stress. Plant Cell 15:439-447.
Alexandersson E, Fraysse L, Sjovall-Larsen S, Gustavsson S, Fellert M, Karlsson M, Johanson U, Kjellbom P (2005) Whole gene family expression and drought stress regulation of aquaporins. Plant Molecular Biology 59:469-484.
Aroca R, Ferrante A, Vernieri P, Chrispeels MJ (2006) Drought, abscisic acid and transpiration rate effects on the regulation of PIP aquaporin gene expression and abundance in Phaseolus vulgaris plants. Annals of Botany 98:1301-1310.
Aroca R, Porcel R, Ruiz-Lozano MJ (2012) Regulation of root water uptake under abiotic stress conditions. Journal of Experimental Botany 63:43-57.
Baiges I, Schaffner AR, Mas A (2001) Eight cDNA encoding putative aquaporins in Vitis hybrid Richter-110 and their differential expression. Journal of Experimental Botany 52:1949-1951.
Barsalobres-Cavallari CF, Severino FE, Maluf MP, Maia IG (2009) Identification of suitable internal control genes for expression studies in Coffea arabica under different experimental conditions. BMC Molecular Biology 10:1.
Bogeat-Triboulot MB, Brosche M, Renaut J, Jouve L, Le Thiec D, Fayyaz P, Vinocur B, Witters E, Laukens K, Teichmann T, Altman A, Hausman JF, Polle A, Kangasjärvi J, Dreyer E (2007) Gradual soil water depletion results in reversible changes of gene expression, protein profiles, ecophysiology, and growth performance in Populus euphratica, a poplar growing in arid regions. Plant Physiology 143:876-892.
Cenci A, Combes MC, Lashermes P (2010) Comparative sequence analyses indicate that Coffea (Asterids) and Vitis (Rosids) derive from the same paleo-hexaploid ancestral genome. Molecular Genetics and Genomics 283:493-501.
Chaumont F, Barrieu F, Jung R, Chrispeels MJ (2000) Plasma membrane intrinsic proteins from maize cluster in two sequence subgroups with differential aquaporin activity. Plant Physiology 122:1025-1034.
Chaumont F, Barrieu F, Wojcik E, Chrispeels MJ, Jung, R (2001) Aquaporins constitute a large and highly divergent protein family in maize. Plant Physiology 125:1206-1215.
DaMatta F, Ramalho J (2006) Impacts of drought and temperature stress on coffee physiology and production: a review. Brazilian Journal Plant Physiology 18:55-81.
DaMatta FM, Chaves ARM, Pinheiro HA, Ducatti C, Loureiro ME (2003) Drought tolerance of two field-grown clones of Coffea canephora. Plant Science 164:111-117.
Danielson JAH, Johanson U (2008) Unexpected complexity of the Aquaporin gene family in the moss Physcomitrella patens. BMC Plant Biology 8:45.
Dias PC, Araujo WL, Moraes GABK, Barros RS, DaMatta FM (2007) Morphological and physiological responses of two coffee progenies to soil water availability. Journal of Plant Physiology 164:1639-1647.
Fahl JI, Carelli MLC, Gallo PB, Costa WM, Novo MCSS (1998) Enxertia de Coffea arabica sobre progênies de C. canephora e de C. congensis no crescimento, nutrição mineral e produção. Bragantia 52:297-312.
Fahl JI, Carelli MLC, Menezes HC, Gallo PB Trivelin PCO (2001)
Gas exchage, growth, yield and beverage quality of Coffea
arabica cultivars grafted on to C. canephora and C. congensis. Experimental Agriculture 37:241-252.
Fetter K, Van Wilder V, Moshelion M, Chaumont F (2004) Interactions between plasma membrane aquaporins modulate their water channel activity. Plant Cell 16:215-228.
Forrest KL, Bhave M (2008) The PIP and TIP aquaporins in wheat form a large and diverse family with unique gene structures and functionally important features. Functional and Integrative Genomics 8:115-133.
Galmes J, Pou A, Alsina MM, Tomas M, Medrano H, Flexas J (2007) Aquaporin expression in response to different water stress intensities and recovery in Richter-110 (Vitis sp.): relationship with ecophysiological status. Planta 226:671-681.
Guo L, Wang ZY, Lin H, Cui WE, Chen J, Liu MH, Chen ZL, Qu LJ, Gu H (2006) Expression and functional analysis of the rice plasma-membrane intrinsic protein gene family. Cell Research 16:277-286.
Gupta AB, Sankararamakrishnan R (2009) Genome-wide analysis of major intrinsic proteins in the tree plant Populus trichocarpa: Characterization of XIP subfamily of aquaporins from evolutionary perspective. BMC Plant Biology 9:134. doi: 10.1186/1471-2229-9-134
Guyot R, Lefebvre-Pautigny F, Tranchant-Dubreuil C, Rigoreau M, Hamon P, Leroy T, Hamon S, Poncet V, Crouzillat D, de Kochko A (2012) Ancestral synteny shared between distantly-related plant species from the asterid (Coffea canephora and Solanum sp.) and rosid (Vitis vinifera) clades. BMC Genomics 13: 103. doi: 10.1186/1471-2164-13-103.
Hachez C, Moshelion M, Zelazny E, Cavez D, Chaumont F (2006) Localization and quantification of plasma membrane aquaporin expression in maize primary root: A clue to understanding their role as cellular plumbers. Plant Molecular Biology 62:305-323.
Hall TA (1999) BioEdit: a user-friendly biological sequence alignment editor and analysis program for windows 95/98/NT. Nucleic Acids Symposium Series, pp.95-98.
Huang XQ (1992) A contig assembly program based on sensitive detection of fragment overlaps. Genomics 14:18-25.
Jang JY, Kim DG, Kim YO, Kim JS, Kang HS (2004) An expression analysis of a gene family encoding plasma membrane aquaporins in response to abiotic stresses in Arabidopsis thaliana. Plant Molecular Biology 54:713-725.
Jang JY, Lee SH, Rhee JY, Chung GC, Ahn SJ, Kang H (2007a) Transgenic Arabidopsis and tobacco plants overexpressing an aquaporin respond differently to various abiotic stresses. Plant Molecular Biology 64:621-632.
Jang JY, Rhee JY, Kim DG, Chung GC, Lee JH, Kang H (2007b) Ectopic expression of a foreign aquaporin disrupts the natural expression patterns of endogenous aquaporin genes and alters plant responses to different stress conditions. Plant and Cell Physiology 48:1331-1339.
Javot H, Lauvergeat V, Santoni V, Martin-Laurent F, Guclu J, Vinh J, Heyes J, Franck KI, Schäffner AR, Bouchez D, Maurel C (2003) Role of a single aquaporin isoform in root water uptake. Plant Cell 15:509-522.
Johanson U, Karlsson M, Johansson I, Gustavsson S, Sjovall S, Fraysse L, Weig AR, Kjellbom P (2001) The complete set of genes encoding major intrinsic proteins in arabidopsis provides a framework for a new nomenclature for major intrinsic proteins in plants. Plant Physiology 126:1358-1369.
Kaldenhoff R, Ribas-Carbo M, Flexas J, Lovisolo C, Heckwolf M, Uehlein N (2008) Aquaporins and plant water balance. Plant, Cell and Environment 31:658-666. doi: 10.1111/j.1365-3040.2008.01792.x
Katsuhara M, Akiyama Y, Koshio K, Shibasaka M, Kasamo K (2002) Functional analysis of water channels in barley roots. Plant and Cell Physiology 43:885-893.
Lashermes P, Combes MC, Robert J, Trouslot P, D’Hont A, Anthony F, Charrier A (1999) Molecular characterisation and origin of the Coffea arabica L. genome. Molecular and General Genetics 261:259-266.
Lian HL, Yu X, Ye Q, Ding XS, Kitagawa Y, Kwak SS, Su WA, Tang ZC (2004) The role of aquaporin RWC3 in drought avoidance in rice. Plant and Cell Physiology 45:481-489.
Lin CW, Mueller LA, McCarthy J, Crouzillat D, Petiard V, Tanksley SD (2005) Coffee and tomato share common gene repertoires as revealed by deep sequencing of seed and cherry transcripts. Theoretical and Applied Genetics 112:114-130.
Luu DT, Maurel C (2005) Aquaporins in a challenging environment: molecular gears for adjusting plant water status. Plant, Cell and Environment 28:85-96.
Mahdieh M, Mostajeran A, Horie T, Katsuhara M (2008) Drought stress alters water relations and expression of PIP-type aquaporin genes in Nicotiana tabacum plants. Plant and Cell Physiology 49:801-813.
Manuel Ruiz-Lozano J, del Mar Alguacil M, Barzana G, Vernieri P, Aroca R (2009) Exogenous ABA accentuates the differences in root hydraulic properties between mycorrhizal and non mycorrhizal maize plants through regulation of PIP aquaporins. Plant Molecular Biology 70:565-579.
Martre P, Morillon R, Barrieu F, North GB, Nobel PS, Chrispeels MJ (2002) Plasma membrane aquaporins play a significant role during recovery from water deficit. Plant Physiology 130:2101-2110.
Maurel C, Verdoucq L, Luu D-T, Santoni, V (2008) Plant aquaporins: Membrane channels with multiple integrated functions. Annual Review of Plant Biology 59:595-624.
Mondego JMC, Vidal RO, Carazzolle MF, Tokuda EK, Parizzi LP, Costa GG, Pereira LF, Andrade AC, Colombo CA, Vieira LG, Pereira GA, Brazilian Coffee Genome Project Consortium (2011) An EST-based analysis identifies new genes and reveals distinctive gene expression features of Coffea arabica and Coffea canephora. BMC Plant Biology 11:30. doi: 10.1186/1471-2229-11-30.
Moraes MV, Franco CM (1973) Método expedito para enxertia em café. Instituto Brasileiro do Café, Rio de Janeiro. 8p.
Morais H, Caramori PH, Koguishi MS, Ribeiro AMA (2008) Detailed phenological scale of the reproductive phase of Coffea arabica. Bragantia 67:257-260.
Park W, Scheffler BE, Bauer PJ, Campbell BT (2010) Identification of the family of aquaporin genes and their expression in upland cotton (Gossypium hirsutum L.). BMC Plant Biology 10:142. doi: 10.1186/1471-2229-10-142
Peng Y, Lin W, Cai W, Aroca R (2007) Overexpression of a Panax ginseng tonoplast aquaporin alters salt tolerance, drought tolerance and cold acclimation ability in transgenic Arabidopsis plants. Planta 226:729-740.
Pinheiro HA, DaMatta FM, Chaves ARM, Loureiro ME, Ducatti C (2005) Drought tolerance is associated with rooting depth and stomatal control of water use in clones of Coffea canephora. Annals of Botany 96:101-108.
Postaire O, Tournaire-Roux C, Grondin A, Boursiac Y, Morillon R, Schaeffner AR, Maurel C (2010) A PIP1 aquaporin contributes to hydrostatic pressure-induced water transport in both the root and rosette of Arabidopsis. Plant Physiology 152:1418-1430.
Rezaian MA, Krake LR (1987) Nucleic-acid extraction and virus detection in grapevine. Journal of Virological Methods 17:277-285
Sakurai J, Ahamed A, Murai M, Maeshima M, Uemura M (2008) Tissue and cell-specific localization of rice aquaporins and their water transport activities. Plant and Cell Physiology 49:30-39.
Santos AB, Mazzafera P (2012) Dehydrins are highly expressed in water-stressed plants of two coffee species. Tropical Plant Biology 5:218-232.
Schaffner AR (1998) Aquaporin function, structure, and expression: are there more surprises to surface in water relations? Planta 204:131-139.
Shelden MC, Howitt SM, Kaiser BN, Tyerman SD (2009) Identification and functional characterisation of aquaporins in the grapevine, Vitis vinifera. Functional Plant Biology 36:1065-1078.
Siefritz F, Tyree MT, Lovisolo C, Schubert A, Kaldenhoff R (2002) PIP1 plasma membrane aquaporins in tobacco: from cellular effects to function in plants. Plant Cell 14:869-876.
Smart LB, Moskal WA, Cameron KD, Bennett AB (2001) MIP genes are down-regulated under drought stress in Nicotiana glauca. Plant and Cell Physiology 42:686-693.
Smith AW (1989) Introduction. In Clarke RJ and Macrae R, editors. Coffee. London: Elsevier. pp.1-41.
Tamura K, Dudley J, Nei M, Kumar S (2007) MEGA4: Molecular evolutionary genetics analysis (MEGA) software version 4.0. Molecular Biology and Evolution 24:1596-1599.
Thompson JD, Higgins DG, Gibson TJ (1994) ClustalW - improving the sensitivity of progressive multiple sequence alignment through sequence weighting, position-specific gap penalties and weight matrix choice. Nucleic Acids Research 22:4673-4680.
Vandeleur RK, Mayo G, Shelden MC, Gilliham M, Kaiser BN, Tyerman SD (2009) The role of plasma membrane intrinsic protein aquaporins in water transport through roots: diurnal and drought stress responses reveal different strategies between isohydric and anisohydric cultivars of grapevine. Plant Physiology 149:445-460.
Vidal RO, Mondego JMC, Pot D, Ambrosio AB, Andrade AC, Pereira LF, Colombo CA, Vieira LGE, Carazzolle MF, Pereira GAG (2010) A high-throughput data mining of single nucleotide polymorphisms in coffea species expressed sequence tags suggests differential homeologous gene expression in the allotetraploid Coffea arabica. Plant Physiology 154:1053-1066.
Vieira LGE, Andrade AC, Colombo CA, Moraes AHA et al. (2006) Brazilian coffee genome project: an EST-based genomic resource. Brazilian Journal Plant Physiology 18:95-108.
Wudick MM, Luu DT, Maurel C (2009) A look inside: localization patterns and functions of intracellular plant aquaporins. New Phytologist 184:289-302.
Zardoya R (2005) Phylogeny and evolution of the major intrinsic protein family. Biology of the Cell 97:397-414.