Influence of
Fusarium
spp. isolate and inoculum density on
resistance screening tests in onion
Pablo Fernando Caligiore Gei1, Jorge Gustavo Valdez1, Ricardo José Piccolo1 & Claudio Rómulo
Galmarini1,2
1Estación Experimental Agropecuaria La Consulta, Instituto Nacional de Tecnología Agropecuaria (INTA), Ruta 40 s/n C.C.
8 (5567), La Consulta, Mendoza, Argentina; 2Consejo Nacional de Investigaciones Científicas y Técnicas, Av. Rivadavia
1917 (C1033AAJ) Ciudad Autónoma de Buenos Aires, Argentina
Author for correspondence: Pablo Fernando Caligiore Gei, e-mail: pcaligioregei@laconsulta.inta.gov.ar
Part of the first author’s Ph.D. thesis. PROBIOL, UNCuyo, Argentina.
ABSTRACT
Fusarium basal rot (FBR), which is caused predominantly by Fusarium oxysporum and F. proliferatum, is the main limiting factor of onion crops. Resistant cultivars obtained in other countries do not behave as such in Argentina crop fields. The cultivars Antártica-INTA, Grano de Oro-Seminis, Valcatorce-INTA and TW-2007 (reported as tolerant) were tested with five Fusarium spp. isolates, using four inoculum concentrations. Disease incidence was recorded along 28 days and the area under disease progress curve was calculated. Diverse epidemiological models were fitted to experimental data. There were significant differences in the resistance level among cultivars, with TW-2007 being the most tolerant. Local Fusarium isolates were the most virulent ones. The concentration of 10,000 microconidia/ gram was the most lethal for all isolates. The absence of resistance to Fusarium in the four cultivars tested was confirmed. Inoculum concentration and isolate are critical factors in screening for resistance to FBR. Breeding based on the selection of genotypes against low virulence strains of Fusarium spp. and the presence of more aggressive strains in local fields may be one of the causes why varieties reported as resistant or tolerant behave as susceptible in our environment.
Key words: Allium cepa, breeding, Fusarium basal rot, inoculum concentration.
INTRODUCTION
Onion (Allium cepa L.) is an important vegetable
crop in Argentina, where 24,500 hectares are cultivated every year, being one the main exported vegetables (Poggi, 2011). The Fusarium complex, usually present in the crop
areas, is the most serious pathogen. Fusarium spp. are the
causal agents of Fusarium basal rot (FBR) and contribute to the development of damping-off in seedlings (Abawi & Lorbeer, 1972). In severe cases it becomes a crop-limiting factor, also producing yield losses in storage. F. oxysporum
f.sp. cepae W.C. Snyder & H.N. Hansen (1940) and F. proliferatum (Matsush.) Nirenberg ex Gerlach & Nirenberg
(1982) (Salvalaggio & Ridao, 2013) are the main causal agents of FBR in Argentina.
Several experiments have reported different reactions of onion genotypes to F. oxysporum f. sp. cepae
(Apaza & Mattos, 2000; Lopez & Cramer, 2004; Özer et al., 2004; Saxena & Cramer, 2009), of onion and welsh onion (Allium fistulosum L.) to F. oxysporum and F. verticillioides
(Dissanayake et al., 2009), and of onion and related Allium
species to F. oxysporum and F. proliferatum (Galván et al.,
2008).
Because of the poor efficiency of fungicidal treatments, the use of resistant cultivars is the most effective method to reduce FBR incidence in onion crops (De Visser et al., 2006). In Argentina there are no FBR-resistant varieties available, but the presence of moderate levels of resistance may reduce infection and minimize yield losses (Cramer, 2000). During the last decade some cultivars from the northern hemisphere considered as tolerant in their place of origin were tested in field trials carried out at the EEA La Consulta (INTA), Mendoza, Argentina. The results have proved that these varieties do not display a better performance than the local cultivars and seem to be as susceptible as them. Simultaneously, it has been demonstrated (Valdez et al., 2007) that Fusarium spp.
isolates diverge in their levels of virulence when tested in onion seedlings, but the existence of specific interactions between isolates and onion cultivars remains unknown.
Currently there is no information about the level of
Fusarium inoculum densities in local soils cropped with Allium spp. Studies carried out in other countries (Abawi
& Lorbeer, 1972; Marois & Mitchell, 1981) have shown a direct correlation between inoculum density of Fusarium oxysporum f. sp. cepae and FBR incidence in onion
seedlings. In other pathosystems, it has been demonstrated
that greater inoculum densities of Fusarium spp. influence
directly on the final incidence level of the disease and the appearance of early symptoms (Ben Yephet et al., 1994; Marois & Mitchell, 1981).
The goals of the present work were: (1) to evaluate four onion cultivars for their resistance to Fusarium spp.
isolates under laboratory conditions, to detect possible FBR-resistant genotypes and isolate-cultivar interactions; (2) to test the virulence of five fungal isolates; (3) to evaluate the influence of the inoculum density on the expression of the disease; (4) to analyse disease progression by the adjustment of mathematical models.
MATERIAL AND METHODS
Fusarium isolates and inoculum preparation
Four onion pathogenic Fusarium spp. isolates were
selected from the fungal collection of Laboratorio José Crnko, INTA EEA La Consulta (acronym ‘LJC’). Species identification and place of origin are presented in Table 1. The isolates were initially obtained from basal rotten onion bulbs collected in different regions of Argentina. A fifth isolate, LJC 10161 Fo (initially denominated FOC-Tx1b, origin Wisconsin, USA) was included in the assay because of its common origin with the TW-2007 cultivar. The fungal colonies were grown on potato dextrose agar (PDA, Difco) at 28ºC for ten days. Microconidial suspensions were obtained as follows: mycelium collected from the petri dish
was suspended in sterile distilled water, filtered through sterilized cotton filters and then microscopically quantified using a hemocytometer.
Soil substrate inoculation
An oven-sterilized mixture of sand-peat moss in equal parts, which was used as substrate, was inoculated with four densities: 10000, 1000, 100 and 10 microconidia/g of substrate. The adjusted suspensions of Fusarium spp. were
inoculated together with the initial irrigation. The substrate was then mixed thoroughly and each sterilized plastic pan (24×16×4 cm) was filled with 1.2 kg of substrate, following the protocol of Havey (1997).
Cultivars tested
Three Argentinian onion cultivars (Antártica INTA, Grano de Oro-Seminis, and Valcatorce INTA) and one North American variety, previously considered as tolerant to FBR in its place of origin (TW-2007), were evaluated. Seeds were surface sterilized (rinsed in 70% ethanol for 30 seconds; rinsed in 1% commercial bleach for 5 minutes; washed with sterile water and air dried) and sown in pans (twenty seeds of each cultivar per pan), with six replicates for each treatment. The whole experiment was performed in a growth chamber at 27ºC, which is within the optimal temperature range for Fusarium development (Abawi &
Lorbeer, 1972). The pans were drenched periodically with sterile distilled water in order to keep the humidity of the
Fusariumisolate
LJC 10017 Fo1 LJC 10002 Fv LJC 10081 Fo LJC 10054 Fp LJC 10161 Fo
F. oxysporum F. verticillioides F. oxysporum F. proliferatum F. oxysporum LJC Number
Species identification
Origin San Juan,
Argentina San Juan, Argentina Buenos Aires, Argentina Mendoza, Argentina Wisconsin, USA AUDPC mean2 10.53 a (0.2523)3 10.08 ab (0.3209) 9.97 ab (0.2007) 9.51 bc (0.3236) 9.16 c (0.2431)
Inoculum concentration (microconidia/g)
10000 11.36 a (0.2132)
1000 10.38 b (0.1977)
100 9.08 c (0.3333)
10 8.57 c (0.3589)
Onion cultivar
Antártica INTA 10.80 a (0.2309) Valcatorce INTA 10.26 a (0.2476) Grano de Oro-Seminis 10.19 a (0.2748) TW-2007 8.14 b (0.4339)
10.11 a 10.21 a 10.25 a 11.54 a 11.33 a 11.09 a 10.92 a 8.78 b 11.34 a 10.48 a 10.09 ab 8.41 b 11.18 a 10.17 ab 9.86 ab 9.09 b 10.95 a 10.36 a 10.35 a 8.21 b 10.71 a 10.24 a 10.37 a 8.55 b 12.62 a 9.89 b 8.13 c 7.39 c 10.96 a 9.55 a 10.06 a 7.45 b 11.79 a 10.95 a 6.61 b 7.28 b 9.81 a 10.23 a 9.77 a 6.82 b
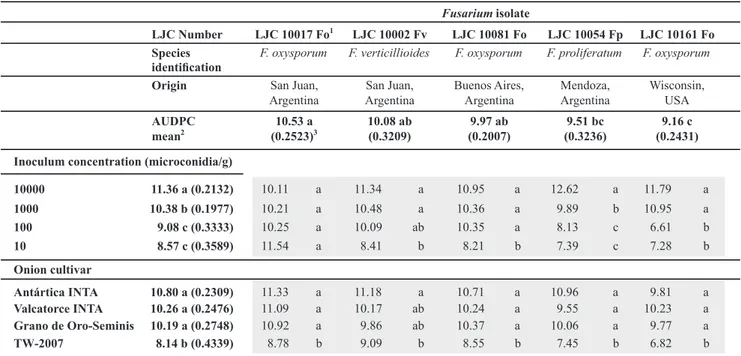
TABLE 1 - Characteristics of Fusarium isolates tested in this study and mean AUDPC values at 28 days after inoculation. Shaded cells contain the AUDPC values corresponding to the interactions between variables, and the letters express comparisons among inoculum concentrations and cultivars for the same Fusarium isolate.
1Fo: Fusarium oxysporum; Fp: F. proliferatum; Fv: F. verticillioides.
substrate. Six pans with sterile non inoculated substrate were used as controls to determine percent emergence 14 days after sowing.
Data recording and statistical analysis
The experimental design consisted of three factors: onion cultivar (four levels), Fusarium isolate (five levels) and inoculum concentration (four levels). The number of healthy plants was recorded along 28 days (10, 13, 17, 20, 24 and 28 days after sowing). The emergence data obtained from the control pans, expressed as percentage, was used to transform the records and make them comparable. They were then converted into incidence (I) and this variable was related with time to describe a disease progress curve. The area under the disease progress curve (AUDPC) was calculated through the polygon method (Campbell & Madden, 1990) and subjected to analysis of variance (ANOVA). In addition, the incidence data were linearized and linear regression analysis was performed to obtain the parameters of three classical epidemiological models: monomolecular, logistic and Gompertz (Madden et al., 2007). Residuals, graphic fit to experimental data and R2 values were considered for model
selection. The apparent infection rate (slope) parameter of the equation for every replicate was determined from linearized data. The slopes were then analyzed by ANOVA and used for back-transformation to build a simulated disease progress curve (considered initial incidence y0=0.0001; y0*=ln[(y0/(1-
y0)]).
The time required to reach a certain level of incidence (ty, where y is the incidence and t is the time it takes to reach y) can be considered as a measure to differentiate an isolate’s
virulence and the influence of inoculum concentration. Ty
is clearly inversely related to the slope parameter (Madden et al., 2007). Three ty were calculated: t25, t50 and t75 for
each Fusarium isolate and inoculum concentration, using
the following equation: ty= (y0*-y*)/r (considered initial
incidence y0=0.0001; y0*=ln[(y0/(1- y0)]; y*=ln[(y/(1- y)],
with ‘r’ being the apparent infection rate from the linear regression analysis adjusted for the logit transformed data). All data analyses, statistical assessments and model adjustments were performed using the InfoStat Software (Di Rienzo et al., 2010). In all cases Microsoft Excel was used to build the graphics.
RESULTS
AUDPC analysis
The coefficient of variation (CV) for the entire experiment was 0.2729. The results showed highly significant effects of the isolate (p=0.0053), cultivar (p<0.0001), inoculum density (p<0.0001) and the interaction isolate × inoculum density (p<0.0001). The interactions isolate × cultivar (p=0.7020) and cultivar × inoculum density (p=0.6627) were not significant. Table 1 shows the results for the interactions between treatments and factors included. AUDPC means for every isolate are compared along the
vertical columns and are also graphically displayed in Figure 1.
Cultivar performance
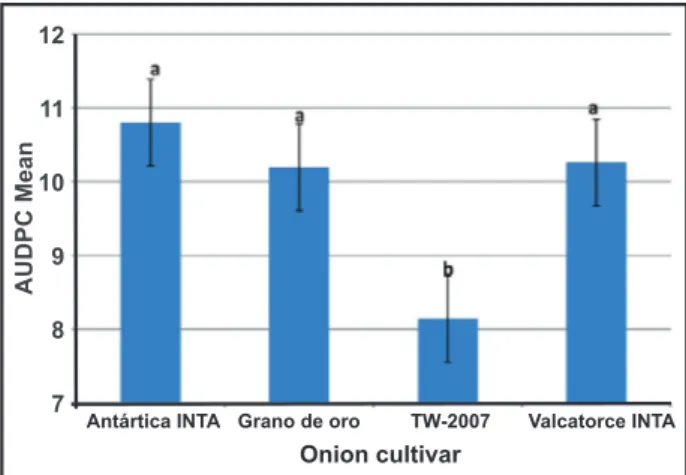
The cultivar TW-2007 was significantly less infected than the other cultivars in relation to all isolates, whereas higher AUDPC were expressed by Antártica INTA, Valcatorce INTA and Grano de Oro-Seminis (Figure 2). These varieties were equally susceptible to the disease. Remarkably, TW-2007 developed its best performance against the LJC10161 Fo isolate from Wisconsin, USA (Table 1; Figure 4).
Aggressiveness of Fusarium isolates
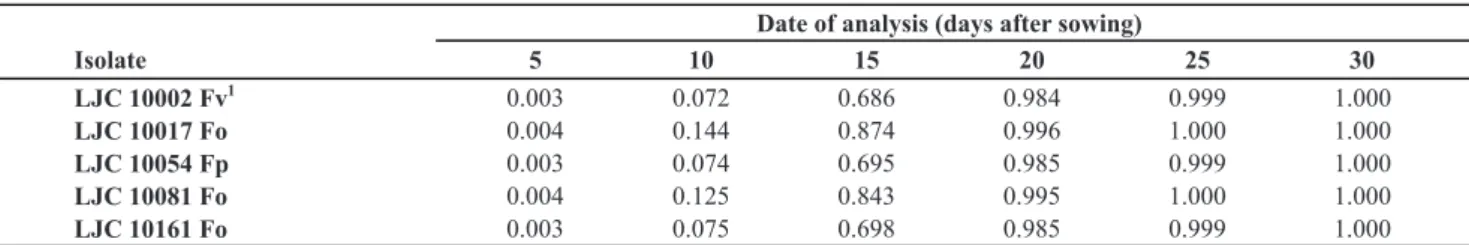
Within four weeks, all isolates produced a high disease incidence in seedlings, reaching levels close to 100% at the last day of the trial (day 28; Table 2). LJC10017 Fo was the most aggressive isolate (Table 1; Figure 1) for all the cultivars (Figure 4) while LJC 10161 Fo was the least
11
10
9
8
AUDPC Mean
LJC 10002 LJC 10017 LJC 10054 LJC 10081 LJC 10161
Fusarium isolate
FIGURE 1 - AUDPC means arranged by Fusarium isolate (Duncan’s test, α=0.05). Vertical bars represent the standard error.
AUDPC Mean
12
11
10
9
8
7
Antártica INTA Grano de oro TW-2007 Valcatorce INTA
Onion cultivar
aggressive. The other three isolates produced intermediate AUDPC means (Figure 1).
Influence of inoculum density
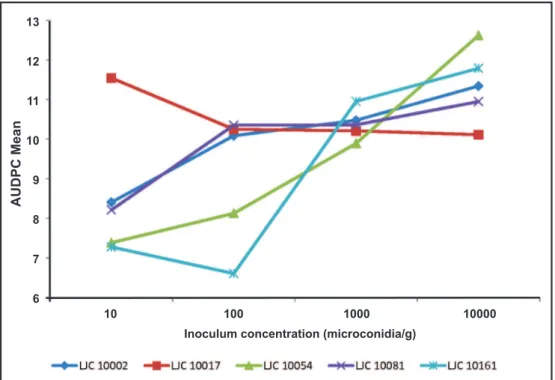
The inoculum concentration of 10000 microconidia/g of substrate produced the highest level of AUDPC, whereas pans with 1000 microconidia/g had an intermediate level. Concentrations of 10 and 100 microconidia/g did not differ between them and produced the lowest AUDPC (Table 1; Figure 3). The isolate LJC 10017 Fo performed as the most aggressive even at inoculum densities as small as 10 microconidia/g (Figure 5). Figure 5 also shows that microconidial concentration of the substrate is in direct function with the increase in disease incidence. Note that less virulent strains (LJC 10054 Fp and LJC 10161 Fo) display clearly higher AUDPC values when inoculum concentrations are increased.
Model fitting
The logistic model fitted better than the monomolecular and Gompertz models, based on the residual plots and R2 values (data not shown). Consequently, the
logistic model was chosen for further analysis. Q-Q plot graphics examination confirmed the presumption of data
normality (data not shown). The logistic integrated model represents the disease incidence y at a given time t as
follows: y=1/[1+exp(-y0*+rL×t)], rL=rate (Madden et al.,
2007). The adjusted curves for each inoculum concentration are displayed in Figure 6. Different curves in the same plot represent each of the five Fusarium isolates incidence
13
12
11
10
9
8
7
AUDPC Mean
Inoculum concentration (microconidia/g) 10 100 1000 10000
FIGURE 3 - AUDPC means arranged by inoculum concentration (Duncan’s test, α=0.05). Vertical bars represent the standard error. Date of analysis (days after sowing)
Isolate 5 10 15 20 25 30
LJC 10002 Fv 1
0.003 0.072 0.686 0.984 0.999 1.000
LJC 10017 Fo 0.004 0.144 0.874 0.996 1.000 1.000
LJC 10054 Fp 0.003 0.074 0.695 0.985 0.999 1.000
LJC 10081 Fo 0.004 0.125 0.843 0.995 1.000 1.000
LJC 10161 Fo 0.003 0.075 0.698 0.985 0.999 1.000
1Fo: Fusarium oxysporum; Fp: F. proliferatum; Fv: F. verticillioides.
TABLE 2 - Mean incidence of the Fusarium isolates related to date of analysis, based on the adjusted logistic equation for each isolate.
12
11
10
9
8
7
6
AUDPC Mean
Antártica INTA Grano de oro TW-2007 Valcatorce INTA
Onion cultivar
FIGURE 5 - Interaction between Fusarium isolates and inoculum concentrations.
13
12
11
10
9
8
7
6
AUDPC Mean
10 100 1000 10000
Inoculum concentration (microconidia/g)
FIGURE 6 - Disease progression adjusted by the logistic model. Partitions by inoculum concentration and Fusarium isolate. 1,000
0,900
0,800
0,700
0,600
0,500
0,400
0,300
0,200
0,100
0,000
1,000
0,900
0,800
0,700
0,600
0,500
0,400
0,300
0,200
0,100
0,000
Disease incidente
Disease incidente
5 10 15 20 25 30
1000 microconidia/g
5 10 15 20 25 30
5 10 15 20 25 30 5 10 15 20 25 30
10000 microconidia/g
Time (days after sowing) Time (days after sowing)
progression. Since greater inoculum concentrations increase the ability of the isolates to produce disease, the different curves become closer as the microconidial density rises. The main reason is that the slope value for each model is up-modified with higher inoculum concentrations (see Table 3).
Slope comparison
The slopes of the adjusted equations for each isolate-concentration interaction were evaluated by ANOVA (CV= 0.1640). The results are shown in Table 3. In agreement with the AUDPC results, concentrations of 10000 and 1000 microconidia/g led to an increase in the apparent disease rate, while concentrations of 10 and 100 microconidia/g had significantly lower rate values and did not differ between them. At low densities less virulent isolates had lower disease rates. This can be seen graphically in Figure 6, where greater rates are expressed as curves that begin to increase earlier in time with respect to the less virulent isolates.
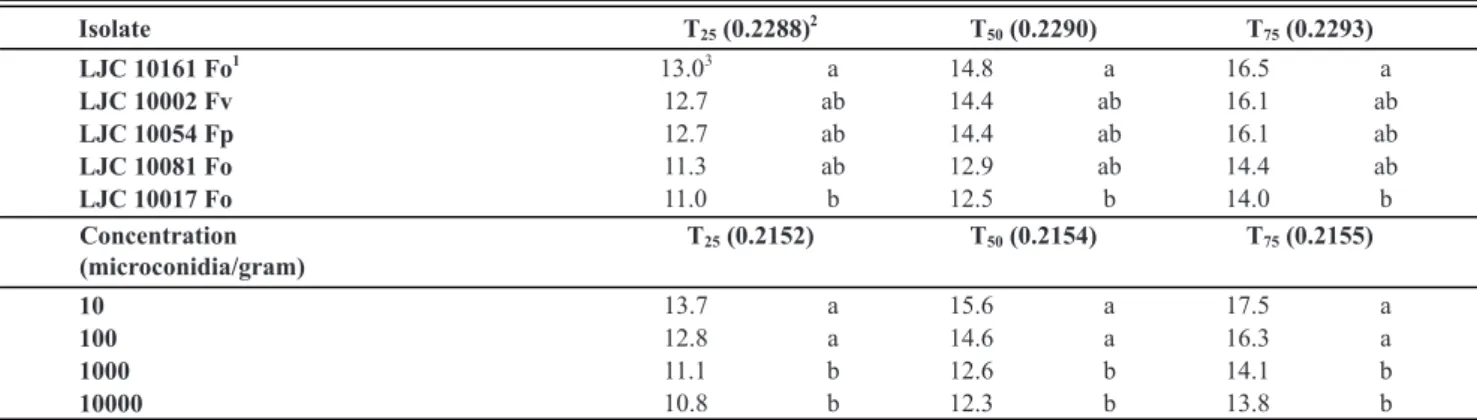
Ty comparisons
There were significant differences among isolates and concentrations. Results are presented in Table 4.
Isolate
LJC 10017 Fo
1
0.743
2
LJC 10081 Fo 0.726
LJC 10161 Fo 0.670
LJC 10054 Fp 0.669
LJC 10002 Fv 0.666
Concentration (microconidia/g)
10000 1000 100 10
0.753 a 0.735 a 0.663 b 0.629 b
a 0.737 a 0.747 a 0.748 a 0.740 a
ab 0.752 a 0.752 a 0.748 a 0.653 a
b 0.732 a 0.663 b 0.663 ab 0.607 a
b 0.792 a 0.783 a 0.542 b 0.563 a
b 0.752 a 0.730 a 0.613 ab 0.580 a
TABLE 3 - Analysis of variance of the mean slope coefficients (rates) for the linearized logistic model. Grey colored cells contain the mean slope values corresponding to the interactions between variables, and the letter express comparisons among Fusarium isolates for the same inoculum concentration. The numbers that appear in the non-colored cells correspond to the general mean values for the isolate and concentration variables.
1Fo: Fusarium oxysporum; Fp: F. proliferatum; Fv: F. verticillioides.
2Mean slope values followed by the same letter are not statistically distinct (p≤0.05). Comparisons by Duncan’s test (α=0.05).
LJC 10161 Fo was confirmed as the less virulent isolate, producing the given disease level later than the other isolates. The most aggressive isolate (LJC 10017 Fo) caused the same given incidence two to two and a half days before LJC 10161 Fo. The almost constant relationship among t25,
t50 and t75 values for each isolate indicates that the disease
curves approximate to a linear increase at the testing times (ie, the slope is virtually a constant; Figure 7). The same
occurred with inoculum concentrations: the greater the density, the earlier the disease begins to develop. Note in Table 4 that with 10 microconidia/g, the time necessary to reach an incidence of 25% is practically the same that takes to reach an incidence of 75% if the substrate is inoculated with 10000 microconidia/g.
DISCUSSION
The most virulent isolates are aggressive both at low or high inoculum densities. This is consistently clear in LJC 10017 Fo and LJC 10081 Fo, as it is observed in Figure 7. Their intrinsic ability to cause disease was not influenced by the level of inoculum in the substrate. The aggressiveness of
Isolate T25(0.2288)
2
T50(0.2290) T75(0.2293)
LJC 10161 Fo 1
13.0 3
a 14.8 a 16.5 a
LJC 10002 Fv 12.7 ab 14.4 ab 16.1 ab
LJC 10054 Fp 12.7 ab 14.4 ab 16.1 ab
LJC 10081 Fo 11.3 ab 12.9 ab 14.4 ab
LJC 10017 Fo 11.0 b 12.5 b 14.0 b
Concentration
(microconidia/gram)
T25(0.2152) T50(0.2154) T75(0.2155)
10 13.7 a 15.6 a 17.5 a
100 12.8 a 14.6 a 16.3 a
1000 11.1 b 12.6 b 14.1 b
10000 10.8 b 12.3 b 13.8 b
TABLE 4 - T25, T50 and T75 comparison among isolates and inoculum concentrations. Time values are expressed in days after sowing.
1Fo: Fusarium oxysporum; Fp: F. proliferatum; Fv: F. verticillioides. 2Coefficients of variation are expressed between parentheses.
the most virulent isolate (LJC 10017 Fo) is independent from the inoculum concentration. This is of special interest in onion genotypes characterization as sources of resistance to FBR. In greenhouse screening tests for resistance of onion genotypes, the use of high inoculum concentrations is preferable in order to avoid false positives. This is highly recommended especially when the virulence of a given isolate is variable and strongly dependent of the inoculum density, as shown here for isolates LJC 10161 Fo and LJC 10054 Fp. Accordingly, Cramer (2000) stated that high inoculum concentrations such as 10000 spores/g of sand were best for screening tests.
Since the statistical interaction between Fusarium
isolates and onion cultivars was not significant, it is postulated that the differences in the expression of FBR might have been caused mostly by a differential virulence of the isolates but not by specific interactions with a particular cultivar. However, the presence of a complex multigenic relationship between host and pathogen (Saxena & Cramer, 2009) suggests that increasing the number of tested isolates and onion genotypes in the assays would lead to more accurate conclusions about the presence of specific interactions. Although the genetics of the interaction between onion and Fusarium remains unknown
(Cramer, 2000), some studies have found significance in the fungus-host interactions (Galván et al., 2008; Saxena & Cramer, 2009), while others have not (Taylor et al., 2013).
The fitted logistic model described the experimental process accurately and could be used in future tests to compare a given isolate in relation to the strains assessed here. Cultivar screening tests for resistance to Fusarium basal rot are also enriched by the use of these models that could predict certain parameters and establish, for example, the most suitable time to evaluate incidence.
The lack of resistance to FBR caused by Fusarium
strains in the four cultivars tested was confirmed. Only TW-2007 showed tolerance, in the sense that AUDPC means were
lower than those produced in the other cultivars, suggesting the activation of resistance mechanisms, but not enough to achieve complete resistance, at least in the interaction with the Argentinian isolates. This supports field observations where this North American cultivar has proved to be as susceptible as the cultivars Antártica INTA, Grano de Oro-Seminis and Valcatorce INTA. Possibly the local environment and specially the field soil characteristics may give optimal conditions for FBR development. In agreement with the results presented here, De Visser et al. (2006) claimed that tolerance relies heavily on soil and climate conditions, inoculum density and virulence of the existing isolates. TW-2007 showed tolerance to isolate LJC 10161 (F. oxysporum), probably because of its lower
aggressiveness and its common origin with that onion cultivar. The fact that this variety has been catalogued as tolerant could be the result of its selection in the same environment, and a breeding program using less aggressive fungal strains than those which are present in Argentina. In fact, this could also explain the susceptibility of TW-2007 in local fields because of the higher virulence of the native Fusarium spp. isolates.
The presence of nonpathogenic Fusarium strains in the soil
and their antagonism in relation to the virulent isolates may also play an important role in disease expression, as shown in other Fusarium pathosystems such as tomato, watermelon and
pea (Trillas & Segarra, 2009).
According to the prevalent conditions during the experimental trial, the cultivar Grano de Oro- Seminis did not show tolerance as it did under previous field tests (Prioletta et al., 2005). Moreover, it was as susceptible as Antártica INTA. Plants classified as resistant in open field conditions may not have a biochemical resistance, but an escape mechanism, perhaps linked to an increased emission of roots after the infection. The improved ability to form roots could make a difference in terms of tolerance to Fusarium (Galván et al., 2008) and become the main
target of breeding programs.
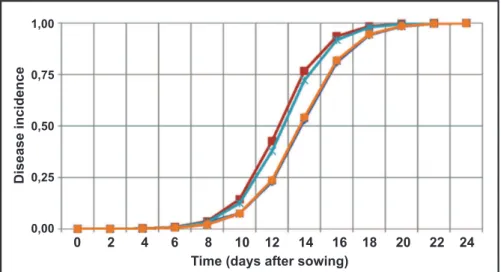
1,00
0,75
0,50
0,25
0,00
Time (days after sowing)
Disease incidence
0 2 4 6 8 10 12 14 16 18 20 22 24
The response of onions seedlings to different inoculum densities are largely consistent with that reported by Abawi & Lorbeer (1972), who observed a high disease incidence when sterile soil was artificially inoculated with
Fusarium from 100 propagules/g compared with unsterilized
natural soil. This suggests that the assessment of onion varieties in substrates inoculated only with Fusarium results in a bias
from what happens in field areas, where competition with other organisms and the presence of biocontrol agents might reduce the ability of the pathogen to infect seedlings.
Methods used for genotype evaluation are currently under discussion in the onion breeding community. There is neither an effective nor a reliable technique for testing the pathogenicity of Fusarium to onion in vivo (De Visser et al.,
2006). According to the FBR resistance evaluation protocol used (Havey, 1997), disease incidence data should be recorded 21 or 28 days after sowing. According to the results in our assay conditions, the best moment to verify differences in resistance/susceptibility/tolerance of genotypes would be day 15, ie, the second week of evaluation. The importance of
the recording day has been described before (Cramer, 2000). Certain genotypes rated as resistant at 14 days after inoculation can be considered susceptible if the record is made in the 28th
of the trial. During the third and fourth weeks, since incidence levels are very high, it becomes difficult to discriminate among the tested accessions.
High inoculum densities should be used in onion screening trials to avoid the effects of less virulent isolates. In our conditions, all the isolates had a clear tendency to behave as virulent at high concentrations and hence the possible interactions between cultivars and inoculum concentrations are minimized.
The technique used for the selection of genetic material is critical for any breeding program. The results obtained in our test conditions confirmed that the inoculum concentration in the substrate and the isolate used are critical factors in the evaluation. Breeding based on the selection of genotypes against low virulence strains of Fusarium spp. may be one of
the causes for which varieties reported as resistant or tolerant are susceptible when they are exposed to more aggressive strains or disease-prone environments.
AKNOWLEDGEMENTS
The authors wish to thank Dr. Pablo Asprelli for discussing the data and making helpful suggestions in the statistical analysis of the results. Also to the crew of Laboratorio José Crnko who contributed with resources and procedures to make this work possible.
REFERENCES
Abawi GS, Lorbeer JW (1972) Several aspects of the ecology and pathology of Fusarium oxysporum f. sp. cepae. Phytopathology 62:870-876.
Apaza WE, Mattos L (2000) Reaction of onion cultivars to basal plate rot caused by Fusarium oxysporum f. sp. cepae. Fitopatología 35:231-236.
Ben Yephet Y, Reuven M, Genizi A (1994) Effects of inoculum depth and density on Fusarium wilt in carnations. Phytopathology 84:1393-1398.
Campbell CL, Madden LV (1990) Introduction to Plant Disease Epidemiology. New York NY, USA. Wiley.
Cramer CS (2000) Breeding and genetics of Fusarium basal rot resistance in onion. Euphytica 115:159-166.
De Visser C, Van den Broek R, Van den Brink L (2006) Fusarium basal rot in the Netherlands. Vegetable Crops Research Bulletin 65:5-16.
Di Rienzo JA, Casanoves F, Balzarini MG, Gonzalez L, Tablada M, Robledo CW (2010) InfoStat Versión 2010. Córdoba Argentina. Grupo InfoStat, FCA, Universidad Nacional de Córdoba.
Dissanayake M, Kashima R, Tanaka S, Ito S-I (2009) Pathogenic variation and molecular characterization of Fusarium species isolated from wilted Welsh onion in Japan. Journal of General Plant Pathology 75:37-45.
Galván GA, Koning-Boucoiran CFS, Koopman WJM, Burger-Meijer K, González PH, Waalwijk C, Kik C, Scholten OE (2008) Genetic variation among Fusarium isolates from onion, and resistance to Fusarium basal rot in related Allium species. European Journal of Plant Pathology 121:499-512.
Havey MJ (1997) Screening onion for resistence to Fusarium oxysporum f.sp. cepa. Available at: http://haveylab.hort.wisc. edu/. Accessed on December 1, 2010.
Lopez JA, Cramer CS (2004) Screening short-day onion varieties for resistance to Fusarium basal rot. Acta Horticulturae 637:169-173.
Madden LV, Hughes G, Van den Bosch F (2007) The Study of Plant Disease Epidemics. St Paul MN, USA. APS Press.
Marois JJ, Mitchell DJ (1981) Effects of fumigation and fungal antagonists on the relationships of inoculum density to infection incidence and disease severity in Fusarium crown rot of tomato. Phytopathology 71:167-170.
Özer N, Köycü ND, Chilosi G, Magro P (2004) Resistance to Fusarium basal rot of onion in greenhouse and field and associated expression of antifungal compounds. Phytoparasitica 32:388-394. Poggi MT (2011) Informe Estadístico de Exportaciones Argentinas: Frutas y Hortalizas. Available at: http://www.exportar.org.ar/ download.php?st=pub&fid=337534fe84540d9fb95f4ea619c1957 4.pdf&mn=39final.pdf. Accessed on July 10, 2011.
Prioletta S, García CD, Bellacomo MC (2005) Comportamiento de materiales genéticos de cebolla frente a la Podredumbre basal (Fusarium oxysporum f. sp. cepae). In: XIII Congreso Latinoamericano de Fitopatología, Abstracts... Villa Carlos Paz Argentina. Sociedade Latinoamericana de Fitopatología. p. 314. Salvalaggio AE, Ridao AC (2013) First report of Fusarium proliferatum causing rot on garlic and onion in Argentina. Plant Disease 97:556-556.
Taylor A, Vagany V, Barbara DJ, Thomas B, Pink DAC, Jones JE, Clarkson JP (2013) Identification of differential resistance to six Fusarium oxysporum f. sp. cepae isolates in commercial onion cultivars through the development of a rapid seedling assay. Plant Pathology 62:103-111.
Trillas MI, Segarra G (2009) Interactions between nonpathogenic fungi and plants. Advances in Botanical Research 51:321-359. Valdez JG, Salvalaggio AE, Ridao AC (2007) Pathogenicity of Fusarium spp. isolates in onion (Allium cepa L.) seedlings. In: 5th International ISHS Symposium on Edible Alliaceae. Dronten The Netherlands.