ABSTRACT: Lipids have been used in ruminant feed to replace high amounts of grain for increas-ing the diet energy density, performance and meat quality. This study evaluated the qualitative characteristics of meat from feedlot heifers fed with sources of lipid supplements. Twenty-one crossbred heifers (¼Nelore × ¼Santa Gertrudis × ½Braunvieh) were used. Each heifer received 60 % forage with a base of corn silage and 40 % concentrate, resulting in 5.8 % lipid content in the total diet. The following sources of lipids were used: soybeans, protected fat and soybean oil. There were no differences on physical characteristics of meat samples from heifers fed with the lipid sources. Soybeans increased the concentration of linoleic acid, content of polyunsatu-rated fatty acid and activity of the Δ9-desaturase C16 enzyme in the Longissimus muscle. The
use of soybean oil in the diet increased the oleic acid, monounsaturated fatty acid, total cis- and trans-fatty acids (C18:0) and the activity of the Δ9-desaturase C16 enzyme in the subcutaneous
fat. Diets with soybean grain had greater deposition of linoleic and linolenic acids than diets with fat protected and greater presence of these essential fatty acids are associated to a better composition and meat quality.
Keywords: meat quality, protected fats, soybeans, soybean oil
Introduction
Beef is a food high in protein and is one of the main nutrient sources for humans, since it consists of edible muscle, connective tissue and associated fat. The most important meat quality attributes include ten-derness, taste, juiciness, leanness, nutrient quantities, safety and convenience (Webb, 2006). However, there is great variation in the chemical and physical compo-nents of beef, which can be attributed to factors such as the breed, sex, and age of the animals, nutrition and anatomical position of the cut (Rotta et al., 2009b). The evaluation of the meat quality by consumers begins with the colour of meat and quantity of fat coverage, followed by processing aspects, such as fluid loss during thawing and cooking, and tenderness, which is considered the most important qualitative aspect of beef (Koohmaraie et al., 2002). Currently, there is a concern with human nutrition with the sanitary quality of food and, more im-portantly, the possible effects (harmful or beneficial) of certain foods or nutrients on consumer health (Kazama et al., 2008).
The beef consumption has been mentioned as one of the main factors that can lead to the development of cardiovascular diseases, obesity, hypertension and can-cer. These effects are directly related to the fat present in beef, which has an elevated concentration of saturated
fatty acids (SFAs) and a lower ratio of polyunsaturated to saturated fats when compared to the fat of monogastric animals, that difference is due mainly to the process bio-hydrogenation that occurs in the rumen by the action of different microorganisms (French et al., 2000).
There has been a growing interest in recent years for the development of nutritional strategies for manip-ulation of the fatty acid composition in beef (Wood et al., 2003). This interest may be motivated by the need to produce a healthier meat, reducing its implication in diseases associated with modern life and improving its competitiveness with pork and poultry. Accordingly, this study aimed to evaluate the qualitative characteristics of the meat from crossbred heifers fed with different lipid sources.
Materials and Methods
Animal management and experimental design
This study was carried out at Jaboticabal, state of São Paulo, southeast Brazil (21º15’22” S, 48º18’58” W, 595 m altitude). The climate, according to Köppen type AWa is characterized as subtropical dry winter short, moderate and dry (Apr. to Sep.) and hot and rainy sum-mer (Oct. to Mar.). The experimental area has 24 indi-has 24 indi-vidual pens with cement floors, partial coverings, drink-ing fountains and troughs for forage and concentrate. Twenty-one crossbred heifers (¼Nelore × ¼Santa Ger-trudis × ½Braunvieh) with an approximate age of 14 ± 3 months were used in this study. The heifers had been part of an experiment in which they received mineral supplementation and/or protein and energy supplemen-tation (0.3 % the body weight) in the rainy period. They had an average and standard deviation body weight of
§Present address: Universidade Camilo Castelo Branco, R. Hilário da Silva
Passos, 950, Rural – Campus Descalvado – 13690-970 – Descalvado, SP – Brasil.
¶Present address: Universidade Federal da Bahia/Escola de Medicina
Veterinária e Zootecnia, Av. Adhemar de Barros, 500 – 40170-110 – Salvador, BA – Brasil.
Received September 10, 2010
Accepted March 01, 2012
1UNESP/FCAV – Depto. de Zootecnia, Via de Acesso Prof.
Paulo Donatto Castellane, s/n – 14884-900 – Jaboticabal, SP – Brasil.
2USP/ESALQ – Depto. de Zootecnia, C.P. 09 – 13418-900 –
Piracicaba, SP – Brasil.
3INCT/CA - UFV - Depto. de Zootecnia, Av. Peter Henry Rolfs,
s/n - Campus Universitário - 36570-000 - Viçosa, MG - Brasil. *Corresponding author <ttberchi@fcav.unesp.br>
Edited by: Gerson Barreto Mourão
Qualitative characteristics of meat from confined crossbred heifers fed with lipid sources
Giovani Fiorentini1, Telma Teresinha Berchielli1,3*, Márcia Cristina Araújo Santana1,¶ , Paulo Henrique Moura Dian1,§, Ricardo
Andrade Reis1,3, Alexandre Amstalden Moraes Sampaio1,3, Marcos Vinicius Biehl2
300 ± 14.8 kg, forming a homogenous group. For an ini-tial 25 d period, the animals were adapted to the facili-ties, management and diet intake. After this period, they were randomly placed in individual pens.
The experimental diets were formulated to provide an intake of the dry matter at 2.32 % of live weight and average daily gain of 1.19 kg. The formu-average daily gain of 1.19 kg. The formu-. The formu-lations were obtained by the RLM®/ESALQ-USP soft-ware (Lanna et al., 1999) in accordance with the Cor-Lanna et al., 1999) in accordance with the Cor- in accordance with the Cor- Cor-nell Net Carbohydrate and Protein System (CNCPS) that was developed by Fox et al. (1992). The diets were isocaloric and isonitrogenous and were composed of corn silage as roughage (60 %) and corn and soybean meal as concentrate mixture (40 %). The diets were also complemented by a mineral mixture (Table 1). In the soybean diet, the soybeans were the main protein source.
The ingredients were ground in a hammer mill fit-ted with a sieve with holes of 5 mm in diameter. The proportion of the ingredients in the diets the composi-tion of the foods and composicomposi-tion of the fatty acids are found in Tables 1 and 2, respectively.
The roughage (corn silage) was provided with the experimental concentrates to the animals once a day at 8h00. During the entire experimental period, the quan-tities provided were adjusted to allow close to a 10 % surplus in relation to the total consumed the day before,
subsidizing a consumption known as “ad libitum”.
After the end of the experimental period, the sam-ples were thawed and grouped by animal and by time period. Next, they were freeze-dried, ground in a 1-mm mesh sieve and analysed to determine the content of dry matter (DM), organic matter (OM), ether extract (EE) and crude protein (CP), according with Association Of-ficial Analytical Chemists (AOAC, 1990). They were also analysed to determine the neutral detergent fibre (NDF) and acid detergent fibre (ADF) according to the method of Van Soest et al. (1991) (Table 1).
Slaughter, sample collection and meat quality grades
After 68 days in feed-lot the animals were trans- the animals were trans-ported to a commercial abattoir. The next day, after not eating solids for 28 h, the slaughter took place. This was carried out by a concussion stunning procedure using a compressed air pistol and subsequent bleeding by cut-ting the jugular veins and carotid arteries. The study was approved by the Ethics and Animal Welfare Committee (CEBEA) at the Universidade Estadual de São Paulo (UNESP), Jaboticabal campus.
The carcass remained for 24 h in cold chamber and after this period was obtained meat sampling (sirloin), a
perpendicular cut was made in the Longissimus muscle
be-tween the 12th and 13th ribs. Four samples of 2.5-cm thick
sirloin were removed at the 12th rib and were vacuum
packed and cooled to be analysed the next day (48 hours after slaughter) for their qualitative characteristics.
For the determination of the meat colour, a Minolta Chroma Meter CR-300 colorimeter was used to measure the L* a* b* space. In this space, L* indicates luminos-ity, and a* and b* are the chromaticity coordinates as follows: the axis that runs from –a* to +a* varies from
green to red, and the axis that runs from –b* to +b*
var-ies between blue and yellow. Thirty minutes before per-forming the readings at different positions on the meat, a transversal cut was made to the muscle to expose the myoglobin to oxygen (Abularach et al., 1998).
Table 1 − Ingredients and composition of the diet.
Ingredient (% DM) Diet
A % of DM
SB PF SO
Corn silage 60.00 60.00 60.00
Protected fat 0.00 3.20 0.00
Soy grain 14.00 0.00 0.00
Soybean meal 0.00 12.80 12.40
Soybean oil 0.00 0.00 2.60
Ground corn 24.00 22.00 23.00
Mineral salt B 2.00 2.00 2.00
Composition
Dry matter (DM) (%) 56.1 56.1 55.7 % DM
Organic matter 94.90 94.10 94.80
Ash 5.10 5.90 5.20
Crude protein 13.20 13.60 13.50
Ether extract 5.80 5.80 5.80
Neutral detergent fiber 40.40 39.70 39.60 Acid detergent fiber 20.30 20.00 20.00
Lignin 4.50 4.40 4.90
Total carbohydrates 75.90 74.60 75.50 kcal g–1 DM
Crude energy 4.60 4.60 4.70
ASB – diet containing 60 % corn silage and 40 % concentrate with a base
of soybeans as the lipid source; PF – diet containing 60 % corn silage and 40 % concentrate with a base of protected fat as the lipid source; SO – diet containing 60 % corn silage and 40 % concentrate with a base of soy oil as the lipid source; BComposition of mineral salt: (Ca: 45 g; P: 12 g; Mg: 46 g; S: 14
g; Na: 58 g; Cu: 140 mg; Mn: 410 mg; Zn: 525 mg; I: 10 mg; Co: 8 mg; Se: 2.5 mg; F (Maximum): 120 mg.
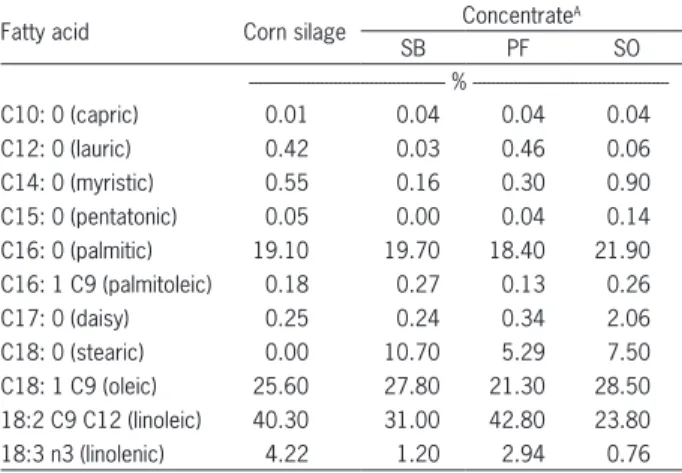
Table 2 − Composition of fatty acids for corn silage and for the experimental concentrates containing different lipid sources.
Fatty acid Corn silage Concentrate
A
SB PF SO
%
---C10: 0 (capric) 0.01 0.04 0.04 0.04
C12: 0 (lauric) 0.42 0.03 0.46 0.06
C14: 0 (myristic) 0.55 0.16 0.30 0.90 C15: 0 (pentatonic) 0.05 0.00 0.04 0.14 C16: 0 (palmitic) 19.10 19.70 18.40 21.90 C16: 1 C9 (palmitoleic) 0.18 0.27 0.13 0.26
C17: 0 (daisy) 0.25 0.24 0.34 2.06
C18: 0 (stearic) 0.00 10.70 5.29 7.50 C18: 1 C9 (oleic) 25.60 27.80 21.30 28.50 18:2 C9 C12 (linoleic) 40.30 31.00 42.80 23.80 18:3 n3 (linolenic) 4.22 1.20 2.94 0.76
ASB – concentrate with the addition of soybeans as a lipid source; PF
The pH was measured in the muscle portion of the sampled sirloin 48 h after slaughter with a Jonhis dig-ital meter (IpHPJ model). The water retention capacity was obtained by the difference between the weights of a meat sample (approximately 2 g) before and after being subjected to a 10 kg pressure for 5 min (Hamm, 1960).
To calculate the loss of water by cooking, the piec-es of beef were baked in an industrial electric oven at a temperature of 175 °C until reaching a temperature of 70 °C in their geometric centre (Abularach et al., 1998). The weights of the meat samples before and after cook-ing were used for the calculations of total losses. After cooling the baked samples, four cylinders were removed from the meat with a leaker to determine the force needed to transversally cut each cylinder using a Tex-ture Analyser instrument (TA-XT2i) attached to a Warner Bratzler blade. The average force of the four cylinders was calculated to represent the texture or shear force of each piece of beef (Abularach et al., 1998).
For the sensory analysis, the meat samples were baked in an electric oven at a temperature of 175 °C until reaching 75 °C in their geometric centres, and after cool-ing, they were cut and offered to 30 panellists. In this test, the attributes of flavour, texture, preference and general appearance were evaluated. The scores varied from one to nine with one being maximal disapproval and nine be-ing maximal approval (Meilgaard et al., 1999).
For the determination of the fatty acid profile in the meat and subcutaneous fat, a sample of sirloin from
each animal (between the 12th and 13th rib) was used to
perform the lipid extraction, transesterification of fatty acids and methylation of fatty acids in the muscle and subcutaneous fat. The extraction and evaluation of the to-tal lipids of the samples were performed according to the modified methodology of Hara and Radin (1978), which utilised nearly 1.5 g of the subcutaneous fat and 3.0 g of the Longissimus muscle samples for the extraction of fat
with the use of hexane/isopropanol (3:2 v v–1).
For the transesterification of the fatty acids, the methodology described by Christie (1982) was used with modifications using a methanolic solution of sodium methoxide. The fatty acid methyl esters were separated
in a 100 m capillary column with silica (SP-2560) fused
with hydrogen as the carrier gas (1.8 mL min–1) and a
flame ionisation detector (FID). Each sample was rotated as described by Griinari et al. (1998), with a tempera-ture gradient of 70 °C to 240 °C for the identification of fatty acid peaks. After the identification of the peaks, a standard butter (CRM 164; Commission of the European Communities, Community Bureau of Reference, Brus-sels, Belgium) was used for the certification of the re-cuperation of the fatty acids according to the peaks and retention times.
The activity indices of the C16 and C18 Δ9
-desaturase enzymes were also calculated. These en-zymes are responsible for the conversion of fatty acids saturated with C16 and C18 atoms, respectively, into their corresponding monounsaturated carbons with double bonds on C9, as described by Malau-Aduli et al. (1997). This index expresses the quantity of the product (monounsaturated fatty acid) as a percentage of the sub-strate available for the conversion. These indexes were
obtained by the following equations: Δ9- Desaturase (16)
– index of C16 desaturase enzyme activity = 100 (16:1 /
16:0 + 16:1) and Δ9- Desaturase (18) – index of C18
de-saturase enzyme activity = 100 (18:1 / 18:0 + 18:1).
Statistical analysis
The experimental design used for the data analysis was completely randomised with three treatments and seven replicates with a total of 21 animals. The
aver-ages were compared with a Tukey’s test (p < 0.05). The
statistical analyses were performed by the PROC GLM software of SAS (1997). For the qualitative characteris-tics of the meat (flavour, texture, appearance and general aspect), was used the non-parametric Kruskal-Wallis test (procedure NPAR 1 WAY from SAS (1997).
Results and Discussion
The shear force did not vary with the lipid sup-plementations (Table 3). In the study by Restle et al. (2001), the average value obtained for shear force was
6.24 kg cm–2 in feedlot finished heifers that were ¾
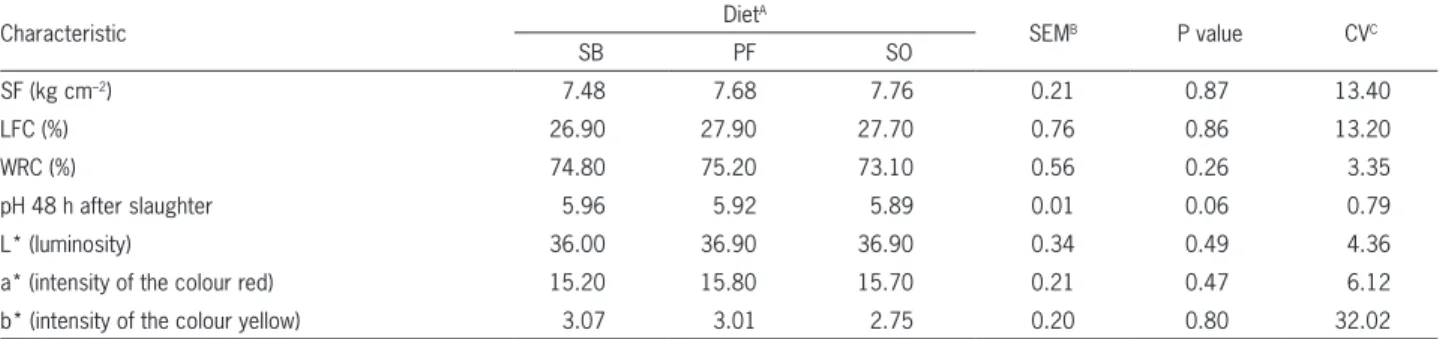
Cha-Table 3 − Shear force (SF), losses from cooking (LFC), water retention capacity (WRC), pH and characteristics of sirloin meat from feedlot crossbred heifers receiving different lipid sources.
Characteristic Diet
A
SEMB P value CVC
SB PF SO
SF (kg cm–2) 7.48 7.68 7.76 0.21 0.87 13.40
LFC (%) 26.90 27.90 27.70 0.76 0.86 13.20
WRC (%) 74.80 75.20 73.10 0.56 0.26 3.35
pH 48 h after slaughter 5.96 5.92 5.89 0.01 0.06 0.79
L* (luminosity) 36.00 36.90 36.90 0.34 0.49 4.36
a* (intensity of the colour red) 15.20 15.80 15.70 0.21 0.47 6.12
b* (intensity of the colour yellow) 3.07 3.01 2.75 0.20 0.80 32.02
ASB – diet containing 60 % corn silage and 40 % concentrate with a base of soybeans as the lipid source; PF – diet containing 60 % corn silage and 40 % concentrate
with a base of protected fat as the lipid source; SO – diet containing 60 % corn silage and 40 % concentrate with a base of soy oil as the lipid source; BSEM – standard
rolais and ¼ Nellore, which was a lower value than the
value in this study (7.64 kg cm–2). According to Lawrie
(2005), values above 5.00 kg cm–2 characterise the meat
as hard.
The SMS Warner-Bratzler cell blade used in this study had a thickness of 3 mm, whereas the thickness of the standard Warner-Bratzler (WB) blade is 1.016 mm (0.04 inches). The greater thickness of the blade may in-fluence the value of the maximal shear force as reported by Silva et al. (1999). They reported a greater sensitivity of the standard Warner-Bratzler blade to detect the dif-ferences in the texture of the meat.
Several factors may influence the tenderness of meat, such as the degree of marbling (or intramuscular fat), intermuscular fat, age, muscle glycogen reserves, rigor mortis, pH and species pattern. The greater shear
force values this study (7.64 kg cm–2) could be attributed
to other factors, such as age or difference in enzyme ac-tivity, that appear to be influenced by the breed compo-sition of the animals. In a study with crossbred Angus and Brahman animals, Stolowski et al. (2006) found that the breed type influences the tenderness due to the mus-cular difference linked to maturation rate and calpasta-tin activity.
The variables related to the total losses, such as losses by dripping, losses by evaporation and losses by water retention, did not differ (p > 0.05) with average value 74.3 %, but the observed values remained at ap-propriate levels. The loss by cooking was not influenced by the sources of lipids with average value of loss of 27.5 %.
Differences were not observed (p > 0.05) in the
av-erage pH values 48 h after slaughter with the avav-erage pH value of 5.92, which was close to the recommended limit (pH 6.0). According to Fernandes et al. (2008), pH 6.0 is considered as a dividing point between a normal cut and a dark cut of meat. In Brazil, the slaughterhouses only export meat that has pH value less than 5.80 that is
directly measured in the Longissimus muscle 24 h
post-mortem (Oliveira et al., 2009), because the meat may be dark when the pH is above 6.0 due to the higher enzy-matic activity, greater water retention and lesser oxygen penetration.
The analysis of meat colour demonstrated aver-age values of 36.6, 15.6 and 2.94 for L*, b* and a*,
re-spectively, and differences were not observed (p > 0.05)
(Table 3). The results are similar to those described by Fernandes et al. (2008). They reported the following
re-sults for Canchim females: 37.39 (L*), 15.92 (b*) and 2.97 (a*). They also stated that the luminosity and col-ouration of the meat are directly related to the pH value after cooling. In this study, pH values remained within the ideal limits, and the L*, a* and b* characteristics presented values that are considered normal.
The analysis of the sensory panel did not show dif-ferences in the flavour, yet for the texture and overall ac-ceptance, there was an effect on the results from the di-ets (Table 4). When the texture characteristic of the meat was considered by the sensory panel, the meat from the animals that received protected fat and soybean oil had a
better classification (p ≤ 0.05) compared to the meat from
animals that received soybeans.
The texture results obtained from the sensory panel (Table 4) did not correlate with the results from the analysis performed by the texturometer (shear force) (Table 3). The basis of the mechanical methods for eval-uation is the cut force, which is an objective measure (Lawrie, 2005). The impression of texture in the sensory evaluation involves the ease of teeth penetration into the meat, disintegration of the meat in the mouth and quan-tity of residue after chewing, which makes this analysis more complex and makes it difficult to find a correlation among the evaluations.
The texture result may be related to the fat cover-age of carcasses because animals fed with protected fat had a greater proportion of adipose tissue in the carcass. The fat coverage has the important function of protect-ing the carcass from the low temperatures observed in refrigeration chambers (Pereira et al., 2000). Therefore, thicker layers of fat are more effective as thermal insu-lators because they minimise the shortening of muscle fibres caused by the abrupt fall in temperature on the surface of the muscle. However, this has negative conse-quences for the tenderness and texture of the meat.
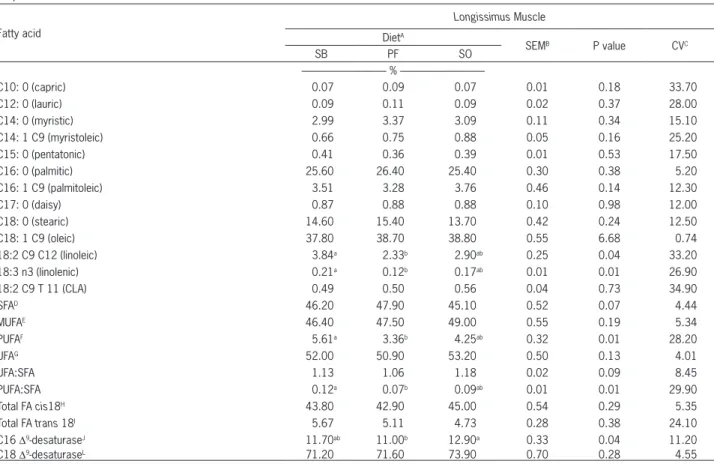
There was difference (p≤ 0.05) in the
concentra-tion of linoleic acid (18:2 C9 C12), linolenic acid (18:3 n3), PUFA content and PUFA ratio, which is the ratio of SFAs. Animals fed with soybeans had a greater concen-. Animals fed with soybeans had a greater concen-Animals fed with soybeans had a greater
concen-tration (p≤ 0.05) of linoleic acid (18:2 C9 C12), linolenic
acid (18:3 n3), PUFA content and PUFA ratio, which is
the ratio of SFAs in the Longissimus muscle when
com-pared with animals fed with protected fat (3.84 versus
2.33; 0.21 versus 0.12; 5.61 versus 3.36 and 0.12 versus
0.07, respectively). The concentration of the linoleic and linolenic fatty acids PUFA content and PUFA ratio from the diet with soybean oil did not differ from the other
di-Table 4 − Sensory analysis completed by a gourmet panel of the meat from crossbred heifers finished in confinement receiving lipid sources.
Sensory characteristics Diet
A
SEMB P value CVC
SB PF SO
Overall acceptance 6.12b 7.33a 6.54ab 0.32 0.04 23.5
Flavour 7.04 7.42 6.58 0.31 0.56 21.9
Texture 5.50b 7.29a 6.71a 0.34 0.04 25.8
ASB – diet containing 60 % corn silage and 40 % concentrate with a base of soybeans as the lipid source; PF – diet containing 60 % corn silage and 40 % concentrate
with a base of protected fat as the lipid source; SO – diet containing 60 % corn silage and 40 % concentrate with a base of soy oil as the lipid source; BSEM – standard
ets. The index of the C16 Δ9-desaturase enzyme also was
a difference (p≤ 0.05) animals fed with soybeans oil had
a greater concentration when compared with animals
fed with protected fat (12.9 versus 11.0) and soybean did
not differ from the other diets.
The other fatty acids and the total content of SFAs,
MUFAs, unsaturated fatty acids (UFAs), total cis-fatty
ac-ids (C18:0) and total trans-fatty acac-ids (C18:0) were not affected (p > 0.05) by the lipid sources. Furthermore,
the index of the C18 Δ9-desaturase enzyme and the ratio
of UFAs to SFAs were not affected (p > 0.05) by the lipid
sources (Table 5).
According to Scollan et al. (2006), the predominant SFAs in beef are C14:0, C16:0 and C18:0, with C18:0 representing approximately 30 % of the total of SFAs. Among these, the myristic acids (C14:0) and palmitic ac-ids (C16:0) are the fatty acac-ids that deserve the most atten-tion for being considered as hypercholesterolemic (Wood et al., 2003), which makes the reduction in the content of these fatty acids interesting in beef. The C16:0
con-centration averaged 25.8 % (Table 5), which was similar to the result (24.9 %) found in heifers fed with different energy sources in diets based on cottonseed hulls and soybeans by Kazama et al. (2008). Similar values for fatty acids C14:0 (2.52 %), C16:0 (23.46 %) and C18:0 (15.44 %) were reported by Silva et al. (2002).
Although the saturated fat in beef may contribute to the elevation of cholesterol content circulating in hu-mans, fats rich in stearic acid did not show these charac-teristics. C18:0 is considered to be neutral in the control of plasma cholesterol levels (Scollan et al., 2006). In ad-dition, stearic acid is important in the sensory factors of meat because a greater score was observed by the gour-met panel for cuts of meat with greater concentrations of this fatty acid (Mir et al., 2000).
The concentration of oleic acid (C18:1 C9) had an average value of 38.5 %. This value is slightly greater than the values found by Kazama et al. (2008), Fern-andes et al. (2009) and Rotta et al. (2009a) at 33.98 %, 35.96 % and 36.53 %, respectively. The values in this
Table 5 − Composition of fatty acids of the Longissimus muscle samples from the feedlot-finished crossbred heifers receiving different lipid sources.
Fatty acid
Longissimus Muscle
DietA
SEMB P value CVC
SB PF SO
%
---C10: 0 (capric) 0.07 0.09 0.07 0.01 0.18 33.70
C12: 0 (lauric) 0.09 0.11 0.09 0.02 0.37 28.00
C14: 0 (myristic) 2.99 3.37 3.09 0.11 0.34 15.10
C14: 1 C9 (myristoleic) 0.66 0.75 0.88 0.05 0.16 25.20
C15: 0 (pentatonic) 0.41 0.36 0.39 0.01 0.53 17.50
C16: 0 (palmitic) 25.60 26.40 25.40 0.30 0.38 5.20
C16: 1 C9 (palmitoleic) 3.51 3.28 3.76 0.46 0.14 12.30
C17: 0 (daisy) 0.87 0.88 0.88 0.10 0.98 12.00
C18: 0 (stearic) 14.60 15.40 13.70 0.42 0.24 12.50
C18: 1 C9 (oleic) 37.80 38.70 38.80 0.55 6.68 0.74
18:2 C9 C12 (linoleic) 3.84a 2.33b 2.90ab 0.25 0.04 33.20
18:3 n3 (linolenic) 0.21a 0.12b 0.17ab 0.01 0.01 26.90
18:2 C9 T 11 (CLA) 0.49 0.50 0.56 0.04 0.73 34.90
SFAD 46.20 47.90 45.10 0.52 0.07 4.44
MUFAE 46.40 47.50 49.00 0.55 0.19 5.34
PUFAF 5.61a 3.36b 4.25ab 0.32 0.01 28.20
UFAG 52.00 50.90 53.20 0.50 0.13 4.01
UFA:SFA 1.13 1.06 1.18 0.02 0.09 8.45
PUFA:SFA 0.12a 0.07b 0.09ab 0.01 0.01 29.90
Total FA cis18H 43.80 42.90 45.00 0.54 0.29 5.35
Total FA trans 18I 5.67 5.11 4.73 0.28 0.38 24.10
C16 Δ9-desaturaseJ 11.70ab 11.00b 12.90a 0.33 0.04 11.20
C18 Δ9-desaturaseL 71.20 71.60 73.90 0.70 0.28 4.55
ASB – diet containing 60 % corn silage and 40 % concentrate with a base of soybeans as the lipid source; PF – diet containing 60 % corn silage and 40 % concentrate
with a base of protected fat as the lipid source; SO – diet containing 60 % corn silage and 40 % concentrate with a base of soy oil as the lipid source; BSEM – standard
error of mean; CCV –coefficient variation (%); DSFA – saturated fatty acids = C4:0, C6:0, C8:0, C10:0, C12:0, C13:0iso, C13:0ant, C14:0iso, C14:0, C15:0iso,
C15:0ant, C14:1c9, C15:0, C16:0iso, C16:0, C17:0iso, C17:0, C18:0, C20:0, C22:0 and C24:0; EMUFA – monounsaturated fatty acids = C16:1c9, C17:1, C18:1t6,
C18:1t9, C18:1t10, C18:1t11, C18:1t12, C18:1c9, C18:1c11, C18:1c12, C18:1c13, C18:1t16, C18:1c15, C20:1, C22:1 and C24:1; FPUFA – polyunsaturated
fatty acids = C18:2t11c15, C18:2c9c12, C18:3, C18:2c9t11, C20:3, C20:4, C22:2, C20:5, C22:5 and C22:6; GUFA – unsaturated fatty acids = MUFA and PUFA; H Total fatty acids cis18 = C18:1c9, C18:1c11, C18:1c12, C18:1c13, C18:1c15, C18:2t11c15 and C18:2c9c12; ITotal fatty acids trans18= C18:1t9, C18:1t10,
study were also slightly greater than those reported by Enser et al. (1998). In this referenced study, they per-formed a survey to evaluate the composition of the fatty acids of bovine, sheep and pig meat acquired in various supermarkets. They observed that beef had an elevated content of C18:1 C9 (36 %), and the meat from sheep and pigs had averages of 32.5 % and 32.8 % of C18:1 C9, respectively. However, similar values of oleic acid were found by Felton and Kerley (2004). They evaluated the profile of fatty acids in cattle fed traditional diets with a base of soybean meal and corn meal or diets with high levels of lipids, and they found an average value of 37.7 % for oleic acid. The increase in the concentration of oleic acid is highly desirable because this fatty acid has hypocholesterolemic properties (Mir et al., 2003).
The concentration of linoleic acids and linolenic acids was higher in the animals fed with soybeans than the concentrations of animals that received protected fat. Linolenic fatty acid is an essential fatty acid, as it is the precursor for the synthesis of many PUFAs (Oda et al., 2004). These authors highlighted that although most PUFAs are not essential, they have an important role in the reduction of blood cholesterol. These results were confirmed by other authors who described a low occur-rence of heart disease despite the high consumption of fats in Mediterranean countries where there is a wide use of olive oil and similar products that provide sub-stantial absorption of MUFAs, mainly oleic acid. As a result of this diet rich in olive oil, the decrease in blood cholesterol was shown in comparison to that of diets low in fat (Wood et al., 1999).
The C16 Δ9-desaturase enzyme has greater activity
in the Longissimus muscle from the animals fed with
soy-bean oil than the activity of animals fed with protected fat (Table 5). This enzyme is responsible for the desatu-ration of SFAs with 16 and 18 carbons, converting them into their corresponding MUFAs with a double bond on C9 (Beaulieu et al., 2002).
Production of CLA by Δ9-desaturase is performed
by trans-vaccenic acid (C18:1 t11) and is produced by the incomplete biohydrogenation of linoleic and linolenic ac-ids by ruminal bacteria (Fernandes et al., 2009). Often, the biohydrogenation of linoleic fatty acid is not completed. Therefore, significant quantities of conjugated fatty acid and trans-MUFA, such as vaccenic fatty acid, reach the duodenum and are absorbed, ending up in the milk or in the tissue (Metz et al., 2009). This enzyme acts in the epi-thelium of the intestine and muscle tissue but at a lesser intensity than the enzyme in adipose tissue (Beaulieu et al., 2002). This enzyme’s activity may be influenced by breed, age, sex and degree of physiological maturity of the animals. The deposition rate of CLA does not depend on the final quantity of body fat of the animals but, instead, is favoured in conditions where a lower rate of fat deposi-tion occurs (De La Torre et al., 2006).
Dannenberger et al. (2004) observed ten isomers
of CLA in beef and noted that the cis-9 trans-11 isomer
represented 70 % of the total CLA. They also suggested
that this isomer has recognised anticarcinogenic and ant-iteratogenic effects. They emphasised the importance of
the endogenous synthesis of cis-9 trans-11 CLA by the
action of the Δ9-desaturase enzyme. This process occurs
from vaccenic acid (C18:1 trans-11), which is an
inter-mediate product formed during the process of ruminal biohydrogenation of linoleic acid. In this study, the
av-erage concentration of CLA (18:2 cis-9 trans-11) in the
Longissimus muscle was 0.52 %, which was a similar value to that found by Fernandes et al. (2009) for Can-chim heifers (0.56 %). However, Macedo et al. (2007) and Felton and Kerley (2004) reported values below 0.32 % and 0.12 %, respectively.
Trans-fatty acids are unsaturated and, contrary to
cis-UFAs, possess double-bonded hydrogen that is
avail-able in a transversal form and are the results of ruminal
biohydrogenation or industrial processes. Trans-fatty
ac-ids are related to harmful effects on human health. San-
San-hueza et al. (2002) relate the effects of trans-fatty acids
to the blood lipids, inhibitory action of liver enzymes, modification of cellular membrane fluidity and arterio-genic potential. However, long chain PUFAs participate in several beneficial metabolic processes for human health (Varela et al., 2004) and that the meat fats from ruminants are natural sources of several of these fatty acids.
The total content of PUFAs and the ratio of PUFAs to SFAs were greater in animals fed with soybeans than that of animals fed with protected fat. An increase in the ratio of PUFAs to SFAs in the human diet is considered
a priority for the reduction of plasma cholesterol (Pon-
Pon-nampalam et al., 2001). Silva et al. (2002) reported an av- et al., 2001). Silva et al. (2002) reported an av-2001). Silva et al. (2002) reported an av-. Silva et al. (2002) reported an av-Silva et al. (2002) reported an av- et al. (2002) reported an av-(2002) reported an av- reported an av-erage ratio of 0.20 for confined crossbred heifers, which was a greater value than reported in this study. The ra-tio of PUFAs to SFAs was less than that recommended by the Department of Health of the United Kingdom, which recommends a value of approximately 0.4, char-acterising a healthier diet (Wood et al., 2003). Therefore, Jakobsen (1999) suggests a reduction in the ingestion of fats rich in cholesterol and SFAs and an increase in the consumption of MUFAs and PUFAs to reduce the risk of obesity, cancer and cardiovascular diseases.
In the sirloin subcutaneous fat, there was a dif-ference (p≤ 0.05) in the percentage of oleic acids, MU-FAs, total cis-fatty acids (C18:0) and total trans-fatty acids
(C18:0). There was also a difference (p≤ 0.05) observed
in the index of the C16 Δ9-desaturase enzyme. The
fol-lowing measurements were not affected (p > 0.05) by
the lipid sources: remaining fatty acids, total content of
SFAs, PUFAs and UFAs, index of the C18 Δ9-desaturase
enzyme, ratio of UFAs to SFAs and ratio of PUFAs to SFAs (Table 6). The diet with soybean oil increased the content of MUFAs, total cis-fatty acids (C18:0) and trans-fatty acids (C18:0) present in subcutaneous fat when compared to
the diet with protected fat. The C16 Δ9-desaturase enzyme
The values of oleic acid heifers that received a diet with protected fat (37.66 %) had lower val-ues compared to the heifers that were fed diets with soybean oil (41.42 %). Higher values of oleic acid are desirable for hypocholesterolemic action, with the advantage of not reducing high-density lipopro-tein (HDL) cholesterol (good cholesterol) protecting against coronary diseases. Oleic fatty acid is consid-ered to be good for health, and content is positive-ly correlated with the sensory quality of the meat (Melton et al., 1982).
Conclusions
Diets with soybean grain had greater deposi-tion of linoleic and linolenic acids than diets with fat protected and greater presence of these essential fatty acids are associated to a better composition and meat quality.
Acknowledgements
To the Fundação de Amparo à Pesquisa do Estado de São Paulo (FAPESP, São Paulo, Brazil) for financial support.
References
Abularach, M.L.S.; Rocha, C.E.; Felício, P.E. 1998. Quality traits of boneless rib cut (L. dorsi muscle) from Nelore young bulls. Ciência e Tecnologia de Alimentos 18: 205–210 (in Portuguese, with abstract in English).
Association of Official Analytic Chemists International [AOAC]. 1990. Official Methods of Analyses. 15ed. AOAC, Arlington, VA, USA.
Beaulieu, A.D.; Drackley, J.K.; Merchen, N.R. 2002. Concentrations of conjugated linoleic acid (cis-9, trans-11-octadecadienoic acid) are not increased in tissue lipids of cattle fed a high-concentrate diet supplemented with soybean oil. Journal of Animal Science 80: 847–861.
Table 6 − Composition of fatty acids of samples of subcutaneous fat in the sirloin of feedlot-finished crossbred heifers receiving different lipid sources.
Fatty acid
Subcutaneous fat over the sirloin DietA
SEMB P value CVC
SB PF SO
%
---C10: 0 (capric) 0.06 0.07 0.07 < .01 0.23 20.00
C12: 0 (lauric) 0.09 0.09 0.10 < .01 0.93 26.00
C14: 0 (myristic) 3.75 3.95 3.59 0.13 0.58 16.90
C14: 1 C9 (myristoleic) 1.14 1.05 1.33 0.08 0.34 28.60
C15: 0 (pentatonic) 0.55 0.48 0.50 0.02 0.52 22.40
C16: 0 (palmitic) 25.70 26.40 25.10 0.34 0.29 5.87
C16: 1 C9 (palmitoleic) 4.29 3.54 4.40 0.17 0.07 16.40
C17: 0 (daisy) 0.94 0.94 0.92 0.02 0.93 10.10
C18: 0 (stearic) 14.10 15.09 13.17 0.51 0.33 15.90
C18: 1 C9 (oleic) 40.20ab 37.70b 41.40a 0.61 0.03 5.96
18:2 C9 C12 (linoleic) 1.20 0.98 0.82 0.07 0.10 30.70
18:3 n3 (linolenic) 0.11 0.08 0.07 0.01 0.33 55.30
18:2 C9 T 11 (CLA) 0.87 0.72 0.87 0.05 0.49 29.30
SFAD 47.40 47.80 45.40 0.58 0.06 4.94
MUFAE 49.10ab 48.10b 51.10a 0.52 0.04 4.13
PUFAF 2.27 1.87 1.82 0.12 0.24 26.40
UFAG 51.40 49.90 52.90 0.55 0.08 4.35
UFA:SFA 1.09 1.03 1.17 0.02 0.06 9.01
PUFA:SFA 0.05 0.04 0.04 < .01 0.28 30.90
Total FA cis18H 43.60ab 40.80b 44.50a 0.59 0.02 5.14
Total FA trans 18I 3.07b 5.28a 3.27b 0.40 0.04 40.90
C16 Δ9-dessaturase J 14.30a 11.80b 14.90a 0.48 0.01 12.80
C18 Δ9-desaturase L 74.10 71.40 75.90 0.85 0.09 4.74
ASB – diet containing 60 % corn silage and 40 % concentrate with a base of soybeans as the lipid source; PF – diet containing 60 % corn silage and 40 %
concentrate with a base of protected fat as the lipid source; SO – diet containing 60 % corn silage and 40 % concentrate with a base of soy oil as the lipid source; BSEM – standard error of mean; CCV –coefficient variation (%); DSFA – saturated fatty acids = C4:0, C6:0 C8:0, C10:0, C12:0, C13:0iso, C13:0ant,
C14:0iso, C14:0, C15:0iso, C15:0ant, C14:1c9, C15:0, C16:0iso, C16:0, C17:0iso, C17:0, C18:0, C20:0, C22:0 and C24:0; EMUFA – monounsaturated
fatty acids = C16:1c9, C17:1, C18:1t6, C18:1t9, C18:1t10, C18:1t11, C18:1t12, C18:1c9, C18:1c11, C18:1c12, C18:1c13, C18:1t16, C18:1c15, C20:1, C22:1 and C24:1; FPUFA – polyunsaturated fatty acids = C18:2t11c15, C18:2c9c12, C18:3, C18:2c9t11, C20:3, C20:4, C22:2, C20:5, C22:5 and
C22:6; GUFA – unsaturated fatty acids = MUFA and PUFA; HTotal fatty acids cis18 = C18:1c9, C18:1c11, C18:1c12, C18:1c13, C18:1c15, C18:2t11c15
and C18:2c9c12; ITotal fatty acids trans18= C18:1t9, C18:1t10, C18:1t11, C18:1t12, C18:1t16, C18:1t18, C18:2t11c15 and C18:2c9c12; JIndex of Δ9-desaturase C16=100 * (C16:1n-9 / (C16:0 + C16:1n9)); LIndex of Δ9-desaturase C18=100; *(C18:1n-9 / (C18:0 + C18:1n9)); a,bAverages followed by
Christie, W.W. 1982. A simple procedure for rapid transmethylation of glycerolipids and cholesterol esters. Journal of Lipid Research 23: 1072–1075.
Dannenberger, D.; Nuernberg, G.; Scollan, N.; Schabbel, W.; Steinhart, H.; Ender, K.; Nuernber, G.K. 2004. Effect of diet on the deposition of n-3 fatty acids, conjugated linoleic and C18:1 trans fatty acid isomers in muscle lipids of German Holstein bulls. Journal of Agriculture and Food Chemistry 52: 6607–6615.
De La Torre, A.; Gruffat, D.; Durand, D.; Micol, D.; Peyron, A.; Scislowski, V.; Bauchart, D. 2006. Factors influencing proportion and composition of CLA in beef. Meat Science 73: 258–268.
Enser, M.; Halllet, K.G.; Hewett, B.; Fursey, G.A.J.; Wood, J.D.; Harrington, G. 1998. Fatty acid content and composition of UK beef and lamb muscle in relation to production system and implications for human nutrition. Meat Science 49: 329–341. Felton, E.E.D.; Kerley, S. 2004. Performance and carcass quality
of steers fed different sources of dietary fat. Journal of Animal Science 82: 1794–1805.
Fernandes, A.R.M.; Sampaio, A.A.M.; Henrique, W.; Oliveira, E.A.; Tullio, R.R.; Perecin, D. 2008. Carcass and meat characteristic of cattle receiving differents diets in feedlot. Arquivo Brasileiro de Medicina Veterinária e Zootecnia 60: 139–147 (in Portuguese, with abstract in English).
Fernandes, A.R.M.; Sampaio, A.A.M.; Henrique, W.; Tullio, R.R.; Oliveira, E.A.; Silva, T.M. 2009. Chemical traits and fatty acids composition of beef from young bulls, steers and heifers fed corn silage and concentrate or sugarcane and concentrate with sunflower grains. Revista Brasileira de Zootecnia38: 705–712 (in Portuguese, with abstract in English).
Fox, D.G.; Sniffen, C.J.; O´Connor, J.D.; Russel, J.B.; Van Soest, P.J. 1992. A net carbohydrate and protein system for evaluating cattle diets. III. Cattle requirements and diets adequacy. Journal of Animal Science 70: 3578–3596.
French, P.; Stanton, C.; Lawless, F.; O’Riordan, E.G.; Monahan, F.J.; Caffrey, P.J.; Moloney, A.P. 2002. Fatty acid composition, including conjugated linoleic acid, of intramuscular fat from steers offered grazed grass, grass silage or concentrate based diets. Journal of Animal Science 78: 2849–2855.
Griinari, J.M.; Dwyer, D.A.; McGuire, M.A.; Bauman, D.E.; Palmquist, D.L.; Nurmela, K.V.V. 1998. Trans-Octadecenoic acids and milk fat depression in lactating dairy cows. Journal of Dairy Science 81: 1251–1261.
Hamm, R. 1960. Biochemistry of meat hydratation. Advances in Food Research 10: 335–443.
Hara, A.; Radin, N.S. 1978. Lipid extraction of tissues with a low-toxicity solvent. Analytical Biochemistry 90: 420–426. Jakobsen, K. 1999. Dietary modifications of animal fats: status
and future perspectives. Fett Lipid 101: 475–483.
Kazama, R.; Zeoula, L.M.; Prado, I.N.; Silva, D.C.; Ducatti, T.; Matsushita, M. 2008. Quantitative and qualitative carcass characteristics of heifers fed different energy sources on a cottonseed hulls and soybean hulls based die. Revista Brasileira de Zootecnia 37: 350–357 (in Portuguese, with abstract in English). Koohmaraie, M.; Kent, P.M.; Shackelford, S.D.; Veiseth, E.;
Wheeler, T.L. 2002. Meat tenderness and muscle growth: is there any relationship? Meat Science 62: 345–352.
Lanna, D.P.D.; Barioni, L.G.; Boin, C.; Tedeschi, L.O. 1999. RLM 2.0: Feed for Maximum Profit; Version 2.0. RLM, Piracicaba, SP, Brazil. (CD-ROM)
Lawrie, R.A. 2005.Meat Science. 6ed. Artmed, Porto Alegre, RS, Brazil (in Portuguese).
Macedo, L.M.A.M.; Prado, I.M., Ducatti, T.; Prado, J.M., Matsushita, M.; Prado I.N. 2007. Performance, carcass characteristics and chemical composition of nonpregnant or pregnant heifers finished in feedlot. Acta Scientiarum. Animal Sciences 29: 425–432 (in Portuguese, with abstract in English). Malau-Aduli, A.E.O.; Siebert, B.D.; Bottema, C.D.K.; Pitchford,
W.S. 1997. A comparison of the fatty acid composition of triacylglycerols in adipose tissue from Limousin and Jersey cattle. Australian Journal of Agricultural Research 48: 715– 722.
Meilgaard, D.; Civille, G.V.; Can, B.T. 1999. Sensory Evaluation Techniques. Boca Raton: CRC Press, FL, USA.
Melton, S.L.; Amiri, M.; Davis, G.W.; Backus, W.R. 1982. Flavor and chemical characteristics of ground beef form grass-, forage-grain- and forage-grain-finished steers. Journal of Animal Science 55: 77–87.
Metz, P.A.M.; Menezes, L.F.G.; Santos, A.P.; Brondani, I.L.; Restle, J.; Lanna, D.P.D., 2009. Fatty acids profile in meat of steers from different ages and genetic groups finished in feedlot. Revista Brasileira de Zootecnia 38: 523–531 (in Portuguese, with abstract in English).
Mir, P.S.; Ivan, M.; He, M.L.; Pink, B.; Okine, E.; Goonewardene, L.; McAllister, T.A.; Weselake, R.; Mir, Z. 2003. Dietary manipulation to increase conjugated linoleic acids ond other desirable fatthy acids in beef: a review. Canadian Journal of Animal Science 3: 673–685.
Mir, Z.; Paterson, L.J.; Mir, P.S. 2000. Fatty acid composition and linoleic acid content of intramuscular fat in crossbred cattle with and without Wagyu genetics fed a barley based diet. Canadian Journal of Animal Science 80: 195–197.
Oda, S.N.I.; Bressan, M.C.; Cardoso, M.G.; Freitas, R.T.F.; Miguel, G.Z.; Faria, P.B., Vieira, J.O.; Pisa, A.C.C.; Savian, T.V. 2004. Effect of two slaughter methods and sex on proximate composition, cholesterol content and fatty acids profile of capybara meat (Hydrochaeris Hydrochaeris L. 1766). Ciência e Tecnologia de Alimentação 24: 236–242 (in Portuguese, with abstract in English).
Oliveira, E.A.; Sampaio, A.A.M.; Fernandes, A.R.M.; Henrique, W.; Oliveira, R.V.; Ribeiro, G.M. 2009. Performance and carcass traits of Nellore and Canchim young bulls finished in a feedlot system, receiving diets with sugarcane and two concentrate levels. Revista Brasileira de Zootecnia 38: 2465– 2472 (in Portuguese, with abstract in English).
Pereira, L.P.; Restle, J.; Brondani, I.L.; Alves Filho, D.C.; Silva, J.H.S.; Muehlmann, L.D. 2000. Growth of beef cattle from different genetic groups of charolais × nellore intact or castrated at eight months. Ciência Rural 30: 1033–1039 (in Portuguese, with abstract in English).
Restle, J.; Cerdótes, L.; Vaz, F.N.; Brondani, I.L. 2001. Carcass and meat characteristics of charolais and 3/4 charolais 1/4 nellore cull heifers, finished in feedlot. Revista Brasileira de Zootecnia 30: 1065–1075 (in Portuguese, with abstract in English). Rotta, P.P.; Prado, I.N.; Prado, R.M.; Molleta, J.L.; Silva, R.R.;
Perotto, D. 2009a. Carcass characteristics and chemical composition of the Longissimus muscle of Nellore, Caracu and Holstein-friesian bulls finished in a feedlot. Asian-Australasian Journal of Animal Science 22: 598–604.
Rotta, P.P.; Prado, R.M.; Prado, I.N.; Valero, M.V.; Visentainer, J.V.; Silva, R.R. 2009b. The effects of genetic groups, nutrition, finishing systems and gender of Brazilian cattle on carcass characteristics and beef composition and appearance: a review. Asian-Australasian Journal of Animal Science 22: 1718–1734. Sanhueza, J.; Nieto, S.; Valenzuela, A. 2002. Conjugated linoleic
acid: a trans isomer fatty acid potentially beneficial. Revista Chilena de Nutrición 29: 98–105 (in Spanish, with abstract in English).
SAS Institute. 1997. Statistical Analysis System: User’s Guide; Version 6.08. 4ed. SAS Institute, Cary, NC, USA.
Scollan, N.; Hocqette, J.F.; Nuernberg, K.; Dannenberger, D.; Richardson, I.; Moloney, A. 2006. Innovations in beef production systems that enhance the nutritional and health value of beef lipids and their relationship with meat quality. Meat Science 74: 17–33.
Silva, J.A.; Patarata, L.; Martins, C. 1999. Influence of ultimate pH on bovine meat tenderness during ageing. Meat Science 52: 453–459.
Silva, R.G.; Prado, I.N.; Matsushita, M.; Souza, N.E. 2002. Dietary effects on muscle fatty acids composition of finish heifers. Pesquisa Agropecuária Brasileira 37: 95–101.
Stolowski, G.D.; Baird, B.E.; Miller, R.K.; Savell, J.W.; Sams, A.R.; Taylor, J.F.; Sanders, J.O.; Smith, B. 2006. Factors influencing the variation in tenderness of seven major beef muscles from three Angus and Brahman breed crosses. Meat Science 73: 475–483.
Van Soest, P.J.; Robertson, J.B.; Lewis, B.A. 1991. Methods for dietary fiber, neutral detergent fiber, and nonstarch polysaccharides in relation to animal nutrition. Journal of Dairy Science 74: 3583–3597.
Varela, A.; Oliete, B.; Moreno, T.; Portela, C.; Monserrrat, L.; Carballo, J.A.; Sánchez, L.2004. Effect of pasture finishing on the meat characteristics and intramuscular fatty acid profile of steers of the Rubia Gallega breed. Meat Science 67: 515–522. Webb, E.C. 2006. Manipulating beef quality through feeding.
South African Journal of Animal Science 7: 5–15.
Wood, J.D.; Enser, M.; Fisher, A.V.; Nute, G.R.; Richardson, R.I.; Sheard, P.R. 1999. Manipulating meat quality and composition. Proceedings of the Nutrition Society 58: 363–370.