Low ethanol consumption increases
insulin sensitivity in Wistar rats
Departamento de Fisiologia e Biofísica, Instituto de Ciências Biomédicas, Universidade de São Paulo, São Paulo, SP, Brasil
D.T. Furuya, R. Binsack and U.F. Machado
Abstract
Several human studies suggest that light-to-moderate alcohol con-sumption is associated with enhanced insulin sensitivity, but these studies are not free of conflicting results. To determine if ethanol-enhanced insulin sensitivity could be demonstrated in an animal model, male Wistar rats were fed a standard chow diet and received drinking water without (control) or with different ethanol concentra-tions (0.5, 1.5, 3, 4.5 and 7%, v/v) for 4 weeks ad libitum. Then, an
intravenous insulin tolerance test (IVITT) was performed to determine insulin sensitivity. Among the ethanol groups, only the 3% ethanol group showed an increase in insulin sensitivity based on the increase of the plasma glucose disappearance rate in the IVITT (30%, P<0.05). In addition, an intravenous glucose tolerance test (IVGTT) was per-formed in control and 3% ethanol animals. Insulin sensitivity was confirmed in 3% ethanol rats based on the reduction of insulin secretion in the IVGTT (35%, P<0.05), despite the same glucose profile. Additionally, the 3% ethanol treatment did not impair body weight gain or plasma aspartate aminotransferase and alanine ami-notransferase activities. Thus, the present study established that 3% ethanol in the drinking water for 4 weeks in normal rats is a model of increased insulin sensitivity, which can be used for further investiga-tions of the mechanisms involved.
Correspondence
U.F. Machado
Departamento de Fisiologia e Biofísica, ICB 1, USP Av. Prof. Lineu Prestes, 1524 05508-900 São Paulo, SP Brasil
Fax: +55-11-3091-7285 E-mail: [email protected]
R. Binsack was supported by a postdoctoral fellowship program of the DAAD (Bonn, Germany) and FAPESP. Research supported by FAPESP (No. 98/03514-3).
Received April 18, 2002 Accepted September 17, 2002
Key words ·Insulin sensitivity ·Ethanol ·Liver glycogen
·Low ethanol consumption
Epidemiological evidence from many studies indicates that light-to-moderate drink-ing of any kind of alcoholic beverage is associated with a reduction in mortality, due primarily to a reduced risk of coronary heart disease (CHD) (1-6). This phenomenon was mainly related to the capability of moderate alcohol levels to lower CHD risk factors like high levels of LDL cholesterol and fibrino-gen, and to increase in parallel the levels of cardioprotective HDL cholesterol (1,7,8).
It is not known if ethanol affects those parameters separately or via a common link; however, some studies suggest that
of CHD mortality especially in humans with older-onset diabetes mellitus.
Although some studies indicate that light-to-moderate alcohol intake is associated with enhanced insulin sensitivity, they are not free of conflicting results. For example, while Kiechl et al. (9) showed that plasma insulin levels decreased with higher alcohol con-sumption, Razay and Heaton (14) found a U-shaped relation, with moderate drinkers hav-ing the lowest insulin concentration. That study also described that low-to-moderate drinkers had higher HDL cholesterol and lower triglyceride concentrations than non-drinkers; however, Facchini et al. (10) could only confirm the increase in HDL choles-terol.
Since these controversial observations have not been unraveled to date and the human studies leave some gaps in the com-plete understanding of the association of light-to-moderate alcohol consumption and insulin sensitivity (15), it was the aim of this study to establish a reliable animal model that will allow more detailed investigations. Male Wistar rats received drinking water without (control) or with different ethanol concentrations (0.5, 1.5, 3, 4.5 and 7%, v/v) for 4 weeks ad libitum. At the end of this period, an intravenous insulin tolerance test (IVITT) was performed, showing that 3% ethanol-treated rats were more insulin sensi-tive. Additionally, the intravenous glucose tolerance test (IVGTT) was performed in control and 3% ethanol rats to confirm en-hanced insulin sensitivity. The data obtained indicate that adding 3% ethanol to the drink-ing water indeed enhances insulin sensitivity in Wistar rats without impairing body weight gain or inducing liver injury.
Ethanol (99.5% pure) was obtained from Labsynth (Diadema, SP, Brazil). Insulin (Iolin) was purchased from Biobrás (Montes Claros, MG, Brazil). Glucose (25%, g/v) was from Merck (Rio de Janeiro, RJ, Brazil). Male Wistar rats (~200 g body weight; 4-6 animals per cage) were allowed an
adapta-tion period of 1-2 weeks with free access to water and food (pellet diet from Nuvilab, Colombo, PR, Brazil). For the subsequent 4 weeks, the rats received drinking water with-out (control) or with ethanol concentrations of 0.5, 1.5, 3, 4.5 or 7% (v/v), and body weight as well as food and water consump-tion were recorded. The animals were kept under a 12:12-h light-dark cycle (lights on at 6 am). Daily calorie intake was calculated according to the energy content of the differ-ent diets (11.7 kJ per gram chow; 23.4 kJ per ml of 100% ethanol). Before the experi-ments, the rats were anesthetized by intraperitonal injection of sodium pentobar-bital (50 mg/kg body weight). The experi-ments were carried out around noon. All experimental protocols were approved by the Ethics Committee for Animal Research (CEEA) of the Institute of Biomedical Sci-ences, University of São Paulo, protocol #062/2000.
Intravenous insulin tolerance test. Rats were deprived of food for about 2 h and anesthetized, and then received an intrave-nous injection of insulin (0.75 U/kg body weight). Glucose levels were measured on samples obtained from the tail vein using a glucometer (Precision QID, Medisense, São Paulo, SP, Brazil) at 0, 4, 8, 12 and 16 min after insulin injection. The corresponding 4 to 16 min values were used to calculate the rate constant for plasma glucose disappear-ance (Kitt) according to the method of Bonora et al. (16).
insu-lin levels were measured by radioimmunoas-say with a kit from DPC (Los Angeles, CA, USA). The data obtained were plotted, and the area under the curve (AUC) was calcu-lated.
Hepatocellular enzyme determination. Control and 3% ethanol rats were anesthe-tized, and blood was taken from the inferior vena cava to obtain plasma samples. Aspar-tate aminotransferase (AST) and alanine ami-notransferase (ALT) activities for each plasma sample were measured with kits from CELM.
Plasma ethanol determination. Rats were anesthetized, and blood samples were col-lected from the tail vein with heparinized syringes and centrifuged to obtain plasma. Blood samples were collected early in the morning immediately after the lights were turned on and ethanol concentration was measured with a kit from Sigma (St. Louis, MO, USA).
All values are reported as means ± SEM. Multiple comparisons were performed by analysis of variance (ANOVA) followed by the Student-Newman-Keuls post hoc test. When only two groups were compared, the unpaired Student t-test was used.
Body weight gain and total calorie intake of ethanol-treated rats. The mean values of body weight gain during the 4 weeks of treatment (Table 1) were similar in control and 0.5, 1.5, 3 and 7% ethanol rats. How-ever, the 4.5% ethanol rats showed a lower body weight gain (53.3 ± 7.0 g), which was significantly different (P<0.01) from the higher body weight gain observed in the 0.5% ethanol rats (92.4 ± 5.0 g).
Higher dosages of ethanol in the drinking water resulted in a reduction of daily food consumption of 17% (3% ethanol, P<0.05), 30% (4.5% ethanol, P<0.001) and 18% (7% ethanol, P<0.01) when compared with con-trol and 0.5% ethanol (Table 1); however, this finding clearly reflects the response of the rats to the additional calories in the drink-ing water (0.7 kJ/ml, 3% ethanol; 1.05 kJ/ml,
4.5% ethanol, and 1.64 kJ/ml, 7% ethanol). By combining the calories of the ethanol in the drinking water consumed with the calo-ries of the standard chow diet eaten, the data obtained indicate that the total calorie intake per day of 3 and 7% ethanol rats was similar to that observed in control rats (Table 1). Differently, in the 4.5% ethanol-treated rats the total calorie intake per day was reduced (P<0.001) compared to all other groups (Table 1).
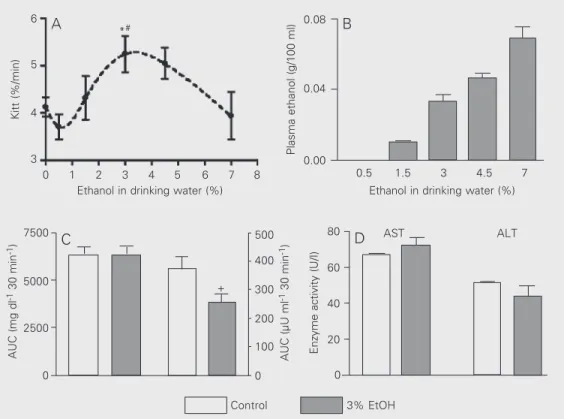
Ethanol-feeding affects Kitt during IVITT. After 4 weeks of treatment, the animals of all groups were submitted to an IVITT, and the results are shown in Figure 1A. The response of the rats treated with ethanol concentra-tions of 0.5, 1.5 and 7% in the drinking water yielded a Kitt value similar to that deter-mined for the control rats, indicating the same insulin sensitivity for these animals. However, 3% ethanol in the drinking water clearly altered the response of the rats, re-sulting in an increased Kitt value [5.41 ± 0.39 (3% ethanol) vs 4.13 ± 0.21 (control), 3.71 ± 0.27 (0.5% ethanol) and 3.94 ± 0.50%/ min (7% ethanol); P<0.05 vs 0.5 and 7% and P<0.01 vs control, ANOVA]. The 1.5 and 4.5% ethanol-treated rats showed an inter-mediate response with an inverted U-shaped relationship between alcohol intake and
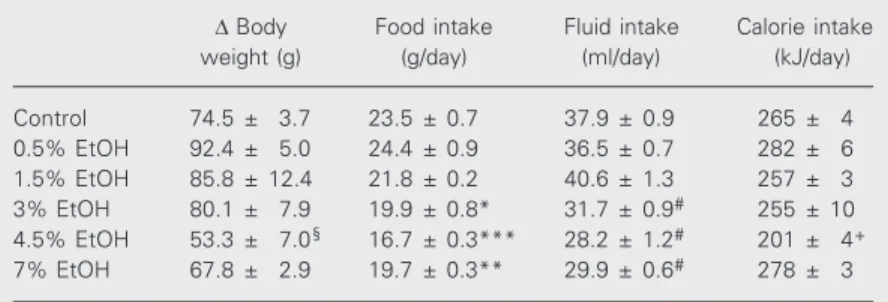
in-Table 1. Characteristics of Wistar rats treated without (control) or with different ethanol (EtOH) concentrations (0.5, 1.5, 3, 4.5 and 7%, v/v) in the drinking water.
D Body Food intake Fluid intake Calorie intake weight (g) (g/day) (ml/day) (kJ/day)
Control 74.5 ± 3.7 23.5 ± 0.7 37.9 ± 0.9 265 ± 4 0.5% EtOH 92.4 ± 5.0 24.4 ± 0.9 36.5 ± 0.7 282 ± 6 1.5% EtOH 85.8 ± 12.4 21.8 ± 0.2 40.6 ± 1.3 257 ± 3 3% EtOH 80.1 ± 7.9 19.9 ± 0.8* 31.7 ± 0.9# 255 ± 10 4.5% EtOH 53.3 ± 7.0§ 16.7 ± 0.3*** 28.2 ± 1.2# 201 ± 4+ 7% EtOH 67.8 ± 2.9 19.7 ± 0.3** 29.9 ± 0.6# 278 ± 3
Delta body weight is the difference between final (after 4 weeks treatment) and initial body weight. Data are reported as means ± SEM for 26 control animals, and for 6 to 12 animals from each ethanol-treated group. Food, fluid and calorie intake were meas-ured during the 4 weeks of treatment (2 measurements per week).
sulin sensitivity, confirming that high etha-nol consumption was not able to improve insulin sensitivity.
Consumption of 3% ethanol induces en-hanced insulin sensitivity during the IVGTT. To confirm that 3% ethanol in the drinking water can induce ethanol-enhanced insulin sensitivity, additional animals were used for an IVGTT after 4 weeks of treatment (Figure 1C). Control and 3% ethanol-treated rats showed the same plasma glucose profile dur-ing the IVGTT, and the calculation of the AUC revealed almost identical values (6335.9 ± 413.5 for control vs 6335.5 ± 414.8 for 3% ethanol). However, the glucose challenge caused a different profile of plasma insulin for control and ethanol-treated rats. As shown in Figure 1C, the AUC (375.5 ± 39.3 for the control vs 245.2 ± 30.4 for 3% ethanol; P<0.05) revealed that 35% less in-sulin was necessary for the 3% ethanol group to have the same clearance of glucose from plasma, indicating the higher insulin sensi-tivity of these animals.
Consumption of 3% ethanol induces low plasma ethanol levels without causing he-patic injury. Plasma ethanol levels were measured in all groups of animals (Figure 1B) in blood samples obtained early in the morning, a time when the animals were thought to have the highest plasma levels, considering that the drinking behavior oc-curs mainly at night. The plasma ethanol level was undetectable in rats receiving 0.5% ethanol, and progressively increased in rats treated with 1.5 to 7% ethanol. The plasma concentration of 3% ethanol-treated rats was 0.033 ± 0.004 g/100 ml (0.028 g/100 ml in whole blood), which is considered to be a very low concentration.
Treatment with 3% ethanol in the drink-ing water for a total period of 4 weeks did not result in hepatic injury (Figure 1D). At this time point, the control rats showed a plasma AST activity of 67.17 ± 1.20 U/l and an ALT activity of 51.39 ± 0.66 U/l, while the etha-nol-treated rats had activities of 71.90 ± 5.63 and 43.66 ± 6.44 U/l, respectively.
Kitt (%/min)
7500
6 0.08
Plasma ethanol (g/100 ml)
5
4
3
0 1 2 3 4 5 6 7 8
Ethanol in drinking water (%)
0.04
0.00
0.5 1.5 3 4.5 7 Ethanol in drinking water (%)
AUC (mg dl
-1 30 min -1)
5000
2500
0
+
80
Enzyme activity (U/I)
60
40
0 20 500
AUC (µU ml
-1 30 min -1) 400
300
200
100
0 *#
AST ALT
Control 3% EtOH Figure 1. A, Inverted U-shaped
relationship between the rate constant for plasma glucose dis-appearance (Kitt) during an intra-venous insulin tolerance test and ethanol (EtOH) intake. B, Plasma ethanol concentration observed in Wistar rats receiving drinking water with 0.5, 1.5, 3, 4.5 and 7% (v/v) EtOH after 4 weeks of treatment. C, Area under the curve (AUC) of plasma glucose and insulin during an intravenous glucose tolerance test. D, Plasma aspartate aminotrans-ferase (AST) and alanine ami-notransferase (ALT) activities in rats receiving drinking water without (control) or with 3% EtOH. Data are reported as means ± SEM. *P<0.05 vs 0.5 and 7% EtOH (ANOVA); #P<0.01
vs control (ANOVA); +P<0.05 vs control (Student t-test).
A B
In the present study, chronic treatment of male Wistar rats with 3% (v/v) ethanol in the drinking water over a period of 4 weeks resulted in enhanced insulin sensitivity, while lower or higher concentrations of ethanol in the drinking water had no such effect. This finding strongly supports the idea proposed in some human studies of an inverse U-shaped relationship between alcohol intake and insulin sensitivity (12,14,15). However, it is reasonable to assume that at higher alcohol concentrations the inverse U-shaped relationship changes to an inverse J-shaped relationship since other human and animal studies have demonstrated that ethanol con-sumption can impair insulin-mediated glu-cose uptake and cause insulin resistance (17-19).
The consequence of both inverse U- and J-shaped relationships is that only a certain range of alcohol can improve insulin sensi-tivity, and it will be interesting to determine if the applied ethanol concentration (3% etha-nol in the drinking water, equivalent to 9% of total calories) also has an effect on CHD risk factors like LDL cholesterol, fibrinogen and HDL cholesterol. This idea is supported by another study (20) in which Sprague-Dawley rats were fed a liquid diet containing 9% ethanol as total calories and showed cardiovascular protection after several weeks of treatment.
It is important to note that improvement of insulin sensitivity was achieved in normal
non-obese rats, in which glucose homeosta-sis is strongly controlled. Although 3% etha-nol treatment for 4 weeks induced a slight reduction in food consumption, the total calo-rie intake was unchanged, a fact that may be responsible for the preserved body weight. The absence of weight loss indicates that low ethanol consumption is the main factor responsible for the improvement of insulin sensitivity. Recovery of insulin sensitivity induced by ethanol treatment was reported in severely obese insulin-resistant mice, which, however, showed an important weight loss (20). Additionally, the 20% (v/v) etha-nol used (20) was a very high dose, as shown by the blood ethanol levels of the animals which were 2.5 times higher than the 3% ethanol levels observed in the present study. The low ethanol consumption by 3% etha-nol-treated rats had no effect on ALT or AST enzyme activity, suggesting preserved liver function and reinforcing the idea of a direct action of ethanol on the mechanisms in-volved in insulin sensitivity.
We showed that low ethanol consump-tion can improve insulin sensitivity, which is not related to the loss of weight. Clarifying these details will not only shed light on the phenomenon of ethanol-enhanced insulin sensitivity, but the identification of the in-volved mechanism(s) will also give an idea if the relevant pathway can be triggered by a drug, thus offering a possible option for a new treatment of diabetes.
References
1. Doll R (1997). One for the heart. British Medical Journal, 315: 1664-1668.
2. Kannel WB & Ellison RC (1996). Alcohol and coronary heart disease: the evidence for a protective effect. Clinica Chimica Acta, 246: 59-76.
3. Criqui MH (1996). Alcohol and coronary heart disease: consistent relationship and public health implications. Clinica Chimica Acta, 246: 51-57.
4. Rimm EB, Giovannucci EL, Willett WC, Colditz GA, Ascherio A, Rosner B & Stampfer MJ (1991). Prospective study of alcohol con-sumption and risk of coronary disease in men. Lancet, 338: 464-468. 5. Klatsky AL, Armstrong MA & Friedman GD (1992). Alcohol and
mortality. Annals of Internal Medicine, 117: 646-654.
6. Doll R, Peto R, Hall E, Wheatley K & Gray R (1994). Mortality in relation to consumption of alcohol: 13 years’ observations on male British doctors. British Medical Journal, 309: 911-918.
7. Preedy VR & Richardson PJ (1994). Ethanol induced cardiovascular disease. British Medical Bulletin, 50: 152-163.
study). British Medical Journal, 313: 1040-1044.
10. Facchini F, Chen YD & Reaven GM (1994). Light-to-moderate alcohol intake is associated with enhanced insulin sensitivity. Diabetes Care, 17: 115-119.
11. Van de Wiel A (1998). Alcohol and insulin sensitivity. Netherlands
Journal of Medicine, 52: 91-94.
12. Lazarus R, Sparrow D & Weiss ST (1997). Alcohol intake and insulin levels. The normative aging study. American Journal of Epidemiol-ogy, 145: 909-916.
13. Valmadrid CT, Klein R, Moss SE, Klein BE & Cruickshanks KJ (1999). Alcohol intake and the risk of coronary heart disease mortality in persons with older-onset diabetes mellitus. Journal of the American
Medical Association, 282: 239-246.
14. Razay G & Heaton KW (1997). Moderate alcohol consumption has been shown previously to improve insulin sensitivity in men. British
Medical Journal, 314: 443-444.
15. Bell RA, Mayer-Davis EJ, Martin MA, D’Agostino Jr RB & Haffner SM (2000). Associations between alcohol consumption and insulin sensi-tivity and cardiovascular disease risk factors: the insulin resistance and atherosclerosis study. Diabetes Care, 23: 1630-1636.
16. Bonora E, Moghetti P, Zancanaro C, Cigolini M, Querena M, Cacciatoni V, Corgnati A & Muggeo M (1989). Estimates of in vivo
insulin action in man: comparison of insulin tolerance tests with euglycemic and hyperglycemic glucose clamp studies. Journal of
Clinical Endocrinology and Metabolism, 68: 374-378.
17. Shelmet JJ, Reichard GA, Skutches CL, Hoeldtke RD, Owen OE & Boden G (1988). Ethanol causes acute inhibition of carbohydrate, fat and protein oxidation and insulin resistance. Journal of Clinical
Inves-tigation, 81: 1137-1145.
18. Yki-Jaervinen H & Nikkila EA (1985). Ethanol decreases glucose utilization in healthy men. Journal of Clinical Endocrinology and
Metabolism, 61: 941-945.
19. Binsack R, White CR, Darley-Usmar V, Foster C, Zhou F & Parks DA (1999). Chronic moderate alcohol consumption results in induction of nitric oxide synthase and cardiovascular protection. Free Radical
Biology and Medicine, 27: S72 (Abstract).