Low caloric value of ethanol itself
increases alveolar bone loss in
ligature-induced periodontitis in male rats
Abstract: This study aimed at morphometrically evaluating the inluence of variable caloric values of ethanol consumption on alveolar bone loss in periodontitis in male rats. Thirty-six male rats were randomized into four groups of nine rats each, as follows: Test group A (low) - rats were fed an ethanol-containing liquid diet (ethanol representing 22% of total caloric value); Control group A - rats were fed a pair-fed control diet (ethanol replaced by isocaloric amounts of carbohydrate); Test group B (high) - rats were fed an ethanol-containing liquid diet (ethanol repre-senting 36% of total caloric value); Control group B - rats were fed a pair-fed control diet for Test B. Following anesthesia, cotton ligatures were placed around the cervix of the right upper second molar. At eight weeks, the maxillary bones were removed and alveolar bone loss was analyzed by measuring the distance between the cementoenamel junc-tion and the alveolar bone crest at buccal and palatal sites of the upper second molar. The unligated groups showed no signiicant differences between the bone loss values observed for the low and high caloric values of ethanol (p > 0.05). In the ligated groups, the rats receiving low caloric values of ethanol showed signiicantly greater bone loss compared to the isocaloric rats (p < 0.05); however, the rats receiving high caloric values of ethanol showed no signiicant differences compared to the controls. Analysis of the results demonstrated that, in male rats, ethanol itself af-fected ligature-induced bone loss when representing a low value in the total caloric value.
Descriptors: Ethanol; Alveolar bone loss; Periodontitis.
Daniela Martins de Souza(a) Rosilene Fernandes da Rocha(b)
(a) PhD, Dentistry Course, Pindamonhangaba
College (FAPI), Christian Life University Foundation, Pindamonhangaba, SP, Brazil.
(b) PhD, School of Dentistry, São Paulo State
University (UNESP), São José dos Campos, SP, Brazil.
Corresponding author:
Daniela Martins de Souza
Rua Armando Sales de Oliveira, 274, apto. 53, Centro
Taubaté - SP - Brazil CEP: 12030-080
E-mail: [email protected]
Introduction
Periodontitis involves the destruction of support-ing structures of the teeth, includsupport-ing the alveolar bone.1 Periodontitis is an infectious disease with a limited number of speciic bacteria as disease initia-tors and host facinitia-tors, which are the major determi-nants of disease occurrence and severity.2
A large variety of host characteristics inluence the progression of periodontitis, including behavior-al, socibehavior-al, systemic and genetic factors and the health of the host teeth.3-5 Social and behavioral factors in-clude cigarette smoking, socioeconomic status, nu-tritional status, psychological factors and excessive alcohol consumption.4 Research suggests that alco-hol consumption is associated with increased sever-ity of periodontitis and may be a risk indicator for periodontal disease.6,7
The use of rat models has been validated in the evaluation of periodontal pathogenesis8 and in the assessment of the inluence of risk factors, such as nicotine9 alcohol10,11,12 and stress,13 on disease pro-gression.
Most studies6,7,14-18 in humans reporting on the association between alcohol and periodontal disease showed that alcohol consumption has a negative ef-fect on periodontal tissues. However, other studies in humans have shown no relationship19 or a limited relationship20 between periodontal disease and alco-hol consumption.
Considering that further studies are required to test the effect of ethanol consumption on periodon-titis development, this study aimed at morphomet-rically evaluating the inluence of variable caloric values of ethanol consumption on alveolar bone loss associated with ligature-induced periodontitis in male rats.
Material and Methods
AnimalsThe Institutional Animal Research Committee, São Paulo State University (São José dos Campos, SP, Brazil) approved the protocol for all the experi-mental procedures performed.
Thirty-six adult male Wistar rats (4 months-old) weighing an average of 460 g were randomized into four groups (9 rats per group), as follows: Test group
A (low) - rats were fed an ethanol-containing liquid diet with ethanol representing 22% of total caloric value; Control group A - rats were fed a pair-fed control diet (ethanol replaced by isocaloric amounts of carbohydrate); Test group B (high) - rats were fed an ethanol-containing liquid diet with ethanol representing 36% of total caloric value; and Con-trol group B - rats were fed a pair-fed conCon-trol diet (ethanol replaced by isocaloric amounts of carbohy-drate).
Experimental procedures
In Test group A, rats received a 10% ethanol so-lution (v/v) (Ecibra, CETUS, Santo Amaro, SP, Bra-zil) and, in Test group B, rats received a 20% etha-nol solution (v/v), in addition to standard rat chow (Guabi Nutrilador, Mogiana Alimentos, Campinas, SP, Brazil), both provided ad libitum.
The mean quantities of rat chow and ethanol so-lution consumed were calculated daily and one day after ethanol administration. The control rats were fed an equal amount of rat chow as that consumed by rats in the alcohol group and an equal volume of liquid diet, with the ethanol replaced by isocaloric amounts of carbohydrate.
At the end of the experimental period, the mean quantity of ethanol consumed represented 22% of the total dietary energy intake per day in Test group A and 36% of the total dietary energy intake per day in Test group B.
Prior to the experimental period, the rats com-prising Test group A and Test group B were sub-jected to an adaptation period in which the ethanol concentration was increased until it reached experi-mental concentrations. A solution containing 5% ethanol was administered to ethanol Test group A for seven days, and ethanol Test group B received 5% ethanol for seven days and then 10% ethanol for another seven days.
up-per second molar, while the contralateral teeth re-mained unligated to serve as controls. The ligature was knotted on the buccal side of the tooth.
After eight weeks, the rats were sacriiced by decapitation and the maxillary bones were ixed in 10% neutral formalin for 48 h.
Morphometric analysis
The maxillae were deleshed and stained with an aqueous methylene blue solution (1%) in order to differentiate bone from teeth.
Alveolar bone loss was evaluated morphometri-cally by measuring the distance between the cemen-toenamel junction (CEJ) and the alveolar bone crest (ABC) at two buccal and two palatal sites in each maxilla. Three measurements were made along the long axis of the roots of the upper second molar on each side using the image analysis system Image Tool v.3.0 (UTHSCSA, San Antonio, TX, USA). The mean of these measurements was used as the measurement of alveolar bone loss on the buccal and palatal sides and per tooth. All measurements were made blind to the group to which the rat pertained.
In order to obtain suficient reproducibility of the molar alignment on the image, the teeth should not overlap each other interproximally, and the buc-cal cusp tip of each molar should be superimposed on the corresponding lingual cusp tip.
Statistical analysis
The independent sample t-test was used to com-pare the differences between the diets consumed in the Test and Control groups.
The paired t-test was used to compare weight between baseline and inal rat body weight in all groups, while the independent sample t-test was used to compare variations in weight between the Test and Control groups for low and high caloric values.
For morphometric analysis, the data were ex-pressed as mean and standard deviation (mm) and the independent sample t-test was used to determine signiicant differences in alveolar bone loss between the treatment groups (Test and Control for low and high caloric values) for ligated and unligated rats, separately. The paired t-test was used to compare al-veolar bone loss between ligated and unligated teeth for the Test and Control groups.
Statistical signiicance for all differences was es-tablished at 5% (p < 0.05).
Results
Diet and weight analysis
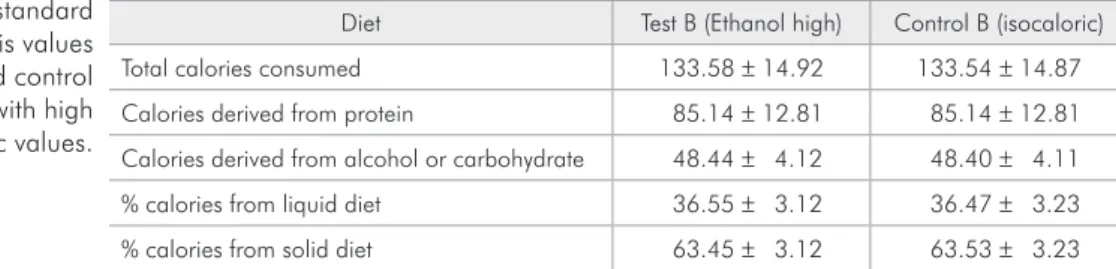
Diet analysis showed no signiicant differences in diet consumption (p > 0.05) between the Test and Control groups for low (Table 1) or high (Table 2) caloric values, considering the total number of calo-ries consumed (kcal/day), calocalo-ries derived from pro-tein, calories derived from alcohol or carbohydrate
Diet Test A (Ethanol Low) Control A (isocaloric)
Total calories consumed 126.34 ± 10.37 125.58 ± 10.18
Calories derived from protein 99.14 ± 10.13 98.69 ± 9.92
Calories derived from alcohol or carbohydrate 27.20 ± 1.08 26.88 ± 1.08
% calories from liquid diet 21.72 ± 1.83 21.54 ± 1.81
% calories from solid diet 78.28 ± 1.83 78.46 ± 1.81
Table 1 - Mean and standard deviation of diet analysis values (kcal/day) for the test and control groups associated with low caloric values.
Diet Test B (Ethanol high) Control B (isocaloric)
Total calories consumed 133.58 ± 14.92 133.54 ± 14.87
Calories derived from protein 85.14 ± 12.81 85.14 ± 12.81
Calories derived from alcohol or carbohydrate 48.44 ± 4.12 48.40 ± 4.11
% calories from liquid diet 36.55 ± 3.12 36.47 ± 3.23
% calories from solid diet 63.45 ± 3.12 63.53 ± 3.23
and the percentage of calories of the liquid and solid diets.
Diet analysis showed that ethanol represented 21.72% (± 1.83) of the total dietary energy intake in Test group A and no signiicant difference (p > 0.05) was detected when compared to the control. In Test group B, ethanol represented 36.55% (± 3.12) of the total dietary energy intake and no signiicant differ-ence (p > 0.05) was detected when compared to the control.
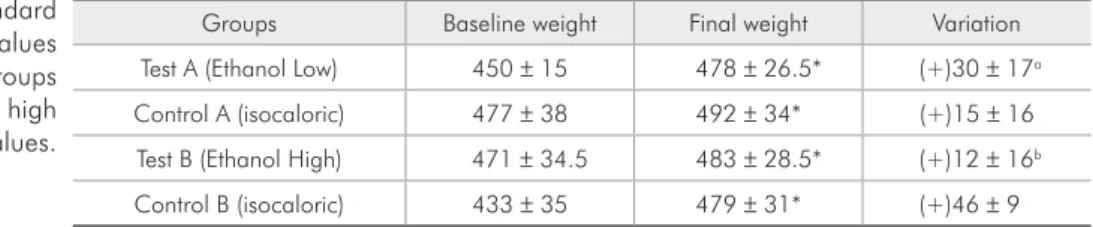
The systemic effect of alcohol consumption ob-served by analysis of rat body weight showed that Test group A (p = 0.007) and Test group B (0.0257) gained weight during the experimental period. Weight gain was also observed in Control group A (p = 0.0104) and Control group B (p = 0.0000).
Analysis of rat body weight showed that weight gain was greater (p = 0.0436) in the ethanol group than in the carbohydrate group associated with a diet of low caloric value (groups A). However, anal-ysis of rat body weight associated with a diet of high caloric value (groups B) showed that weight gain
was greater (p = 0.0001) in the carbohydrate group than in the ethanol group (Table 3).
Morphometric analysis
Morphometric analysis showed that cotton liga-tures placed around the teeth induced alveolar bone loss, which was conirmed by the greater bone loss (p < 0.05) observed in ligated teeth compared to un-ligated teeth.
In unligated teeth associated with low caloric diet, intergroup analysis showed no signiicant dif-ferences in alveolar bone loss between Test group A and Control group A rats regarding the whole tooth (p = 0.4160), buccal side (p = 0.2796) and palatal side (p = 0.4270) (Graph 1). However, morphomet-ric analysis revealed a signiicantly greater bone loss in ligated teeth in rats that received 22% of caloric value of ethanol regarding the whole tooth (p = 0.0230), buccal side (p = 0.0440) and palatal side (p = 0.0431) (Graph 2).
No signiicant intergroup differences were ob-served in alveolar bone loss between unligated teeth
Groups Baseline weight Final weight Variation
Test A (Ethanol Low) 450 ± 15 478 ± 26.5* (+)30 ± 17a
Control A (isocaloric) 477 ± 38 492 ± 34* (+)15 ± 16
Test B (Ethanol High) 471 ± 34.5 483 ± 28.5* (+)12 ± 16b
Control B (isocaloric) 433 ± 35 479 ± 31* (+)46 ± 9
*p < 0.05, baseline compared with final value (paired t test). ap < 0.05, compared with the Control A group
(independent t test). bp < 0.05, compared with the Control B group (independent t test).
Table 3 - Mean and standard deviation of weight analysis values (g) for the test and control groups associated with low and high caloric values. 1.2 1.0 0.8 0.6 0.0 0.2 0.4 B o ne lo ss in u nligated teeth (m m)
teeth buccal palatal
Test A (low ethanol) Control A (low isocaloric)
0 .3 9 0 .3 9 0 .3 1 0 .3 0 0 .4 7 0 .4 8
Graph 1 - Mean and standard deviation of alveolar bone loss (mm) in unligated teeth associated with low caloric val-ues of ethanol and carbohydrate. *Statistically significant (ANOVA and Tukey test; p < 0.05).
Graph 2 - Mean and standard deviation of alveolar bone loss (mm) in ligated teeth associated with low caloric values of ethanol and carbohydrate. *Statistically significant (ANO-VA and Tukey test; p < 0.05).
1.2 1.0 0.8 0.6 0.0 0.2 0.4 B o ne lo ss in ligated teeth (mm )
teeth buccal palatal
Test A (low ethanol + lig) Control A (low isocaloric + lig)
associated with high caloric diet. The analysis com-pared means between Test group B and Control group B regarding the whole tooth (p = 0.5195), buc-cal side (p = 0.7383) and palatal side (p = 0.6721) (Graph 3). In ligated teeth, analysis revealed no sta-tistic signiicance in periodontal bone destruction between these groups regarding the whole tooth (p = 0.2636), buccal side (p = 0.3450) and palatal side (p = 0.3289) (Graph 4).
Discussion
Evidence exists that persistent alcohol abuse af-fects periodontal disease severity6,7,16,18 in patients. However, in some studies in humans this relation-ship has not been veriied.19,20
An important study involving 13,198 individuals determined a moderate but consistent dose-depen-dent relationship between alcohol consumption and increased periodontal disease severity, represented by clinical attachment loss.7 Another study showed that persistent alcohol abuse, as determined by the presence of blood levels of a liver enzyme indicator of alcohol consumption, affects the severity of peri-odontal disease and established a positive correla-tion with loss of periodontal attachment.18
The Hisayama study20 did not determine a signif-icant relation between drinking and clinical attach-ment loss, which may be due to the small sample size in this work and, more speciically, to the low num-ber of alcohol consumers. Another study19 in adults found no signiicant effects of alcohol consumption
on periodontal disease severity; however, drink-ers were deined as individuals who consumed any type of alcoholic beverage and at least 12 alcoholic beverages in a one-year period. The authors used in-formation regarding quantities per period that were much lower than those used in studies that found a signiicant interaction between alcoholic drinks consumed per week and periodontal disease.6,7
Animal models have been used to investigate the inluence of risk indicators/factors on the progres-sion of periodontitis,9-13 because the structure of rat periodontal tissue is very similar to that of hu-mans.21 The association between alcohol consump-tion and periodontal disease has been the subject of recent analysis in this animal model.10-12
The experimental period of alcohol consump-tion used was based on previous studies involving rats that showed the negative effects of ethanol on bone metabolism over eight weeks.22,23 This same experimental period was used in the present study and others10-12 that evaluated the inluence of etha-nol consumption on periodontal disease in rats.
The morphometric method in rats was used be-cause it is considered a reproducible method, it has the ability to discriminate between experimental groups24,25 and the measurements obtained with it are not signiicantly different from the histological measurements of alveolar bone level in ligatured rats.26
In the present study, the ligature-induced peri-odontitis lasted for 56 days because it was
associat-Graph 3 - Mean and standard deviation of alveolar bone loss (mm) in unligated teeth associated with high caloric values of ethanol and carbohydrate. *Statistically significant (ANOVA and Tukey test; p < 0.05).
1.2 1.0 0.8 0.6 0.0 0.2 0.4 B o ne lo ss in u nligate d teeth (m m)
teeth buccal palatal
Test B (high ethanol) Control B (high isocaloric)
0 .4 0 3 0 .4 0 9 0 .3 4 8 0 .3 5 4 0 .4 5 8 0 .4 6 4
Graph 4 - Mean and standard deviation of alveolar bone loss (mm) in ligated teeth associated with high caloric values of ethanol and carbohydrate. *Statistically significant (ANO-VA and Tukey test; p < 0.05).
1.2 1.0 0.8 0.6 0.0 0.2 0.4 B o ne lo ss in ligated teeth (mm )
teeth buccal palatal
Test B (high ethanol + lig) Control B (high isocaloric + lig)
ed with the total experimental period of ethanol ad-ministration. The same period was used to evaluate the inluence of alcohol consumption on periodontal support in experimental periodontitis in rats.11
Among alcoholics, ethanol consumption repre-sents a high percentage of the total dietary energy intake. As a consequence, alcohol displaces many normal dietary nutrients resulting in primary mal-nutrition. Moreover, secondary malnutrition may result from maldigestion or malabsorption caused by gastrointestinal complications.27
The reduction in human body weight during chronic alcohol consumption is associated with the fact that part of the daily diet calorie intake is provided by the alcoholic beverage;27 however, this impact on weight is rarely observed in rats.28 In the present study, the systemic effect of alcohol con-sumption observed by analysis of rat body weight showed that groups that consumed ethanol or carbohydrates gained weight. Similarly, Irie et al.12, (2008) showed a weight gain in ethanol and isocalo-ric groups during the experimental period.
In this study, analysis of the results indicated that chronic ethanol feeding alone may not be capable of causing bone loss in rats associated with low (22%) or high (36%) caloric values. In contrast, Irie et al.12, (2008) showed that the distance between the cemen-toenamel junction and the alveolar bone crest was greater in the ethanol group (36% calories derived from ethanol) than in the respective control group.
In the presence of experimental periodontitis,
the effects of alcohol on alveolar bone loss observed in this study were dependent on the different caloric values of ethanol intake. Ethanol representing low caloric values (22% of total caloric value) aggravat-ed the bone loss in ligature-inducaggravat-ed periodontitis. When ethanol represents high caloric values (36% of total caloric value) in the diet it may also pres-ent an indirect effect on periodontal tissue, affecting ligature-induced bone resorption, because primary and secondary malnutrition can develop that direct-ly affects the pathogenesis of periodontitis.
In the presence of experimental periodontitis, Irie et al.12 (2008) showed that a high dose of etha-nol itself (36% of total calories in the diet) was not capable of affecting ligature-induced bone resorp-tion, or apical migration of junctional epithelium. However, a higher density of polymorphonuclear leukocytes was observed, increasing the severity of periodontal inlammation in the ligature model of male rats.
The results of this study suggest that ethanol may affect alveolar bone level differently in the presence or absence of experimental periodontitis and asso-ciation with low or high caloric values of ethanol intake.
Conclusion
In conclusion, this study demonstrated that in male rats, ethanol itself increased ligature-induced bone loss when representing a low value in the total calorie intake.
References
1. Kinane DF. Causation and pathogenesis of periodontal dis-ease. Periodontol 2000. 2001;25:8-20.
2. Page RC, Offenbacher S, Schroeder HE, Seymour GJ, Ko-rnman KS. Advances in the pathogenesis of periodontitis: summary of developments, clinical implications and future directions. Periodontol 2000. 1997;14:216-48.
3. Genco RJ. Current view of risk factors for periodontal dis-eases. J Periodontol. 1996;67(10):1041-9.
4. Nunn ME. Understanding the etiology of periodontitis: an overview of periodontal risk factors. Periodontol 2000. 2003;32:11-23.
5. Stanford TW, Rees TD. Acquired immune suppression and other risk factors/indicators for periodontal disease progres-sion. Periodontol 2000. 2003;32:118-35.
6. Tezal M, Grossi SG, Ho AW, Genco RJ. The effect of al-cohol consumption on periodontal disease. J Periodontol. 2001;72(2):183-9.
7. Tezal M, Grossi SG, Ho AW, Genco RJ. Alcohol consump-tion and periodontal disease. The Third Naconsump-tional Health and Nutrition Examination Survey. J Clin Periodontol. 2004;31(7):484-8.
8. Weinberg MA, Bral M. Laboratory animal models in peri-odontology. J Clin Periodontol. 1999;26(6):335-40. 9. Bosco AF, Bonfante S, Almeida JM, Luize DS, Nagata MJH,
10. Souza DM. Efeito do consumo de álcool na periodontite induzi-da experimentalmente em ratos [Tese de Doutorado]. Faculinduzi-dade de Odontologia de São José dos Campos da UNESP; 2006. 11. Souza DM, Ricardo LH, Prado MA, Prado FA, Rocha RF.
The effect of alcohol consumption on periodontal bone sup-port in experimental periodontitis in rats. J Appl Oral Sci. 2006;14(6):443-7.
12. Irie K, Tomofuji T, Tamaki N, Sanbe T, Eruni D, Azuma T
et al. Effects of ethanol consumption on periodontal inflam-mation in rats. J Dent Res. 2008;87(5):456-60.
13. Peruzzo DC, Benatti BB, Antunes IB, Andersen ML, Sallum EA, Casati MZ et al. Chronic Stress may modulate periodontal disease: a study in rats. J Periodontol. 2008;79(4):697-704. 14. Hornecker E, Muuss T, Ehrenreich H, Mausberg RF. A pilot
study on the oral conditions of severely alcohol addicted per-sons. J Contemp Dent Pract. 2003;4(2):51-9.
15. Novacek G, Plachetzky V, Potzi R, Lentner S, Slaviccek R, Gangl A et al. Dental and periodontal disease in patients with cirrhosis: role of etiology of liver disease. J Hepatol. 1995;22(5):576-82.
16. Pitiphat W, Merchant AT, Rimm EB, Joshipura KJ. Alco-hol consumption increases periodontitis risk. J Dent Res. 2003;82(7):509-13.
17. Nishida N, Tanaka M, Hayashi N, Nagata H, Takeshita T, Na-kayama K et al. Association of ALDH2 genotypes and alcohol
consumption with periodontitis. J Dent Res. 2004;83(2):161-5.
18. Khocht A, Janal M, Schleifer S, Keller S. The influence of gingival margin recession on loss of clinical attachment in alcohol-dependent patients without medical disorders. J Peri-odontol. 2003;74(4):485-93.
19. Torrungruang K, Tamsailom S, Rojanasomsith K, Sutdhibhisal S, Nisapakultorn K, Vanichjakvong O et al. Risk indicators of
disease in older Thai adults. J Periodontol. 2005;76(4):558-65.
20. Shimazaki Y, Saito T, Kiyohara Y, Kato I, Kubo M, Iida M
et al. Relationship between drinking and periodontitis: the Hisayama study. J Periodontol. 2005;76(9):1534-41. 21. Page RC, Schroeder HE. Periodontitis in man and other
ani-mals: a comparative review. New York: Karger; 1982. 22. Hogan HA, Sampson HW, Cashier E, Ledoux N. Alcohol
con-sumption by young actively growing rats: a study of cortical bone histomorphometry and mechanical properties. Alcohol Clin Exp Res. 1997;21(5):809-16.
23. Hogan HA, Argueta F, Moe L, Nguyen LP, Sampson HW. Adult-onset alcohol consumption induces osteopenia in female rats. Alcohol Clin Exp Res. 2001;25(5):746-54.
24. Klausen B, Evans RT, Sfintescu C. Two complementary meth-ods of assessing periodontal bone level. Scand J Dent Res. 1989;97(6):494-9.
25. Souza DM, Rosa LP, Ricardo LH, Moraes L C, Rocha RF. Avaliação óssea alveolar de Rattus norvegicus por meio dos métodos radiográfico e morfométrico. Cienc Odontol Bras. 2005;8(4):77-84.
26. Fernandes MI, Gaio EJ, Oppermann RV, Rados PV, Rösing CK. Comparison of histometric and morphometric analyses of bone height in ligature-induced periodontitis in rats. Braz Oral Res. 2007;21(3):216-21.
27. Lieber CS. Relationships between nutrition, alcohol use, and liver disease. Alcohol Res Health. 2003;27(3):220-31. 28. Reed AH, McCarty HL, Evans GL, Turner RT, Westerlird