Introducing mapping standards in the quality assessment of buildings
extracted from very high resolution satellite imagery
S. Freire
a,⇑, T. Santos
a, A. Navarro
b, F. Soares
b, J.D. Silva
b, N. Afonso
c, A. Fonseca
c, J. Tenedório
a ae-GEO, Faculdade de Ciências Sociais e Humanas (FCSH), Universidade Nova de Lisboa, Av. de Berna, 26-C, 1069-061 Lisboa, PortugalbInstituto Dom Luiz, University of Lisbon, Lisbon, Portugal
cNational Laboratory for Civil Engineering (LNEC), Av. do Brasil, 101, 1700-066 Lisboa, Portugal
a r t i c l e
i n f o
Article history:
Received 11 October 2012
Received in revised form 13 December 2013 Accepted 24 December 2013
Available online 6 February 2014
Keywords: QuickBird Feature extraction Buildings Urban Accuracy Lisbon
a b s t r a c t
Many municipal activities require updated large-scale maps that include both topographic and thematic information. For this purpose, the efficient use of very high spatial resolution (VHR) satellite imagery sug-gests the development of approaches that enable a timely discrimination, counting and delineation of urban elements according to legal technical specifications and quality standards. Therefore, the nature of this data source and expanding range of applications calls for objective methods and quantitative met-rics to assess the quality of the extracted information which go beyond traditional thematic accuracy alone. The present work concerns the development and testing of a new approach for using technical mapping standards in the quality assessment of buildings automatically extracted from VHR satellite imagery. Feature extraction software was employed to map buildings present in a pansharpened Quick-Bird image of Lisbon. Quality assessment was exhaustive and involved comparisons of extracted features against a reference data set, introducing cartographic constraints from scales 1:1000, 1:5000, and 1:10,000. The spatial data quality elements subject to evaluation were: thematic (attribute) accuracy, completeness, and geometric quality assessed based on planimetric deviation from the reference map. Tests were developed and metrics analyzed considering thresholds and standards for the large mapping scales most frequently used by municipalities. Results show that values for completeness varied with mapping scales and were only slightly superior for scale 1:10,000. Concerning the geometric quality, a large percentage of extracted features met the strict topographic standards of planimetric deviation for scale 1:10,000, while no buildings were compliant with the specification for scale 1:1000.
Ó2014 International Society for Photogrammetry and Remote Sensing, Inc. (ISPRS) Published by Elsevier B.V. All rights reserved.
1. Introduction
A spatial component is associated with the majority of munici-pal activities, namely in urban planning and management. At this level, decision-making is supported by large-scale spatial data that include both topographic and thematic information, but which rapidly become outdated due to the strong dynamics of the urban environment. These frequent changes require faster updating of municipal spatial databases. The combination of widely-available, wide-coverage, cost-effective very high spatial resolution (VHR) satellite imagery and Geographic Object-Based Image Analysis (GEOBIA) hold promise for this purpose, despite the spectral limi-tations of the former (Herold et al., 2003) and the shortcomings of
the latter (Lang, 2008). In a detailed evaluation of classification performance, Herold et al. (2003)identified spectral limitations of IKONOS imagery for pixel-based classification of urban land cov-er, indicating that 4-band VHR satellite imagery are not well suited to capture in detail the unique spectral characteristics of the urban environment (Herold et al., 2003). However, those authors admit the possibility that other classification approaches such as GEOBIA may be more appropriate for urban mapping, potentially enabling increases in map accuracy. Among the weaknesses attributed to GEOBIA methods are the difficulties in processing very large data sets (and VHR satellite scenes can be enormous), the fact that seg-mentation does not have a unique solution, and the insufficient understanding of scale and hierarchical relations among objects derived at multiple resolutions (Hay and Castilla, 2008).
Despite these challenges, there is great potential for expanding the use of VHR satellite imagery for urban management at the mu-nicipal level. In a recent survey (Santos, 2011) of the Portuguese municipalities carried out by the authors, the majority of those
0924-2716/$ - see front matterÓ2014 International Society for Photogrammetry and Remote Sensing, Inc. (ISPRS) Published by Elsevier B.V. All rights reserved.
http://dx.doi.org/10.1016/j.isprsjprs.2013.12.009
⇑ Corresponding author. Tel.: +351 217908300; fax: +351 217908308. E-mail addresses: sfreire@fcsh.unl.pt (S. Freire), teresasantos@fcsh.unl.pt
(T. Santos),acferreira@fc.ul.pt(A. Navarro),fjsoares@fc.ul.pt(F. Soares),dinis.joel@ gmail.com(J.D. Silva),nafonso@lnec.pt(N. Afonso),anafonseca@lnec.pt(A. Fonseca),
ja.tenedorio@fcsh.unl.pt(J. Tenedório).
Contents lists available atScienceDirect
ISPRS Journal of Photogrammetry and Remote Sensing
institutions indicated needing spatial information with higher temporal detail, generally on a monthly basis. The 23% of munici-palities that already use satellite images for land planning and management do it mainly on a daily basis. Of those municipalities that do not use satellite images, 47% have stated that it should be easy to include this data source in their activities. Based on these responses it was concluded that geographic information having higher spatial and temporal detail is required for municipal activ-ities and that VHR satellite imagery could assist in performing those tasks.
Additionally, the nature of this recent data source and target features, the GEOBIA approach, and the expanding range of appli-cations call for additional methods and metrics to assess the qual-ity of the extracted spatial information (Zhan et al., 2005). These methods should advance beyond traditional pixel-based thematic accuracy alone, requiring assessing the quality of discrimination/ classification (thematic quality), detection/counting (complete-ness), and delineation (geometric quality) of features of interest. Object-based accuracy involves both semantic and geometric agreement (Lang, 2008) often of a single class map, since the objec-tive of feature extraction is to distinguish between two classes, ob-ject and background (Rutzinger et al., 2009). Also, an efficient operational use of feature extraction from VHR satellite imagery suggests using accessible commercial-off-the-shelf software for mapping of urban features. However, large-scale topographic map-ping usually has to conform to legal technical specifications and quality standards. These concerns contribute to making accuracy assessment a ‘hot’ research topic in GEOBIA (Blaschke, 2010).
Buildings are a major urban element and one of the main fea-ture classes of interest for a municipality, whose ‘correct’ auto-matic extraction from imagery remains a challenging task, even with the advent of high spatial resolution. Difficulties include scene complexity, building occlusions (trees, shadows), and heter-ogeneity of feature class, and these challenges increase with refine-ment of image resolution (Awrangjeb et al., 2010). To obtain a cartographic product from VHR imagery using feature extraction, most of the challenge results from the interplay of several factors, namely: (a) the object and its context, (b) the nature of imagery, and (c) the mapping requirements and constraints. Despite the many methodologies proposed for feature extraction, none has proved to be effective in all conditions and for all types of data (Salah et al., 2009). For the image analyst/map producer the challenge may be limited to handling the necessary stages of image pre-processing, image segmentation, and generalization of features to produce a map. At present, the quality assessment of extracted buildings is a complex endeavor for which there is no optimum, consensual, or standard approach (Rutzinger et al., 2009). In this context, for a given classified map, quality assessment results will depend and vary with reference data used and accuracy assess-ment method employed, preventing their comparison.
Van Coillie et al. (2008)presented a methodology for a super-vised, objective evaluation of segmentation quality based on quan-titative similarity measures. The methods were tested on a single house, and its manual digitizing was used as reference. Eight qual-ity measures were tested to compare different segmentation layers with the reference one. The discrepancy quality measures included the number of segments that have their centroid in the reference polygon, difference in total area and perimeter, difference in shape complexity, average distance between edge pixels and cumulative distance from the reference.
Regarding polygon generalization, despite being the subject of significant research, there is still a need for comprehensive inves-tigation (Podolskaya et al., 2007). Khoshelham et al. (2009)have conducted a detailed comparative analysis of five automated methods for building detection, but used pixel-based metrics for accuracy assessment.
Accuracy assessment of thematic maps, based on map compar-ison, has often neglected cartometric quantities (Dungan, 2006). In the case of buildings, topographic maps represent the building footprint according to scale-dependent constraints. Vu et al. (2009)propose a multi-scale solution based on mathematical mor-phology for building extraction using LiDAR and image data. This approach allows extraction of complex buildings as scale-dependent multi-part objects and capture building footprint.
Very few studies have introduced mapping specifications in quality assessment of features extracted from satellite imagery.
Holland and Marshall (2004)andHolland et al. (2006)conducted a qualitative evaluation of the potential of QuickBird imagery for updating topographic maps in Great Britain, concluding that the imagery can be used as source of some feature types at scales up to 1:6000 and should be used in a supplementary way to conven-tional data sources.Gianinetto (2008)tested roads and buildings extracted from pansharpened QuickBird imagery for updating large-scale topographic databases of urban areas, considering map-ping specifications of the Lombardia Region. Results showed that updating of scale 1:10,000 was always compliant with standards, while updating of scale 1:5000 was only possible in certain situa-tions. However, the features used for testing were visually inter-preted and manually digitized from the imagery.
The GeoSat research project, which involves the Lisbon City Hall, aims at developing methods to expedite the production of geographic information for municipal planning and land monitor-ing, and investigates the potential of VHR satellite imagery and GEOBIA for detection and mapping of urban features and their integration into operational urban planning and management activities. Previous work (Santos et al., 2009) has explored and pro-posed detailed vector-based metrics for accuracy assessment of QuickBird-derived buildings, but without taking map standards into account.
The main goal of the present research is to present an approach that incorporates existing scale-based mapping constraints from official specifications in the process of quality assessment of build-ing polygons extracted semi-automatically from VHR imagery. The approach was first developed and presented by Freire et al. (2010a). The motivation is to evaluate the feasibility of features ex-tracted from VHR imagery by semi-automatic methods to be able to integrate a municipal GIS database with minimum additional editing. First, buildings were extracted from the image using fea-ture extraction software and ancillary data. The second part in-cluded the development and testing of quality assessment procedures considering thresholds and standards for the different mapping scales used by municipalities, analysis of metrics, and dis-cussion of results.
2. Study area and data
2.1. Study area
For this study, an area located to the northeast of the downtown of the city of Lisbon, Portugal, was selected (Fig. 1). This area occu-pies 64 ha (800 m800 m), and has a diverse land use/land cover (LULC) that varies from urban to open field with and without veg-etation. It includes trees, lawns, herbaceous vegetation and agricul-tural plots, bare soil, a school, industrial properties, roads and rail networks, and residential housing. This latter use includes a mix-ture of single homes and multi-story apartment buildings. Due to its diversity, this area provided a good testing ground representa-tive of the challenges for feature extraction existing in the city of Lisbon.
urban areas, and although they are referred to as ‘buildings’ in most of the feature extraction literature, they consist of adjacent buildings having the same roof type and height (that may or may not form a whole city block). Building blocks equal buildings for non-contiguous (i.e., detached) buildings.
This study focuses on buildings with red tile roofs, the most common type in Portugal. Red tile roofs are the standard for resi-dential buildings, and these comprise 53% of the total buildings identified in the study area. Despite their visual identification being rather straightforward, these features vary significantly in size (area and height), shape, orientation, and tone/spectral reflec-tance (seeFreire et al., 2010bandTable 3). In the study area, these buildings are present in the form of linear urbanization along roads, planned multi-story apartment complexes, planned neigh-borhoods of adjacent two-story houses, and a few isolated buildings.
2.2. Data sets
Several spectral, altimetric, and planimetric spatial data sets were used for feature extraction and quality assessment, namely: a pansharpened QuickBird image, its multispectral bands, the Nor-malized Difference Vegetation Index (NDVI) derived from these bands, a normalized Digital Surface Model (nDSM), and a vector reference map of building polygons (Table 1).
The QuickBird imagery was acquired in April 14, 2005 with an off-Nadir angle of 12.2°. Although this angle results in noticeable lean in taller buildings, this is not problematic for the present dem-onstration since the reference data used for validation is produced using the same imagery.
The image has a spatial resolution of 2.4 m in the multispectral mode (three visible and one near-infrared band), a pixel size of
0.6 m in the panchromatic mode, and a radiometric resolution of 11 bits. The 0.6 m pixel size is very close to the 0.5 m recom-mended byJensen and Cowen (1999)as minimum geometric res-olution for the detection of building perimeter and area. The imagery was pansharpened (including all bands) and orthorectified in order to reduce the geometric distortions introduced by the ter-rain and to attribute a national projected coordinate system (ETRS89-PT-TM06). A detailed Digital Terrain Model (DTM) with a resolution of 0.5 m was used for the orthorectification. This task was performed using the Rational Polynomial Coefficients (RPCs) provided with the image, and a set of 36 ground control points re-trieved from the 1:1000 planimetric and altimetric cartography of 1998. The RMSE (Root Mean Square Error) of the transformation was assessed at 0.49 m for the pansharp image and 1.07 m for the multispectral. More details on this stage can be found inSantos et al., 2010.
3. Methodology
3.1. Feature extraction
Extraction of building structures (polygons) from the imagery was performed using Feature Analyst 4.2 from Visual Learning Sys-tems (VLS), as an extension for ArcGIS (Esri). Feature Analyst (FA) is a GEOBIA application that conducts an internal ‘hidden’ segmenta-tion of the image that allows to classify and extract only those fea-tures belonging to the class of interest. FA uses an inductive machine learning approach for object recognition, exploring both spectral and spatial (contextual) information, and uses several dif-ferent algorithms depending on the data (Opitz and Blundell, 2008). The classification mode that was used is based on a super-vised approach, so the initial step is the identification of training samples for each class, followed by the definition of parameters such as band data type (e.g., reflectance, elevation), and number of bands to use in the classification, the type of input representa-tion pattern and size, and level of aggregarepresenta-tion (i.e., minimum ob-ject size). The input representation pattern consists in a local window of pixels having a specific spatial configuration that en-ables the algorithm to examine the pixels adjacent and/or in the vicinity of the pixel of interest (the central pixel of the pattern), in order to determine if this pixel belongs to the feature class being Fig. 1.Study area in the city of Lisbon and pansharpened QuickBird image.
Table 1
Main features of data sets used.
Data set Data type Resolution (m)
QuickBird pansharp Raster 0.6
QuickBird multispectral Raster 2.4
NDVI Raster 2.4
nDSM Raster 1
extracted. Several basic representation patterns are made available by the software, with ‘Manhattan’ being a general purpose repre-sentation pattern that works well with block type features such as buildings, in a window size (width) of 5 pixels (VLS, 2008).
The classifier uses feature characteristics such as spectral re-sponse/color, size, shape, texture, pattern, shadow, and spatial association, for feature classification. In the supervised mode, the program analyzes the training set and creates distinct segments based on the training data and the input knowledge. After this ini-tial classification, the user has the possibility of removing clutter (i.e., false positives) or adding missing areas and running the extraction again, thus refining the extraction. The results of this first pass can be corrected and added back into the system as knowledge, and the user can adapt the parameters, in an interac-tive learning process. (Opitz and Blundell, 2008;VLS, 2008). This hierarchical learning adaptive process allows to iteratively im-prove the image classification. The application offers the possibility of post-processing the classified map in order to aggregate and geometrically generalize the features.
After experimenting with other commercial software applica-tions for GEOBIA, FA was selected for this experiment due to its combination of simplicity, favorable learning curve, cost, and fast results, criteria that are important if the application is to be used in a municipal setting, which usually have limited funds and hu-man resources.
For the extraction of buildings with red tile roofs, several data sets were used simultaneously as input: pansharpened and multi-spectral QuickBird imagery, the NDVI grid, and the nDSM layer. The pansharpened QuickBird image is of fundamental importance be-cause it is the main reflectance layer and determines the scale and resolution (spatial detail) that features can be extracted. The use of the nDSM layer allows better discrimination of buildings. In a related previous study conducted bySantos et al. (2010), the overall thematic accuracy of building extraction increased to 72% when an altimetric data set was used in conjunction with Quick-Bird imagery, compared to an accuracy of 60% when using only the spectral information.
The best parameters for the building extraction were selected after trial and error, by visually assessing the output and iteratively fine tuning the parameters for the desired goal.
Feature Analyst includes post-processing tools that allow geo-metric generalization of polygons (smoothing, square up), espe-cially important for man-made features such as buildings and considering the current purpose for their extraction. Since these buildings are mostly rectangular or composed of rectangular ele-ments (as are the majority of buildings in cities of the western world), the extracted ‘raw’ buildings with red tile roofs were geo-metrically generalized (squared up) with the following parame-ters: 1 m smoothing tolerance, 6 pixel squaring tolerance, considering adjoining features and all likely orientations. Smooth-ing tolerance refers to the application of Bezier smoothSmooth-ing, with tolerance being the distance from shape edges where vertices are selected. Squaring tolerance refers to the number of pixels the ends of a line segment in the polygon are allowed to move in order to square up with the remaining segments (VLS, 2008). No further adjustments were made prior to quality assessment.
3.2. Quality assessment
To evaluate the quality of spatial information automatically ex-tracted from images, based on the concept of reference value, it is necessary to measure levels of compliance with information from an independent source. This reference data can be obtained from a field survey (e.g. GPS collection), from an existing map having acceptable accuracy, or from a map created by visual interpretation of the same source data (Congalton and Green, 2009). The latter
approach is commonly followed in accuracy assessment of building extraction (e.g.,Shan and Lee, 2005; Rutzinger et al., 2009; Vu et al., 2009). Ideally, this reference map should be produced by an independent interpreter to avoid biasing the evaluation.
For the study area there is no official 1:10,000 scale map, and the off-nadir look of the QuickBird image used and the resulting ‘leaning’ of buildings would prevent a fair comparison with an offi-cial planimetric map if it existed. Also, topographic maps represent the building footprint, whereas satellite or aerial imagery capture its roof. Due to these limitations, an independent and experienced interpreter created a reference map of building blocks by visual analysis and manual digitizing over the pansharpened image. All the discernible features belonging to the class of interest were dig-itized, without limits of size or shape. No scale-dependent general-ization was applied to this reference data set. Since this reference map is obtained using the conventional procedures (on-screen vi-sual analysis) for digitizing buildings from VHR imagery for map-ping purposes, and has acceptable quality to integrate a municipal spatial database, it is considered appropriate to use as benchmark against which to evaluate buildings extracted by a semi-automated approach.
In this building extraction context, the challenge is less a tradi-tional accuracy assessment of remotely sensed data than it is of correspondence of features and shape similarity. Object-based classification of imagery should be evaluated using object-based methods and metrics, instead of using ‘classical’ pixel-based ap-proaches developed for per-pixel classification. The quantitative analysis of quality was exhaustive and took place in two stages. The first stage involved the comprehensive analysis of all the fea-tures in the class for classification error, and results in the evalua-tion of its thematic accuracy and completeness (lack of errors of omission and commission). The second stage occurs only for those class features that represent the same object in the reference and classification sets (1:1 relationship) and assesses geometric quality and integrity based on tolerances for three large map scales: 1:1000, 1:5 000 and 1:10,000. The ambitious rationale was to test the methodology considering map standards for scales frequently used at the municipal level, although 1:5000 and 1:1000 are theo-retically beyond the mapping scales suitable for the pansharpened QuickBird image. Its 0.6-m pixel size sets 1:6000 as the limit for largest mapping scale possible. This problem is limited by the fact that classification and reference data sets are produced from the same image.
The selected scales imply strict cartographic constraints imple-mented in technical specifications adopted and published by the Portuguese Geographic Institute, the national cartographic author-ity in Portugal (IGP, 2005), for digital topographic data (Table 2). For digital vector data to be approved and homologated by the Institute it needs to meet the technical specifications regarding size (minimum area of features) and planimetric accuracy.
For representation at scale 1:1000, the area of a feature should be equal or greater than 4 m2, and planimetric deviation cannot ex-ceed 0.18 m (RMSE) or has to be smaller than 0.27 m for 90% of the samples. For scale 1:10,000 the area threshold is 20 m2and the reference values for deviation are 1.5 and 2.3 m, respectively. Thematic quality and completeness were assessed with application
Table 2
Constraints for size and planimetric tolerance of features for selected scales of digital topographic data (IGP, 2005).
Map scales Min. area (m2) Tolerance (m)
RMSE 90%
1:1 000 4 0.18 0.27
1:5 000 4 0.75 1.25
of only the area constraint, while geometric quality was evaluated with enforcement of both the area and planimetric tolerance con-straints. The area constraint is imposed by eliminating features smaller than the minimum area indicated in the technical stan-dards to be represented at that scale, therefore not considering them in the analysis of quality.
Imposing the area constraint on both the extraction and refer-ence data sets resulted in no change in the number of features con-sidered for the two larger scales, since the smallest building block is larger than the 4 m2threshold (seeTable 3). For scale 1:10,000 the number of features considered for quality assessment de-creased from 330 to 313 in the reference, and from 316 to 272 in the generalized extraction, because there were several building blocks smaller than 20 m2in both data sets.
To assess theoverall thematic qualityof building extraction, the overlap between classified and reference data is used (Shan and Lee, 2005). This area-based test essentially evaluates the accuracy of the classification in terms of the extent of features and their spa-tial distribution. The extracted and reference polygon data sets are overlain (union), and the overall thematic accuracy (TA) is ob-tained by dividing the area common to the two sets (intersection or overlap) by the area of union, according to the following equation:
TA¼AðE\RÞ
AðE[RÞ ð1Þ
whereEis the extracted data set andRis the reference vector layer. This quality metric takes in consideration mistakes of under-esti-mation and over-estiunder-esti-mation in the extraction of buildings, and is provided as single value for the class in the map.
The analysis ofcompletenessis object-based and made using a reciprocal approach involving the features’ centroids: first, the extracted buildings that contain centroids of buildings in the refer-ence are selected, and considered to be correctly detected; those which were not selected have no correspondence in the reference and stand for error of commission. Then, the centroids of the selected extracted features are used to select reference polygons that contain them; the reference polygons not selected have no correspondence in the extraction and stand for the error of omis-sion. The rationale for this method is that error of commission evaluates the extraction with regards to the reference, while error of omission assesses the reference with regards to the extraction.
The assessment ofgeometric qualityis based on the rationale that polygon area and shape are determined by its outline (edges), so it makes sense to analyze the latter for deviation from a
refer-ence feature (‘ground truth’). The evaluation was initiated by selecting features having 1:1 cardinality (i.e., one instance of the first entity corresponds to only one instance of the second entity) among extracted and reference sets and excluding 1:n andn:1, using overlap. This was performed using the completeness test de-scribed above.
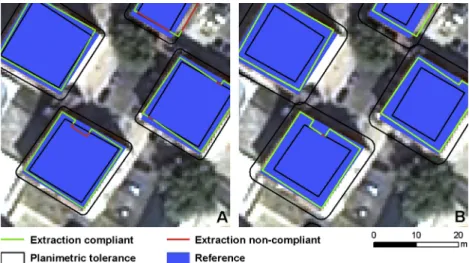
Planimetric tolerance is a constraint devised for point-based testing that was adapted for verifying the compliance of polygons. This was accomplished by buffering each reference building fea-ture using the tolerance distances for each map scale and calculat-ing the percentage of the extracted buildcalculat-ing outline that falls inside the tolerance, i.e. is compliant. Since three map scales having distinct tolerances were considered (seeTable 2), each extracted feature was tested against three scale-dependent tolerances. This process is illustrated inFig. 2for scales 1:5000 and 1:10,000. The general approach is similar to the one used by Samal et al. (2004)to test pairs of polygons for shape similarity.
Since compliance with a RMSE standard is difficult to verify exhaustively in this way, verification of the 90% criteria was adopted instead, with the full outline of the extracted building being analyzed. If 90% of more of the length of the building outline meets the tolerance (i.e., is within the tolerance buffer), that build-ing is deemed compliant. If less than 90% of the feature outline is outside the tolerance buffer, the building is non-compliant with the positional tolerance for that scale.
4. Results and discussion
4.1. Feature extraction
The best extraction result for the building class was obtained using 24 training areas and after two quick iterations of removing clutter. The following parameters were used for the extraction: ‘Manhattan 5’ for the input representation pattern, masking out vegetation and white roofs, and aggregation of 100 pixels. The extraction phase returned 317 ‘raw’ building blocks with red tile roofs, compared to the 330 mapped in the reference data set. This difference does not necessarily imply an under-extraction of fea-tures, since each extracted building may correspond to more than one in the reference map. The overall detection and distribution of buildings in these data sets can be compared inFig. 3.
The extracted building blocks have areas varying from 9.4 to 2359 m2, and a mean area of 163.4 m2. The size of the smallest fea-ture detected is mostly related to the level of aggregation selected. The standard deviation of 201.8 m2gives an indication of the
erogeneity of building sizes, further confirmed by the reference map. Table 3 shows for each data set of buildings the number and area of features in the study area.
The generalization step decreased the overall number of fea-tures to 316, by merging two irregular polygons which were very close. Also, by squaring up features, this procedure has generally
lowered their size, which decreased 8.5 m2 on average to 154.9 m2, while their actual mean size (Reference) appears to be larger (181.9 m2). Still, the generalization has significantly im-proved the overall geometric quality of features, as illustrated in
Fig. 4. Most buildings are rectangular, and the fully automated gen-eralization step approximates the shape of extracted features to those in the reference.
The feature extraction stage was complicated due to the com-plexity of the study area and the heterogeneity of the buildings present, which also exists within the specific class of interest (building blocks with red tile roofs) (seeFreire et al., 2010b). Devel-opment of the study area occurred over many decades, and build-ings of the same type present a wide range of age and condition that result in spectral variations. Also, this spatial resolution cap-tures struccap-tures protruding above the building’s roof plane such as chimneys and elevator shafts, whose shadows create artifacts during feature extraction.
Since the best extraction parameters depend on study area and object characteristics, and type of imagery or source data used, these will have to be experimented by trial and error or at least fine-tuned when one of these variables changes. VHR satellite imagery are usually acquired with an off-nadir look angle which causes displacement of the roofs of taller buildings and misalign-ment with their footprint. This problem can be mitigated, as in this case, by the use of planimetric correct data such as LiDAR.
Although individual buildings were used as training samples, FA has revealed to be unable to return adjacent buildings as separate features, even when a narrow but obvious separation (e.g., an edge one or two pixels wide) can be visually identified in the image. Therefore this problem appears to be due less to insufficient spatial resolution of imagery and more to remaining limitations of GEOBIA methods. For this reason, quality assessment had to be conducted at the level of building block, these being equal to the building in the case of individual features. GEOBIA applications are yet unable to return most contiguous buildings of similar type as individual features without the use of ancillary data, such as limits of cadas-tral parcels.
4.2. Quality assessment
The overall thematic accuracy of building extraction was 72.2% for both 1:1000/1:5000 and 1:10,000 map scales. This accuracy va-lue is considered rather high in view of the ambitious and strict understanding of correctness implied by the metric, and is in line with some results of recent similar efforts (e.g.,Vu et al., 2009). Assessing thematic accuracy based on the layer’s area obviates the need to arbitrarily define a threshold for an object to be consid-ered a True Positive (TP), necessary in other object-based assess-ment methods.
Regarding level of completeness, Omission error was higher than Commission and was higher still for scale 1:10,000 (Table 4), because a higher percentage of reference buildings larger than 20 m2 were missed by the extraction (71 in 313). For scales 1:1000 and 1:5000, only 68 buildings in 330 were not correctly de-tected, according to the test. However, error of Commission was lower for scale 1:10,000, only 8% (22 polygons in 272 extracted), indicating that the smallest polygons were artifacts of the extrac-tion without correspondence in the reference. This assessment of completeness, by using a reciprocal point-polygon (PIP) test in-stead of a ‘one-way’ test, is more strict and demanding than other existing approaches (e.g.,Salah et al., 2009; Rutzinger et al., 2009). Concerning geometric quality, 245 pairs of buildings were com-pared at the larger scales and 223 were tested for the scale 1:10,000. These were all the feature pairs whose 1:1 correspon-dence could be verified. Results were not satisfactory for scales 1:000 and 1:5000 (Table 5). For the largest scale, no features Fig. 3.Extraction and reference data sets in study area.
Table 3
Number of building features and their area in each data set.
Data set No. of features Area (m2)
Min Max Mean Std.
Extraction 317 9.4 2359.1 163.4 201.8
Generalized 316 5.1 2370.5 154.9 202.5
attained the 90% compliance value, while it was attained by only 26% of buildings at scale 1:5000, with a mean value of compliance of 78%. At scale 1:10,000 89% of features are compliant, with a mean compliance value of 96%. These results are in line with those
obtained byGianinetto (2008), indicating that mapping standards can be met for scale 1:10,000. Although this test was applied to all pairs of features, this method can also be applied to a statisti-cally sound sample of features.
Fig. 5illustrates the distribution of building compliance in the study area for the two smaller scales. Such a reliability map, when available, can be used to guide manual editing of features to correct errors (Benz et al., 2004).
Analysis of correlation has shown that compliance is not line-arly correlated to feature size or their shape index. However, grouping features by classes of area and plotting their respective accuracy has revealed a slightly parabolic-type curve where com-pliance is highest for medium-sized features, and lowest for those smallest and largest (Fig. 6). This indicates that there might be a ‘preferred’ building size for correct extraction and/or that the smallest and largest buildings display features that complicate their accurate extraction.
Planimetric tolerance is a mapping constraint devised for point-based testing that is usually applied by sampling a few points, fail-ing to comprehensively evaluate the quality of the whole feature selected for assessment. The fact that buildings are complex fea-tures having varying sizes and geometries further complicates this testing. The presented approach demonstrates how this constraint can be successfully adapted to assess the geometric quality of the whole building, regardless of its size and shape. This allows explicit incorporation of quantitative mapping standards in the quality Fig. 4.Detail of red tile roofs in study area and their extraction and generalization.
Table 4
Results of assessment of completeness.
Scales Omission Commission
No. % No. %
1:1 000; 1:5 000 68 20.7 45 14.2
1:10,000 71 22.7 22 8
Table 5
Compliance values (%) for building features for the 90% planimetric tolerance, by scale.
Scales
1:1000 1:5000 1:10,000
Min 0 19.3 54.9
Max 78.2 100 100
Mean 20.2 78.1 96.1
Std. 12.7 16.1 8.8
No. of features 0 63 198
% of features 0 26 89
assessment of buildings automatically extracted from VHR satellite imagery. This method is innovative because it is vector-based, objective, and provides quantitative results, while considering scale-dependent mapping constraints. Furthermore, it can be eas-ily automated and applied to the assessment of buildings extracted from any type of VHR imagery. Instead of a comprehensive analysis for an area, as conducted in this case, assessment can also be con-ducted for a representative sample of features. For these reasons it is believed that this analysis of geometric quality is the most ro-bust and comprehensive test, enabling the generation of quality indices for individual buildings.
Since the nature of landscape objects is different, assessing the quality of extracted natural elements (e.g., trees) and linear fea-tures (i.e., roads) may involve conceptually different approaches.
5. Conclusions
GEOBIA approaches applied to current and future VHR satellite imagery may expedite the acquisition and updating of spatial information, an increasing requirement in the municipal context. To assess if this goal is feasible and in which conditions, it is fun-damental to develop and implement quality assessment methods which are rigorous, objective, and that take in consideration the technical constraints of the large mapping scales traditionally used at the local level. Such a method could also contribute to increase the confidence and guide the use of spatial data sets obtained through this process. The present work represents an innovative approach to assess the quality of buildings extracted from VHR sa-tellite imagery using semi-automated methods through analysis of similarity with a reference database, taking place in the context of large scale mapping to assist urban planning in Portugal. A new ap-proach was developed and demonstrated to adopt technical map-ping standards in an object-based evaluation of different spatial quality elements. Automatic feature extraction software was employed to map buildings present in a pansharpened QuickBird image of Lisbon. The approach evaluates different aspects that determine overall quality of a single feature class map, namely the-matic quality, completeness, and geometric quality. These dimen-sions were evaluated using consecutive object-based tests and quantitative quality metrics were produced. Quality assessment was exhaustive (i.e., by census) and involved comparisons of ex-tracted features against a reference data set, introducing carto-graphic constraints from large scales used at municipal level, namely 1:1000, 1:5000, and 1:10,000. Although the approach was illustrated for buildings with red tile roofs, it could be applied to different building types and even to other polygon-based geo-graphic features present in topogeo-graphic maps that could be subject to automatic feature extraction from remotely-sensed imagery.
Overall thematic accuracy was reasonable and invariant with introduction of area constraint for mapping scales. On the contrary, values for completeness varied with mapping scales and results were slightly better for scale 1:10,000. However, testing spatially for completeness based on objects is a complex issue that needs improvement. The assessment of geometric quality and integrity revealed that strict topographic standards of planimetric deviation were only met at scale 1:10,000, for a large percentage of extracted features. However, in order to produce an effective quality assess-ment tool, it would be important to integrate the different quality dimensions under one single metric that could be computed for each type of object. Quality assessment of features extracted from VHR imagery appears to be evolving from a generic and inadequate confusion-matrix approach to a process specific for each feature type and realm of application. So far there is abundant research and suggested approaches for measuring accuracy of extracted buildings, but much less on assessing linear-type features (repre-sented as polygon) such as roads, or on natural features such as trees, whose automated extraction are increasingly allowed by high-resolution VHR imagery and LiDAR data.
In order to be able to use automatic feature extraction in an operational mapping process, GEOBIA methods should be further developed to approximate the result of human visual analysis. Also, objective quality assessment methods compatible with those used for mapping should be implemented, so that final users rely on automatically-extracted data sets as they have learned to rely on traditional mapping products. Quality assessment of large-scale mapping using VHR imagery would benefit from considering addi-tional cartographic standards (e.g., completeness) in the evaluation process. Future developments of the present work should evolve into assessing the quality of extracted features from true ortho-images against existing topographic maps having compatible scale. The relevance of the study area and its heterogeneity for the fea-ture extraction process is the subject of parallel on-going research.
Acknowledgements
This work was performed in the framework of project GeoSat – Methodologies to extract large scale GEOgraphical information from very high resolution SATellite images, funded by the Portu-guese Foundation for Science and Technology (PTDC/GEO/64826/ 2006). The authors would like to thank LOGICA for providing the LiDAR data set.
References
Awrangjeb, M., Ravanbakhsh, M., Fraser, C., 2010. Automatic detection of residential buildings using LIDAR data and multispectral imagery. ISPRS J. Photogramm. Remote Sens. 65 (5), 457–467.
Benz, U.C., Hofmann, P., Willhauck, G., Lingenfelder, I., Heynen, M., 2004. Multiresolution, object-oriented fuzzy analysis of remote sensing data for GIS-ready information. ISPRS J. Photogramm. Remote Sens. 58 (3–4), 239–258.
Blaschke, T., 2010. Object based image analysis for remote sensing. ISPRS J. Photogramm. Remote Sens. 65 (1), 2–16.
Congalton, R.G., Green, K., 2009. Assessing the Accuracy of Remotely Sensed Data: Principles and Practices, second ed. CRC/Lewis Press, Boca Raton, FL, USA.
Dungan, J.L., 2006. Focusing on feature-based differences in map comparison. J. Geogr. Syst. 8 (2), 131–143.
Freire, S., Santos, T., Navarro, A., Soares, F., Dinis, J., Afonso, N., Fonseca, A., Tenedório, J.A., 2010a. Extraction of buildings from QuickBird imagery for municipal planning purposes: quality assessment considering existing mapping standards. In: Proc. GEOBIA2010, Ghent, 29 June–July 2, 2010. 6p (on CD-ROM). Freire, S., Santos, T., Gomes, N., Fonseca, A., Tenedório, J.A., 2010b. Extraction of buildings from QuickBird imagery for municipal use – the relevance of urban context and heterogeneity. In: Proc. 30th EARSeL Symposium ‘‘Remote Sensing for Science, Education, and Natural and Cultural Heritage’’, Paris, 31 May–June 3. 8p (on CD-ROM).
Gianinetto, M., 2008. Updating large scale topographic databases in Italian urban areas with submeter QuickBird images. Int. J. Navigation Observ., 9. Article ID 725429.
Hay, G.J., Castilla, G., 2008. Geographic Object-Based Image Analysis (GEOBIA): A new name for a new discipline. In: Blaschke, T., Lang, S., Hay, G.J. (Eds.), Object-Based Image Analysis. Springer-Verlag., pp. 75–89.
Herold, M., Gardner, M., Roberts, D., 2003. Spectral resolution requirements for mapping urban areas. IEEE Trans. Geosci. Remote Sens. 41 (9), 1907–1919.
Holland, D., Marshall, P., 2004. Updating maps in a well-mapped country using high resolution satellite imagery. Int. Arch. Photogramm., Remote Sens. Spatial Inform. Sci. 35 (Part B2), 747–751.
Holland, D.A., Boyd, D.S., Marshall, P., 2006. Updating topographic mapping in Great Britain using imagery from high-resolution satellite sensors. ISPRS J. Photogramm. Remote Sens. 60 (3), 212–223.
Instituto Geográfico Português (IGP), 2005. Cartografia e ortofotocartografia à escala 1:10,000. Normas técnicas de produção e reprodução, Instituto Geográfico Português, Lisboa.
Jensen, J.R., Cowen, D.C., 1999. Remote sensing of urban/suburban infrastructure and socio-economic attributes. Photogramm. Eng. Remote Sens. 65 (5), 611– 622.
Khoshelham, K., Nardinocchi, C., Frontoni, E., Mancini, A., Zingaretti, P., 2009. Performance evaluation of automated approaches to building detection in multi-source aerial data. ISPRS J. Photogramm. Remote Sens. 65 (1), 123–133. Lang, S., 2008. Object-based image analysis for remote sensing applications:
modelling reality – dealing with complexity. In: Blaschke, T., Lang, S., Hay, G.J. (Eds.), Object-Based Image Analysis, Springer-Verlag, pp. 3–27.
Opitz, D., Blundell, S., 2008. Object recognition and image segmentation: the Feature Analyst approach. In: Blaschke, T., Lang, S., Hay, G.J. (Eds.), Object-Based Image Analysis, Springer-Verlag, pp. 153–167.
Podolskaya, E.S., Anders, K.-H., Haunert, J.-H., Sester, M., 2007. Quality assessment for polygon generalization. In: Proc. of the 5th International Symposium on Spatial Data Quality (SDQ 2007), vol. 34, Part XXX.
Rutzinger, M., Rottensteiner, F., Pfeifer, N., 2009. A comparison of evaluation techniques for building extraction from airborne laser scanning. IEEE J. Select. Top. Appl. Earth Observ. Remote Sens. 2 (1), 11–20.
Salah, M., Trinder, J., Shaker, A., 2009. Evaluation of the self-organizing map classifier for building detection from LiDAR data and multispectral aerial images. J. Spatial Sci. 54 (2), 1–17.
Samal, A., Seth, S., Cueto, K., 2004. A feature-based approach to conflation of geospatial sources. Int. J. Geogr. Inform. Sci. 18 (5), 459–489.
Santos, T., 2011. Producing geographical information for land planning using VHR data. Local Scale Applications. LAP LAMBERT Academic Publishing GmbH & Co., KG, Saarbrücken, Deutschland.
Santos, T., Freire, S., Boavida-Portugal, I., Fonseca, A., Tenedório, J.A., 2009. Accuracy assessment of features extracted from QuickBird imagery for urban management purposes. In: Proc. of the 33rd International Symposium on Remote Sensing of Environment, Stresa, Italy, 4–8 May, 4p (on CD-ROM). Santos, T., Freire, S., Navarro, A., Soares, F., Dinis, J., Afonso, N., Fonseca, A.,
Tenedório, J.A., 2010. Extracting buildings in the city of Lisbon using QuickBird images and LIDAR data. In: Proc. GEOBIA2010, Ghent, 29 June–July 2, 2010, 5p (on CD-ROM).
Shan, J., Lee, S.D., 2005. Quality of building extraction from IKONOS imagery. J. Surv. Eng. 31 (1), 27–32.
Van Coillie, F., Pires, R., Van Camp, N., Gautama, S., 2008. Quantitative segmentation evaluation for large scale mapping purposes. In: Blaschke, T., Lang, S., Hay, G.J. (Eds.), Object-based image analysis – spatial concepts for knowledge-driven remote sensing applications. Springer-Verlag, pp. 237–256.
Visual Learning Systems (VLS), 2008. Feature Analyst version 4.2 for ArcGIS Reference Manual. Missoula, MT: VLS.
Vu, T.T., Matsuoka, M., Yamazaki, F., 2009. Multi-scale solution for building extraction from LiDAR and image data. Int. J. Appl. Earth Obs. Geoinf. 11 (4), 281–289.