Automatic Building Damage Detection Method Using High-Resolution Remote
Sensing Images and 3D GIS Model
Jihui Tu a,b , Haigang Sui a,*, Wenqing Feng a,Zhina Songa a
State Key Laboratory of Information Engineering in Surveying, Mapping and Remote Sensing, Wuhan University, 430079 Wuhan, China- [email protected]
b
Electronics & Information School of Yangtze University, Jingzhou , Hubei 434023,[email protected]
Commission Ⅷ,WG Ⅷ/1
KEYWORDS: Building Damage Detection, 3D Change Detection, 3D registration, 3D GIS Model, Level set
Abstract:
In this paper, a novel approach of building damaged detection is proposed using high resolution remote sensing images and 3D GIS-Model data. Traditional building damage detection method considers to detect damaged building due to earthquake, but little attention has been paid to analyze various building damaged types(e.g., trivial damaged, severely damaged and totally collapsed.) Therefore, we want to detect the different building damaged type using 2D and 3D feature of scenes because the real world we live in is a 3D space. The proposed method generalizes that the image geometric correction method firstly corrects the post-disasters remote sensing image using the 3D GIS model or RPC parameters, then detects the different building damaged types using the change of the height and area between the pre- and post-disasters and the texture feature of post-disasters. The results, evaluated on a selected study site of the Beichuan earthquake ruins, Sichuan, show that this method is feasible and effective in building damage detection. It has also shown that the proposed method is easily applicable and well suited for rapid damage assessment after natural disasters.
1. Introduction
Earthquake-induced building damage or collapse is an extremely grave threat to human life and property, particularly in high-density urban area. After an earthquake, rapid damage assessment is vital for emergency response actions, rescue work and post-disaster reconstruction. In recent decades, various kinds of remote sensing data, such as aerial or satellite images, Lidar and SAR, have been widely used to identify, detect and assess for natural disasters[1][2]. Therefore, the accuracy classification of individual building damaged types using the remote sensing images has become a critical issue.
Many approaches for detection and estimation earthquake-building damage have been proposed. These approaches can be categorized into four types: (1) The visual interpretation method[3][4][5] is employed to detect and assess the building damage using various remote sensing images and GIS data, but
*Corresponding author
However, little attention has been paid to analyze the different building damaged types, especially the trivial damaged building. 3D GIS model data provides the accurate geographic coordinates and height information for the pre-disasters building. But 3D GIS model data do not provide good texture information and is not easy to be got in time after natural disasters, meanwhile post-disasters remote sensing images are easy to get and have rich texture information, which makes up the shortage of 3D GIS. Based on these, Hence, the purpose of this paper is to present an approach to detect the different building damaged types using pre-disaster 3D GIS model and post-disaster remote sensing images. The approach was implemented on a selected study site of the Beichuan earthquake ruins, one of these area most strongly hit by the 2008 Beichuan, Wenchuan earthquake, the experimental results are showed the superiority of the
proposed approach to the other existing ones.
The rest of this paper is organized as follows. Section 2 describes the proposed method. Section 3 analyses and compares the experimental results, followed by the conclusion in Section 4.
2.Methodology
Fig.1 shows the overall workflow of the study. In the figure, there are three main parts. The first part is the pre-processing, including the extraction of the building vector from the 3D GIS model, the geometric correction for high resolution remote sensing image. The second part is the building-height estimation using the shadow detection. The third part is to detect the different building damaged types by utilizing the changes detection of the building area, the height between the pre- and post-disaster, and the building rooftops texture information.
Images after correction
Building Vector Extract the building Vector
Geometric correction High-Resolution Remote
Sensing Images 3D GIS model
Extract the texture feature Extract the Area
feature Pre-disaster Data
Height Area
Extract the Height feature
No damage Trivial damage
Severely damaged Totally collapsed
Building segmentation based on the vector guiding
Building damaged detection
Fig.1. Framework of the proposed method
2.1 Data Preprocessing
This step obtains the building vector information and the georeferenced remote sensing images, then the building vector information is used to extract the building from the georeferenced remote sensing images. The required processing for the building vector information and the georeferenced remote sensing images is described below.
First, 3D GIS model provide us with comprehensive information, such as 3D model, 3D GIS, object vector
information, thematic information, etc. Therefore, the building vector information is extracted from the 3D GIS model, which can be simply carried out by any GIS package such as ArcGIS.
coordinate. In this paper, we use the method of polynomial correction to correct the remote sensing image with the PRC parameter. After the geometric correction, the vector-to-image registration is using the georeference information.
2.2 The building-height estimation
Height feature is the important feature of the building, but post-disaster remote sensing images have only rich texture rather than height feature. In order to obtain the post-disaster building-height, this paper use shadow to estimate the building-height for the following change detection.
3D GIS model in the pre-disaster include the building vector information and the building height information. We use these information to number for the building object and construct a set of the building objects in the pre-disaster. Set the building object be
VB={v1,v2,v3,…,vm}, where Vi is a building object in the set, i=1,2,3,… m, m is the total of the building object. In the following, the building vectors are superimposed on the post-disaster remote sensing image, which builds the buffer of the building in the image. Within the buffer area, we further extract the building using level set segmentation algorithm. There are the detail descriptions in the following step.
1) After the building vectors are superimposed on the image, the building buffer area is created. And then it is applied to gray-scale transformation and binarization in the buffer area.
2) To segment the building using level set method[15]. 3) In order to obtain the building height, the proposed method includes two steps: shadow segmentation and extraction, building-height estimation. With increased
spatial resolution, shadows from buildings or trees become an apparent class that may not be ignored. It is closely related to building shape, sun solar, altitude angles, the sun azimuth angle, the luminous intensity, and so on. On flat area, when the building height is constant, the shadow length L is mainly related to solar altitude angles а and building height H , have the following relation:
tan
L
H
c
(1)2.3The building rooftops damaged detection based
on Visual BoW model
Building rooftop damaged detection is a key work for the whole building damaged detection. Gap is a marked characteristic of the building rooftops damage. Only when we calculated the gap area size can it determine that whether the building rooftop is damaged. However, these gaps are uneven distribution as the form of a block of pixels on the rooftop, hence it is a difficult job to detect the building rooftops damage area with the pixel-level detection algorithm, which has a semantic gap. This paper proposes a building rooftop damaged detection method based on Visual BoW(Bag of Words). The key idea of the method is to firstly divide the building rooftop into lots of different regions using superpixel segmentation algorithm, which overcomes the semantic gap problem. Then BOW model is employed to distinguish the damage area and the non-damaged area in the superpixel segmentation. Through calculating the sum of the damage area, we can determine that whether the building rooftop damage. Fig.2 shows the detection workflow, described in more detail below:
Color feature
HOG feature
Feature extraction
……… ………
Train sample of building rooftop
Visual bag-of -word model
Feature clustering
Visual Dictionary ……… ………
Histogram of
Visual dictionary SVM Classification
Detection building rooftop Superpixel
SVM Training
Superpixel
Detection Result
Fig.2 Flowchart of the proposed method for detecting rooftops damaged areas. (1) Image segmentation.
In the proposed method, rooftop is segmented by utilizing the simple linear iterative clustering(SLIC)
superpixels. SLICO may adaptively choose the compactness parameter for each superpixel, the only parameter is the number of superpixels to output. The cluster feature of the SLIC algorithm in this study utilizes the color similarity and image plane space information.
(2) BOW representation of superpixel region features.
The first step is to extract the feature descriptors in each superpixel region. In the proposed approach, color and HOG is extracted for each superpixel as the feature descriptor. The damaged areas intensity of the building rooftops is darker than that of the undamaged areas, HSV color space provide better intuition for humans than RGB color space, and it is more sensitive to the brightness, which is more advantage to distinguish the color feature. Hence the HSV space is nonuniformly quantized by using H, S and V in the superpixel areas, this includes 7 levels in H, 3 levels in S, and 3 levels in V, then the three color components are combined into one one-dimensional vector: L = 9H +3S+V(L∈[0,71]); Because there are some different shape in the superpixel areas, a rectangular area is determined according to the length of the major axis and centroid of the super-pixel area, which computes HOG feature. Experimental statistics show that the major axis length is 30 pixels, so we choice 30×30
rectangular area to compute HOG feature, HOG’s cell
is 6×6,gradient direction is 9 orientation bins, which generate 225 HOG features.
The second step is to generate a codebook for the BoW model. Let F=[f1, f2, f3,…, fN] be feature descriptors extracted in each superpixel region as calculated above, where each fi is M dimensional vectors and N is the
number of feature points in each superpixel region. We cluster the feature descriptors F with k-means algorithm, the number of k-means clusters is the size of our codebook. For the convenience of the following development, we denote a generated codebook by W = [w1,w2,w3,…,wk]∈RD×K
, where K is the size of the codebook.
The third step is to represent the damage and non-damage region respectively using the codebook. In BOW model, image is represented by different
frequencies codebooks. Therefore, the histogram of the damage and non-damage region can be obtained. Let N
= [n1, n2,n3, ..ni ,…,nK] be a histogram statistical vector. Due to the different effect on the image representation in the different visual words, it will cause bad effect if using the histogram vector directly for recognition. Hence we employ the weight scheme of [17] and normalize with the L2 norm[18] to generate a different weight histogram vector. Support the weight vector is represented by a K-vector T = [t1,t2,t3, …,ti,…,tK].The weight ti can be computed as
log id i
d i
n N
t
n n
(2)
where nid is the number of occurrences of word i in the
superpixel region, nd is the total number of words in
the superpixel region, ni is the number of occurrences
of term i in the whole database and N is the number of documents in the whole database.
(3) Classification by SVM.
Based on the features, an SVM classifier is trained to process the samples that were manually collected as damage and non-damage region. Given a set of labeled training samples, SVMs can learn a linear decision boundary to discriminate between the two classes. For a test image, image segmentation by SLICO, extraction of the color and HOG descriptors for each object, and classification by SVMs are consequently performed. The result is a linear classification rule that can be used to classify new test examples.
2.1 Accessing the building damage type
The characteristics of a damaged building are strongly dependent on many factors, such height change, area change and texture feature. So only using a certain characteristics to determine the damage building is not accurate. This paper extracts the height, the area and texture characteristics of building to determine the building damage. The detail processing are as follows. (1) Set building height of pre-disaster was HiBefore,
building height of post-disaster was HiAfter, height
difference was ∆Hi=HiBefore - HiAfter. When the
height ∆Hi is less than the given minimum
threshold Min∆Hi, the membership degree
threshold Min∆Hi, the membership degree
Ri∆H(Height) of building damage is 1;When
Min H H Max H , the membership
degree of building damage is
i i H
H - Min H
R (Height) =
Max H - Min H
.
(2) Set building area of pre-disaster was SiBefore,
building area of post-disaster was SiAfter, area
difference was ∆Si= SiBefore - SiAfter. When the area
∆Si is less than the given minimum threshold
Min∆Si, the membership degree Ri∆S(Area) of
building damage is 0;When the area ∆Si is greater
than the given maximum threshold Min∆Si, the
membership degree Ri∆S(Area)of building damage is 1;When Min∆Si< ∆Si < Max∆Si, the
membership degree of building damage
is i
i S
S Min S
R (Area) =
Max S Min S
.
(3) The texture feature is to detect the damaged area size of rooftop using Visual BoW model. When the size of the rooftop damaged area is greater than or equal to the given maximum threshold
MaxFeatureAreai, the membership degree
Rifeature(Area) of the building damage is 1; when
the damaged area size is less than or equal to the minimum threshold
MinFeatureArea
i , the membership degree Rifeature(Area) of the buildingdamage is 1; when MinFeatureAreai <
FeatureAreai< MaxFeatureAreai, the membership
of building damage is
i ifeature
MaxFeatureArea - FeatureArea
R (Area)=
MaxFeatureArea - MinFeatureArea
.
According to the principles of evidence theory, this paper will give evidence to the various features of buildings damaged confidence in the probability
distribution by the way of statistical experts, on the basis of evidence we build the theory model to assess whether buildings damaged or not through using various confidence coefficient. Building damaged confidence formula is as follows:
1 •
n j j j Judge
R P
n
(3)Where Rjis the membership degree of the evidence j, ρj
is the prediction setting confidence degree of the evidence j. n is the total number of evidence. Finally calculate the building damage of confidence PJudge.
3.Experiment and Result
3.1 Experiments overall description
In order to evaluate the effectiveness of the proposed method in this paper, author has investigated and measured on the Beichuan earthquake ruins in April, 2014. The data collection described as follows: the foundation geography information data of the building in the pre-disaster, the high resolution remote sensing image in the post-disaster, the ground image of the building and the building height in the post-disaster. In this experimental part, the 3D GIS model of the
Beichuan is simulated by using the GIS tool “ArcGIS”
according to the foundation geography information data in the pre-disaster(shown in Fig.3(a)). The ground image of the building is verified the accuracy of the proposed method in this paper. Building vector information(shown in Fig.4(a)) are extracted from 3D GIS Model of pre-disaster. The post-disaster remote sensing image is corrected to obtain the georeferenced coordinate system by using RPC parameter.
(a) (b) (a) (b)
3.2 The result of building-height estimate
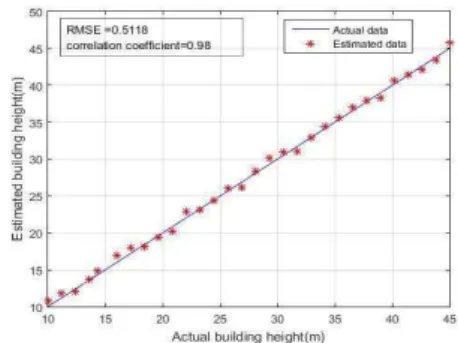
Building vector is overlaid with the remote sensing image to obtain the building’s buffer area, then we obtain the building boundaries by using the level set method of section 2.1(2) in the buffer area. In the building boundaries we estimate the building height using the shadow feature. To assess the accuracy of building-height estimation, actual building heights were obtained by the laser range finder. Building heights were obtained for a total of 30 randomly selected buildings from the Beichuan earthquake ruins. The actual heights for these 30 buildings were in the range of 15 to 40 m, which is considered to be representative in the Beichuan earthquake ruins. The actual building heights and the automatic detected values are plotted in Fig.5. The correlation coefficient was 0.98. The root-mean-square error (RMSE) was 0.51 m.
Fig.5. Accuracy evaluation of the building-height.
3.3 The result of rooftop damaged area detection
In this experiment, 50 building rooftops are segmented by utilizing the SLIC algorithm, then we manually classify the damaged/non-damaged areas as training samples, there are 8921 damaged areas and 4367 non-damaged areas, respectively. Because the key step for the Visual BoW model is feature descriptors, which determined the quality of the detection result, different local feature descriptors (Surf and Gabor) will be compared with the proposed method in the Visual BoW model. Fig.6 shows some example of the testing rooftops damaged areas detection from datum. The results show that the proposed method is better than the other two methods from the visual effect, which obtains the satisfactory results of the detection.
(a) (b) (c) (d) (e) Fig.6 Some examples of result images by different methods in Table I: (a) Original rooftops (b) Superepixels (c) result images by Surf+VBOW+SVM (d) result images by Gabor+VBOW+SVM (e) result images by the proposed method(Color+HOG+VBOW+SVM)
In this experiment, we also utilize two indices to describe the performance of the proposed method, which are precision and recall, compared with Surf and Gabor descriptor. As shown in Table 1, there are 50 testing rooftops average values of precision and recall in the variant combination of modules, the results show that the method produces better precision and recall.
Methods Precision Recall
BoW-Surf 0.73 0.71
BoW-Gabor 0.81 0.79
BoW-HoG+Color 0.90 0.88
Table 1 Average performance of variant combination of modules
From the results in Table 2, we see that the
proposed approach achieves a high producer’s
accuracy, Kappa coefficient and overall accuracy for detecting totally collapsed, severely damaged, trivial damaged and non-damaged buildings. In order to verificate the method accuracy, we use the ground images that are obtained on the Beichuan earthquake ruins in April, 2014. The part building damage can’t be detected using the method proposed by this paper, mainly because this paper determines the building damage by using the building height, area and rooftop
texture, but many building’s wall happened to broke or collapse. Therefore, this paper’s method can’t judge
these kinds of building damage.
For validation, the performance of the proposed approach is evaluated through comparison with the approach presented by reference[7]. The approach
presented by reference[7] detects building damage by calculating the area of overlap between the theoretical ground shadow area and the actual ground shadow area. In this paper, we use the presented approach by Tong et al(2013) to detect the building damage. From the experimental result of this approach (shown Table 2), we found that the overall accuracy and overall kappa for reference[7] method are only 58.75% and 40.69%, respectively. The reason for this result is that this approach determines the building damage by using the building shadow, namely, the building height, but
many building’s rooftops or facade happened to broke
or collapse, but reference[7] method think this damaged building as non-damaged building. Therefore, the overall accuracy and overall kappa of this method is much lower than the proposed method in this paper.
Reference
Totally collapsed Severely Damaged Trivial Damaged Non-Damaged Total
Totally collapsed 26(24) 4(6) 0 0 30(30)
Severely Damaged 2(5) 67(60) 3(0) 0(0) 72(65)
Trivial Damaged 0(0) 0(16) 47(0) 2(16) 49(32)
Non-Damaged 0(0) 0(0) 3(23) 6(10) 9(33)
Total 28(29) 71(82) 53(23) 8(26) 160
Producer’s accuracy 0.9286(0.8276) 0.9437(0.7317) 0.8868(0) 0.7500(0.3846) User’s accuracy 0.8667(0.8) 0.9306(0.9231) 0.9592(0) 0.6667(0.3030) Average accuracy
(producer’s)
0.8773(0.4860)
Average accuracy(User’s)
0.8558(0.5056)
Overall accuracy 0.9125(0.5875)
Overall Kappa 0.8681(0.4069)
Table 2 Result of the confusion matrix for the detection of building damage using the proposed approach and reference[7]
4. Conclusions
This paper has presented a novel building damage detection method from high resolution remote sensing imagery and 3D GIS model. Towards that end, we have proposed and tested techniques for image rectification, building vector and feature extraction, change detection and damage detection. This new one fully combines the 2D and 3D information of the real world to detect the building damage. The results, evaluated on real data, demonstrate that this method is
feasible and effective in building damage detection. In the future we intend to use multiply view oblique aerial imagery and public-source imagery on the ground to detection the building damage, which is better to assess the level of the building damage.
Acknowledgement
In this paper, this work was supported by National Key Fundamental Research Plan of China (973) (No.2012CB719906),Major projects of high resolution
03-Y20A10-9001-15/16), National High Technology R esearch and Development Programme of China (863 Pr ogramme) [Project NO. 2013AA122301]
REFERENCES
[1] L. Dong and J. Shan, “A comprehensive review of
earthquake-induced building damage detection with remote sensing techniques,” ISPRS J. Photogramm. Remote Sens., vol. 84, pp. 85–99, 2013.
[2] P. Gamba, F. D. Acqua, and G. Trianni, “Rapid damage detection in Bam area using multitemporal
SAR and exploiting ancillary data,” IEEE Trans.
Geosci. Remote Sens., vol. 45, no. 6, pp. 1582–1589, 2007.
[3] P. Gamba and F. Casciati,"GIS and image understanding for near-realtime earthquake damage assessment," Photogrammetric Engineering and Remote Sensing, vol.64 ,no.10, pp.987–994, 1998.
[4] B.J.Adams, B.Mansouri, and
C.K.Huyck,"Streamlining post-earthquake data collection and damage assessment for the 2003 Bam, Iran earthquake using visualizing impacts of earthquakes with satellites (VIEWS),"Earthquake Spectra,vol.21,no.S1, pp.213–218, 2005.
[5] L. P. Lei, L. Y. Liu, L. Zhang, J. T. Bi, and Y. H.
Wu, “Assessment and analysis of collapsing houses by aerial images in the Wenchuan earthquake,” J. Remote
Sens., vol. 14, no. 2, pp. 333–344, 2010.
[6] M.Turker and E.Sumer, "Building-based damage detection due to earthquake using the watershed segmentation of the post-aerial images," J. Remote Sens., vol.29,no.11, pp.3073–3089, 2008.
[7] X. H. Tong et al., “Use of shadows for detection of
earthquake induced collapsed buildings in high-resolution satellite imagery,” ISPRS J. Photogramm. Remote Sens., vol. 79, pp. 53–67, 2013. [8] A. Vetrivel, M. Gerke, N. Kerle and G. Vosselman,
“Identification of damage in buildings based on gaps in
3D point clouds from very high resolution oblique
airborne images,” ISPRS Journal of Photogrammetry
and Remote Sensing., vol. 105, pp. 61-78, 2015.
[9]M. Turker and B. Cetinkaya, “Automatic detection
of earthquake-damaged buildings using DEMs created from pre- and post-earthquake stereo aerial
photographs,” Int. J. Remote Sens., vol. 26, no. 4, pp.
823–832, 2005.
[10] X. H. Tong, Z. H. Hong, and S. J. Liu,
“Building-damage detection using pre- and
post-seismic high-resolution satellite stereo imagery: A
case study of May 2008 Wenchuan earthquake,”
ISPRS J. Photogramm. Remote Sens., vol. 68, no. 2, pp. 13–27, 2012.
[11] H. Sui, J. Tu, Z. Song and Q. Li, “A Novel 3D Building Damage Detection Method Using Multiple
Overlapping UAV Images,” ISPRS-International
Archives of the Photogrammetry, Remote Sensing and Spatial Information Sciences., vol. XL-7, pp. 173-179, 2014.
[12] M. Li, L. Cheng, and J. Gong, et al, "Post-earthquake assessment of building damage degree using LiDAR data and imagery," Science in China (Series E: Technological Sciences), vol.51, no.S2, pp.133-143, 2008.
[13] D. Brunner, G. Lemoine, L. Bruzzone, "Earthquake damage assessment of buildings using VHR optical and SAR imagery," IEEE Trans. Geosci. Remote Sens., vol.48, no.5, pp.2403-2420,2010. [14] M. Gerke and N. Kerle, “Automatic structural seismic damage assessment with airborne oblique
pictometry imagery,” Photogrammetric Engineering &
Remote Sensing., vol. 77, no. 9, pp. 885-898, 2011. [15] T.Chan and L.A.Vese, A level set algorithm for minimizing the Mumford-Shah functional in image processing. In IEEE Workshop on Variational and Level Set Methods, pp.161-168, Vancouver, CA, 2001. [16] R. Achanta et al., “SLIC superpixels compared to state-of-the-art superpixel methods,” IEEE Trans. Pattern Anal. Mach. Intell., vol. 34, no. 11, pp. 2274–2282, Nov. 2012.
[17] J. Sivic and A. Zisserman, “Video Google: A text
retrieval approach to object matching in videos,” in
Proc. IEEE Int. Conf. Comput. Vis., pp. 1470–1477. 2003.
![Table 2 Result of the confusion matrix for the detection of building damage using the proposed approach and reference[7]](https://thumb-eu.123doks.com/thumbv2/123dok_br/16375281.191426/7.892.113.819.513.861/table-result-confusion-detection-building-proposed-approach-reference.webp)
