www.nat-hazards-earth-syst-sci.net/12/785/2012/ doi:10.5194/nhess-12-785-2012
© Author(s) 2012. CC Attribution 3.0 License.
and Earth
System Sciences
A high resolution climatology of precipitation and deep convection
over the Mediterranean region from operational satellite microwave
data: development and application to the evaluation of model
uncertainties
C. Claud1, B. Alhammoud1, B. M. Funatsu1, C. Lebeaupin Brossier1,3, J.-P. Chaboureau2, K. B´eranger3, and P. Drobinski1
1Laboratoire de M´et´eorologie Dynamique/IPSL, CNRS, UMR8539, Ecole Polytechnique, Palaiseau, France 2Laboratoire d’A´erologie, University of Toulouse and CNRS, Toulouse, France
3Ecole Nationale Sup´erieure de Techniques Avanc´ees (ENSTA) – ParisTech, Unit´e de M´ecanique, Palaiseau, France
Correspondence to:C. Claud ([email protected])
Received: 5 December 2011 – Revised: 17 February 2012 – Accepted: 20 February 2012 – Published: 23 March 2012
Abstract. A new precipitation and convection dataset for the Mediterranean Basin, derived from operational satel-lite microwave data is documented. The dataset is derived from diagnostics that rely on brightness temperatures mea-sured since 1999 in the water vapour absorption line (183– 191 GHz). The dataset consists of twice-daily (a.m. and p.m.) and monthly maps of precipitation and convection occurrences on a 0.2◦lat×0.2◦ long grid for the area 25◦–
60◦N, 10◦W–50◦E. The instruments used so far are the
AMSU-B sensor on the NOAA-15 to -17 satellites, and the MHS sensor on the NOAA-18 and -19 and METOP-2 satel-lites, with precipitation and convection available separately for the different sensors. The slightly different radiometric characteristics of MHS compared to AMSU-B do not affect significantly the continuity of the dataset. Precipitation and convection data from different sensors on different satellites are remarkably consistent, with generally small biases be-tween the instruments. When larger biases appear, they can be explained either by the drifts in the satellite orbit, scan asymmetry, or temporal aliasing from insufficiently resolv-ing the diurnal cycle of precipitation and convection. Af-ter a description of climatological aspects of rain and deep convection occurrence, the interest of this dataset to evalu-ate model uncertainties for simulating a high-impact weather event and for climatic regional runs over this area is illus-trated.
1 Introduction
characteristics. Conventional instrumentation for measuring precipitation consists of networks of rain gauges and weather radar systems. Though measuring very accurately and con-tinuously precipitation, they are unevenly distributed, mostly concentrated over land masses: as an example, Frei and Sch¨ar (1998) developed a precipitation climatology over the Alps with a resolution of about 25 km and one day. Over the oceans, however, the few existing gauges are located on islands and they are therefore subject to local influences. Polar-orbiting satellites appear thus as an unrivalled means to overcome these deficiencies. Specifically, the satellite data provided by the Advanced Microwave Sounding Unit (AMSU) radiometer allow to detect moderate and heavy pre-cipitating areas (e.g. Kongoli et al., 2007; Vila et al., 2007; Surussawadee and Staelin, 2009; Di Tomaso et al., 2009; Laviola and Levizzani, 2011). This takes advantage of the fact that AMSU observations (a) are available on several plat-forms (five NOAA platplat-forms and Metop-2) and thus offer a good temporal sampling, (b) allow a screening of precipita-tion over the whole of the Mediterranean Basin, including the sea where in-situ observations are scarce, and (c) have a fine spatial resolution (16 km at nadir). The use of observa-tions from various platforms over a rather long period of time (here since 1999), however, rises a number of issues like the consistency between the radiometers and the possible drift in the satellite orbits. In our specific case, an additional issue is related to the fact that on recent platforms, the AMSU-B radiometer has been replaced by the Microwave Humid-ity Sounder (MHS), which slightly differs from its predeces-sor by the frequency of two channels (one being used in the present study) out of five. The agreement between the two ra-diometers for diagnosing precipitation and convection needs therefore to be assessed.
The present work is a contribution to the HyMeX (HY-drological cycle in the Mediterranean EXperiment) program, which aims at better understanding and quantifying the hy-drological cycle and related processes in the Mediterranean, with emphasis on high-impact weather events, inter-annual to decadal variability of the Mediterranean coupled sys-tem, and associated trends in the context of global change (Drobinski et al., 2010, 2011). Its goal is to better char-acterize the occurrence of precipitation and convection over the Mediterranean Basin over a long period of time. In Fu-natsu et al., 2009, results based on one satellite (NOAA-16) for the period 2001–2007 were discussed. In this paper, we extend the period to more than a decade and consider the observations of six satellites; besides, possible applications for evaluating meteorological and climate models, a key is-sue of the Medup program (“Forecast and projection in cli-mate scenario of Mediterranean intense events: Uncertainties and Propagation on environment”) that was a preparation of HyMeX, are presented.
The paper is organized as follows: Sect. 2 describes mi-crowave satellite observations, the diagnostics used to de-tect precipitation and convection, and the properties of the
dataset. After a general description of the climatology of rain and deep convection, the different issues raised by the con-struction of the dataset are addressed in Sect. 3. A possible use of this record for model uncertainties estimation is illus-trated in Sect. 4. Finally, in Sect. 5, the results of the study are summarized and discussed.
2 Satellite data and precipitation diagnostics
2.1 Data and pre-processing
AMSU is a cross-scanning microwave instrument flying on board NOAA and MetOp polar-orbiting satellites since late 1998 (see Table 1, which provides a summary of the plat-forms that carry the AMSU-B/MHS instruments). It con-sists of two modules: AMSU-A and AMSU-B (replaced by MHS, on recent platforms; Table 2). AMSU-A, with 12 of 15 channels in the molecular oxygen frequencies (50– 58 GHz) mainly designed for atmospheric temperature pro-files retrieval, is not used in this study. AMSU-B/MHS has two atmospheric window channels (at 89 and 150/157 GHz) and three channels centered in a water vapour absorption line (183–191 GHz). Though this sounder was designed for optimal moisture retrieval, a number of studies have shown its utility for rainfall detection (e.g. Laviola and Levizzani, 2009). The instrument has a swath width of approximately 2300 km, with 90 individual measurement pixels along the swath. Near-nadir instantaneous field of view of AMSU-B/MHS is of 16 km, while it is around 36 km for the largest viewing angles (Goodrum et al., 2000). Further details on the instruments can be found in the NOAA’s KLM User’s Guide available online at http://www2.ncdc.noaa.gov/docs/ klm/. Because of the different equatorial crossing times and in spite of the drift of some satellites (Fig. 1), this configu-ration offers a very good temporal sampling of any region in the world and therefore of the Mediterranean Basin. While two observations per day are available during the first months of 1999, there are on average six observations per day after mid-2002.
In this study, we used level1c AMSU-B/MHS brightness temperature (BT), which means that BT is pre-processed, calibrated, and navigated through the ATOVS (Advanced Tiros Operational Vertical Sounder) and AVHRR (Advanced Very High Resolution Radiometer) Pre-processing Pack-age (AAPP) software. Early NOAA-15 observations suffered from antenna interference problems during the period 1998– 1999 (Mo, 1999). This problem has been corrected subse-quently, however scan asymmetries with respect to the angle of view in NOAA-15 AMSU-B can be large (Buehler et al., 2005), and therefore the diagnostics for year 1999 are con-sidered as less reliable than those after 2000. In addition, following Funatsu et al. (2008), BT is re-sampled without smoothing to a regular horizontal grid of 0.2◦×0.2◦(about
Table 1. List of platforms carrying AMSU-B/MHS radiometers and major characteristics: launch dates, LTAN (Local Time Ascending Node) at the time of the launching of the satellite and status of AMSU-B/MHS channels.
Platform Radiometer Launch Date LTAN status
NOAA-15 AMSU-B 13 May 1998 19:20 Channels 3, 4, 5 failed Aug 2010 NOAA-16 AMSU-B 21 Sep 2000 14:24 Interference problems after 2007 NOAA-17 AMSU-B 24 Jun 2002 22:25 Channels 3, 4, 5 off since 13 Jan 2010 NOAA-18 MHS 20 May 2005 13:41
Metop-2 MHS 19/10/2006 21:30
NOAA-19 MHS 06/02/2009 13:43 Degraded signal for channels 3 and 4 between August and December 2009
Fig. 1.Equator crossing-times of the ascending nodes of the satellites that carry AMSU-B/MHS sounders. Note that Metop-2 is maintained in stable orbit.
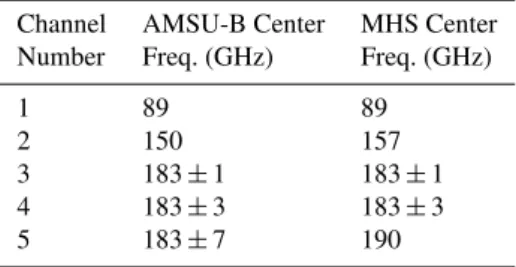
Table 2.Frequencies of AMSU-B and MHS channels.
Channel AMSU-B Center MHS Center Number Freq. (GHz) Freq. (GHz)
1 89 89
2 150 157
3 183±1 183±1
4 183±3 183±3
5 183±7 190
of the actual data point to the fixed grid point. Consecutive satellite passes covering the domain of 25◦–60◦N, 10◦W– 50◦E are concatenated in their descending and ascending motions providing, for each satellite, twice daily BT infor-mation.
2.2 Moderate rain and deep convection diagnostics
AMSU-B/MHS moisture channels (3 to 5) detect the pres-ence of hydrometeors through the scattering of radiation which lowers the brightness temperature compared to its sur-roundings (Greenwald and Christopher, 2002). Based on this property, Funatsu et al. (2007) showed that a combination of channels 3 and 5 of AMSU-B can detect precipitating ar-eas; a BT difference of channels 3 minus 5 (hereafter, B3m5)
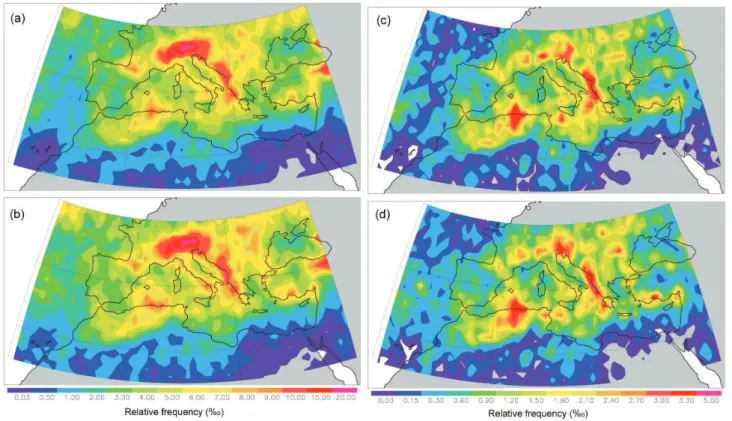
Fig. 2. Spatial distribution of relative frequency (in parts per thousand) of rain(a–b)and deep convection(c–d)at a 1◦×1◦grid for the period 2007–2009 from NOAA-17(a–c)and Metop-2(b–d).
of the same order of magnitude as the scattering signal by frozen hydrometeors (see e.g. Fig. 2 of Laviola and Leviz-zani, 2011). Over such areas, we use an additional constraint that a precipitating region must attain an upper-tropospheric humidity (UTH) relative to ice of at least 70 %. This UTH was calculated using AMSU-B/MHS channel 3 based on Buehler and John (2005). As shown by Funatsu et al. (2009), this restrains the false positive detection of precipitation, but this also results in a significant underestimation of precipitat-ing events especially durprecipitat-ing wintertime. Usprecipitat-ing the same set of coefficients for all satellites for calculating UTH may also be problematic. To try to cope with these issues, lately, tests were performed in order to use independent information on the presence of snow, based on the ERA-I reanalyses (Dee et al., 2011). Though some adjustments may still be necessary, results are promising. In the following, all the results are based on the UTH criterion, except Fig. 3, which makes use of ERA-I information. The reason for that is that we wish to compare this figure to the results of a numerical simulation in which no difference is made between the different types of surfaces (Sect. 4b).
2.3 Dataset properties
The climatology consists of precipitation and deep convec-tion occurrences in the domain 25–60◦N, 10◦W–50◦E at
a spatial resolution of 0.2◦latitude×0.2◦ longitude. It is
pm
am
JAN FEB MAR APR MAY JUN JUL AUG SEP OCT NOV DEC
JAN FEB MAR APR MAY JUN JUL AUG SEP OCT NOV DEC pm
am
(a)
(b)
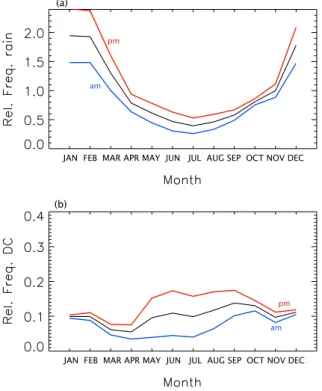
Fig. 3. Daily (in black), a.m. (=descending, in blue) and p.m. (=ascending, in red) seasonal cycle of(a)rain and(b)DC relative frequency based on NOAA-17 observations, 2003–2008. Values are averaged over the whole basin.
3 Results
3.1 Rain and DC climatology
Figure 2 provides rain and DC climatologies obtained over the period January 2007–December 2009 based on NOAA-17 (Fig. 2a–c) and Metop-2 (Fig. 2b–d) satellites at a spa-tial resolution of 1◦×1◦, respectively. This period has been chosen because (a) the two satellites have a close equatorial crossing time, and (b) it is representative of a longer period (see e.g. Fig. 9a, valid for January 2003– December 2008). Each value corresponds to an average number of rain occurrences, considering the 25 gridpoints (from the original 0.25◦×025◦) centered around a full
de-gree latitude/longitude 1◦×1◦ gridpoint. For example, the
relative occurrence of rain at (35◦N, 35◦E) is the sum of
rain occurrences in the window (34.5◦N–35.5◦N, 34.5◦E–
35.5◦E) divided by 75 (total number of gridpoints times
three, because we averaged over 3 yr). First of all, the maps displayed Fig. 2 for the two satellites exhibit a high degree of similarity in terms not only of large-scale structures, but also fine-scale features. Moreover, they both indicate that, in addition to the well-known latitudinal gradient pattern (higher/lower values to the north/south; e.g. Mariotti et al., 2001), rain occurrence patterns are complex. These patterns are briefly described below, with a more accurate descrip-tion of the characteristics at different scales (inter-annual,
Fig. 4.Time series of October 2007 total (left) rain and (right) DC counts over the Mediterranean Basin for (top) morning and (bottom) afternoon NOAA-17/AMSU-B (N17, in red) and Metop-2/MHS (M02, in green) passes.
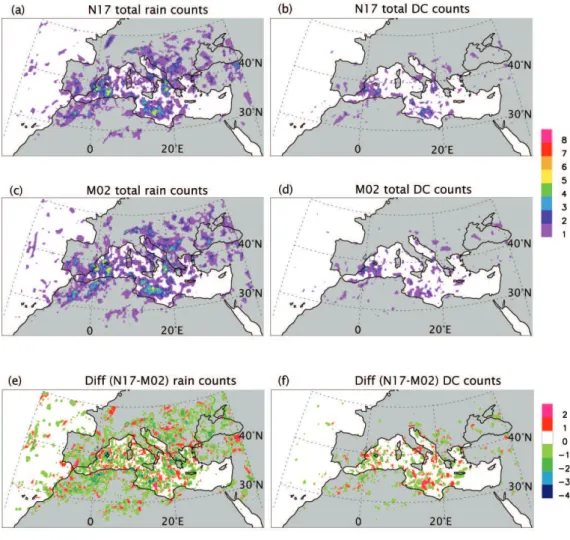
Fig. 5.Spatial distribution of October 2007 (left) rain and (right) DC counts over the Mediterranean Basin for (top) NOAA-17/AMSU-B and (middle) Metop-2/MHS passes, and (bottom) their difference.
This annual distribution results from an important seasonal cycle of rain and DC as illustrated in Fig. 3 for daily, morn-ing (=descending), and evening (=ascending) passes. For NOAA-17, the morning window is 06:00–13:00 UTC, while the evening one is 13:00–23:00 UTC. We recall that, for this figure, the presence of snow was inferred from ERA-I, in order to reduce the underestimation of precipitating events during winter. On average over this 6-yr period (2003–2008) and at the scale of the basin, rain occurrence is maximum during winter and minimum during summer. Rain is always more frequent in the evening than in the morning, with large differences occurring during spring and summer. For this pe-riod, differences during wintertime are large too, but we have observed periods during which they were more reduced (not shown). The DC seasonal cycle is totally different, with a mean daily occurrence that is maximum in the period May– October and minimum in March–April. Unlike rain, there are differences between a.m. and p.m. cycles. In the case of a.m., DC occurrence is weak from March until July and maximizes in October. For p.m., the minimum is reached in
March–April, with largest values between May and Septem-ber. The largest differences between a.m. and p.m. in terms of occurrence are observed during spring and summer. Fu-natsu et al. (2009) showed that there is also a clear pattern of seasonal shift in the location of DC, moving from mostly over land in the period April–August, to mostly over the sea in the period September–December. While the precipitation occurrence distribution is overall congruent with the clima-tology of rainfall amounts provided by the Global Precip-itation Climatology Project, (GPCP; Adler at al., 2003) as shown by Funatsu et al. (2009), the considerable variations across the basin evidenced in our climatology are smeared in GPCP due to its coarser spatial resolution (2.5◦).
3.2 MHS/AMSU-B consistency
Fig. 6.Time series of October 2007 total (left) rain and (right) DC counts over (top) a land and (bottom) a sea box (morning + after-noon) NOAA-17/AMSU-B (in red) and Metop-2/MHS (in green) passes. The coordinates of the land box are (42◦N–45◦N, 20◦E– 25◦E), those of the sea box (38◦N–42◦N, 3.7◦E–7.0◦E).
has to be assessed, even if the results shown in Fig. 2 sug-gest that likely they are minor. According to Kleespies and Watts (2007), based on radiative transfer simulations for di-verse atmospheric profiles, the brightness temperature bias between AMSU-B and MHS for channel 5 would be approxi-mately 0.1 K, with a standard deviation of also approxiapproxi-mately 0.1 K. A further evaluation, based on a larger sample, indi-cates that the differences between AMSU-B and MHS de-pend on the amount of water vapour in the atmosphere and range from−1 to 3 K (in the latter case when the atmosphere is very dry) (John et al., 2012). It has also been suggested that MHS could be more sensitive to convection than AMSU-B (Mo, 2006; Claud et al., 2010).
To examine the consistency between MHS and AMSU-B, Figs. 4a–d show the temporal evolution of global rain and DC counts, based on NOAA-17/AMSU-B and Metop-2/MHS and their difference for the month of October 2007. These counts correspond to the number of grid points for which rain (DC) was detected each a.m./p.m. Morning and afternoon passes are shown separately to account for possible diurnal differences. This month was selected, because rain and deep convections were present over the region throughout this pe-riod, making the comparison more meaningful. A very good agreement between the two instruments is observed for both rain and DC. No systematic difference appears, neither for rain nor for DC, with MHS-based rain and DC sometimes biased high and sometimes biased low compared to AMSU-B, the differences remaining always minor (less than 200/100 points out of about 2 Millions for 1 month). Most of these differences can be ascribed to the different time of sampling (even within 1 h – see Fig. 1), considering the high spatial and temporal variability of rainfall. To a certain extent, the cross-scan characteristics of the instrument (each cross-scan produces
observations of different footprint size according to the view-ing angle (Vila et al., 2007; Di Tomaso et al., 2009), may have also contributed to these differences (the same gridpoint can be viewed under a different viewing angle with NOAA-17 and Metop-2).
Spatial differences between NOAA-17/AMSU-B and Metop-2/MHS are shown in Fig. 5, which displays rain and DC counts, accumulated for each grid point over the month (NOAA-17/AMSUB in Fig. 5a, Metop-2/MHS in Fig. 5b), and the difference (Fig. 5c). Again, no systematic contrast between land and sea or north/south in relation to the amount of water vapour is observed. The temporal evolution of rain and DC counts for an only land box (top panels) and an only sea box (bottom panels) is presented in Fig. 6. It confirms the high consistency between the two radiometers regarding the diagnostics used in this study. Similar results were obtained for other months and areas (not shown).
3.3 Intersatellite differences
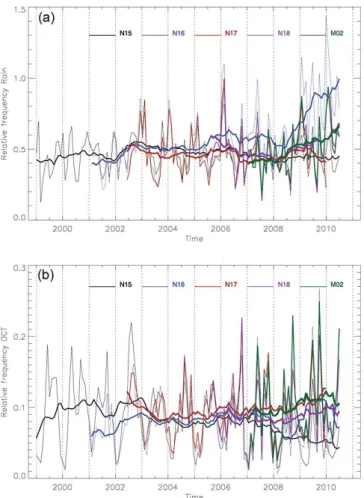
Figure 7 provides multi-year variations in rain and DC de-tected by the AMSU-B aboard NOAA-15 to 17 satellites and the MHS aboard NOAA-18 and Metop-2. The whole Mediterranean region has been considered. Figure 7 shows a fair agreement between all sensors, both in terms of rain and DC, except for NOAA-16 after 2007–2008. Correlation coefficients determined over the common period of the con-sidered satellites reflect this point, with values ranging from 0.61 (between NOAA-15 and NOAA-16) to 0.92 (between Metop-2 and NOAA-18) for rain and from 0.73 (between NOAA-15 and NOAA-16) to 0.93 (between NOAA-17 and NOAA-18) for DC.
Concerning specifically NOAA-16, we found that the rain overestimation, especially after 2008, was caused by prob-lems in BT of channels 4 and 5. A thorough investigation reveals that the BT for the first 20 pixels (out of 90; see Sect. 2.1) was systematically biased high. This left-right asymmetry has already been reported in the literature by Su-russwadee and Staelin (2010) and is related to a residual uncorrected radio-frequency interference (in spite of initial corrections made by NOAA). Because of the small overlap-ping between consecutive passes over the region of interest (significant overlapping could have permitted an a posteriori correction in BT), and the potentially large temporal varia-tions in BT, no reliable correction to these pixels is possible. In addition, removing the 20 affected pixels would have led to gaps, preventing a 0.2◦lat×0.2◦long sampling as
re-quired in our method; therefore, the analysis of NOAA-16 dataset was done until the end of 2007.
Fig. 7.Monthly and 12-month moving average (in bold) time series of(a)rain and(b)DC relative frequency anomalies from NOAA-15 to 18 and Metop-2 satellites.
(otherwise gaps would appear either to the west or the east of the basin): instead of considering passes in the range 02:00–09:00 UTC/12:00–19:00 UTC for a.m./p.m., passes between 01:00–08:00 UTC/11:00–18:00 UTC, respectively, were kept. As a result, ascending (=p.m.) DC decreased sig-nificantly, which indirectly means that deep convection at the scale of the Mediterranean Basin is significant in the range 18:00–19:00 UTC, but weak in the range 11:00–12:00 UTC. Unlike DC, rain does not seem to be affected by this change, because moderate rain is often linked to upper-level sys-tems as evidenced by satellite observations (Chaboureau and Claud, 2006; Funatsu et al., 2008): over the period 2001– 2006, Funatsu et al. (2008) found that, on average, for 80 % of the cases where rain was present, there was a upper-level anomaly present with no difference between a.m. and p.m. Finally, the decrease in NOAA-17 rain after mid-2009 stems to a large extent from the moving average.
Figure 7 also indirectly suggests inter-annual and intra-seasonal variability, even at the scale of the whole basin; for example, the first months of 2006 showed higher rain values,
while spring and summer 2003 were persistently dry, consis-tent with the summer heat wave that hit Europe that year and the spring conditions that preceded it (Fischer et al., 2007). DC was less important in the years 2003-mid-2006 than be-fore and after. As already noted, these variations will be investigated more specifically in another paper and are not discussed in details here.
4 Potential for evaluating model uncertainties
As mentioned earlier, the objective of this section is not to precisely evaluate a given simulation in terms of precipita-tion, but rather to illustrate how the dataset described in this paper can be used to validate a numerical simulation. First, we show how the forecast of a high-impact weather event can be assessed through a model-to-satellite approach. Then, we use the multi-year (2003–2008) output of a long-term simu-lation of the coupled numerical system MORCE (Model of the Regional Coupled Earth system) to compare the seasonal cycles of rain and convective rain in this model and in the dataset.
4.1 Verification of meteorological forecasts
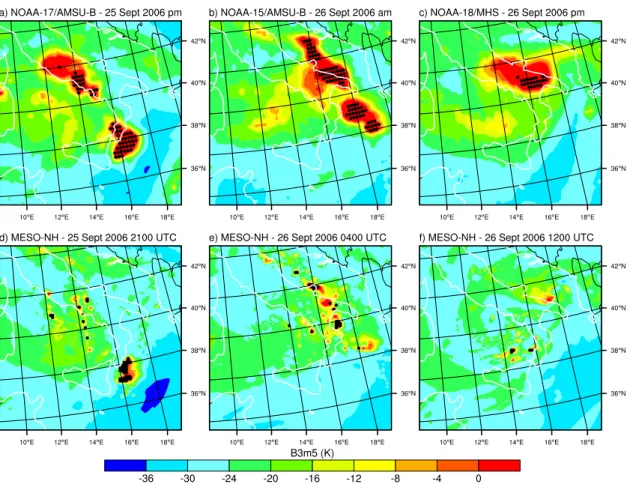
An example of application of this dataset for verifying me-teorological forecasts is shown for an intense cyclogenesis, leading to the formation of a tropical-like storm or med-icane (Mediterranean “hurrmed-icane”) over southeastern Italy (e.g. Claud et al., 2010). The forecast of the medicane was performed with the nonhydrostatic model Meso-NH (Lafore et al., 1998) using the two-way interactive grid-nesting method with triply nested grids, with a horizontal grid spacing of 32, 8 and 2 km. The experiment started on 25 September at 12:00 UTC from the European Centre for Medium-Range Weather Forecasts analyses. It was then in-tegrated until 26 September at 18:00 UTC. For further details on the simulation setup, the reader is referred to Chaboureau et al. (2012).
Fig. 8.B3m5 BT (K, shading) and DC (filled circles) for (left) 25 September 2006 afternoon, (centre) morning, and (right) 26 September 2006 afternoon obtained from (top) AMSU-B/MHS observations, and (bottom) Meso-NH forecasts. Rain is detected whenever B3m5 BT values are equal to or larger than−8 K and deep convection areas are depicted as filled circles.
its predicted convection was less ubiquitous over mainland Italy than observed, the Meso-NH simulation forecasted deep convection over the Ionian Sea correctly (Fig. 8d), associ-ated with a mean sea level pressure (MSLP) minimum of 1002 hPa (not shown). In particular, the circular structure associated with the mesocyclone was well reproduced. On 26 September in a.m. (Fig. 8b–e), two areas of convection were observed with DC, one organized in a line over Apu-lia and the Adriatic Sea, and the other with a circular pat-tern over the Ionian Sea, which is a signature of the medi-cane. Again, the convective activity in the north of the do-main was missed by Meso-NH. In these regions, snow dom-inates in the atmospheric column. As previously diagnosed by Meirold-Mautner et al. (2007), these discrepancies can be attributed to difficulties in accurately representing the radia-tive properties of snow (a mixture of air and ice particles) in the microwave region. Over the Ionian Sea where the most active cell is located, in the Meso-NH simulation, a circular pattern was predicted close to what was observed, but with a DC area underestimation. The good agreement obtained there with the observation corresponds to a region where graupel contents were much more important than snow ones,
situations that generally arise in tropical conditions (Wied-ner et al., 2004). The mesocyclone had then developed as a medicane with a shallow warm core and a MSLP minimum of 992 hPa. On 26 September p.m. (right panels), in the ob-servation, B3m5>−8 K spread over Italy between 40◦and 42◦N while DC persisted in a narrow sector, mostly over
land (Fig. 8c). Observed DC was only marginally associ-ated with the medicane, mainly locassoci-ated over sea. Areas with B3m5 is equal to or larger than−8 K in the Meso-NH sim-ulation were spatially more limited than in the observations, albeit at the right position, whereas no DC in connection with the medicane was simulated (Fig. 8f). At that time, the medi-cane had developed a full tropospheric warm core like a trop-ical storm and its MSLP minimum reached 986 hPa.
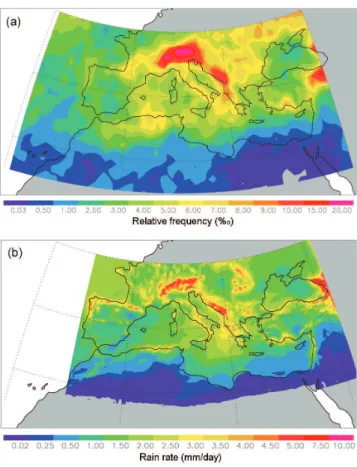
Fig. 9. (a)NOAA-17 rain occurrence (in ‰ at a 1◦×1◦grid) and
(b)MORCE rain rate (in mm day−1) for the period 2003–2008.
4.2 Regional climatic runs evaluation
For the description of the whole numerical platform and the experimental setup, we refered the reader to Drobinski et al. (2012). In brief, the numerical system was the MORCE (Model of the Regional Coupled Earth system), which was developed for process and climate studies, especially in the Mediterranean region. The atmospheric component was the Weather Research and Forecasting (WRF) model of the NCAR (Skamarock et al., 2008). The domain covered the Mediterranean Basin with a horizontal resolution of 20 km and 28 vertical sigma levels. The oceanic component was NEMO (Madec, 2008) and was used in a regional Mediter-ranean configuration called MED12 (Lebeaupin Brossier et al., 2011) with a 1/12◦ horizontal resolution and 50
un-evenly spaced Z-levels in the vertical. The ocean-atmosphere coupling consisted of Sea Surface Temperature (SST) and fluxes of heat (solar and non-solar), water and momentum exchanges between the two components. The exchange fre-quency and the field interpolation were realized through the OASIS coupler (Valcke, 2006), with a coupling frequency of 3 h. The coupled experiment covered the period 1 Jan-uary 1989–31 December 2008, and was forced by ERA-Interim (Dee et al., 2011).
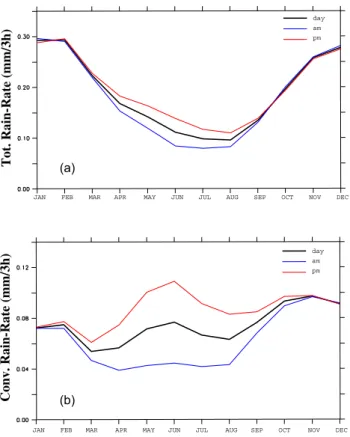
MORCE precipitation (in terms of annual mean rain rate) and AMSU rain occurrence fields are provided in Fig. 9 for the period 2003–2008. Because no rain rate was produced from AMSU-B/MHS, it is impossible to perform a direct comparison. In addition, gridpoints for which DC is de-tected do not all correspond to a single rain rate threshold value (see Fig. 8 of Funatsu et al., 2007). However, a qual-itative comparison indicates a fair agreement between the two datasets with minimum values to the south of the gion and maxima in connection with orography or for re-gions known to be chararacterized by large cyclonic activ-ity (Sect. 2). Of special interest is the annual cycle of to-tal rain and convective rain produced by the model (by con-vective rain, one means rain produced by the atmospheric convection parameterization (Kain, 2004) in the model), which is displayed Fig. 10a and b for morning (06:00–09:00– 12:00 UTC), evening (15:00–18:00–21:00 UTC), and daily (the average of a.m. and p.m.). The annual cycle of total rain is overall in fair qualitative agreement with the one of AMSU-B-derived rain occurrence (Fig. 3a) with a minimum in summer and a maximum during fall. In agreement with the observations, rain rate is generally larger in the evening than in the morning with large differences in spring and sum-mer, but unlike the observations, the difference between a.m. and p.m. rain rate is weak from October until March. The simulated convective rain cycle (Fig. 10b) also shows a lot of similarities with the observed one (Fig. 3b) with a maximum in the period May–October, even if p.m. convective activ-ity is relatively weaker in August–September and stronger in October compared to AMSU-B. As for rain, differences be-tween p.m. and a.m. are weak during wintertime, while they are more significant in the observations.
5 Summary and conclusions
JAN FEB MAR APR MAY JUN JUL AUG SEP OCT NOV DEC
Tot. Rain-Rate (mm/3h)
day am pm
JAN FEB MAR APR MAY JUN JUL AUG SEP OCT NOV DEC
Conv. Rain-Rate (mm/3h)
day am pm (a)
(b)
Fig. 10.Seasonal cycle of MORCE(a)total rain-rate and(b) con-vective rain rate for the 2003–2008 period averaged over the Mediterranean domain (as in Fig. 9b). Unit is mm/3 h. The cy-cle is shown separately for the morning (06:00–12:00 UC, blue), evening (15:00–21:00 UTC, red), and daily (average of a.m. and p.m., black).
hydrometeors and the surface is not easy, precipitation oc-currence is underestimated (Funatsu et al., 2009). Improve-ments are still underway, like the use of ancillary information in ERA-I.
For each satellite, the dataset consists of twice-daily (a.m. and p.m.) and monthly maps of precipitation and convec-tion occurrence on a global 0.2◦lat×0.2◦long grid for the
Mediterranean area, i.e. 25◦–60◦N, 10◦W–50◦E. The
pe-riod covered so far goes from 1999 to 2010 and made use of NOAA-15 to -19 and Metop-2 satellites. Precipitation and convection occurrences are available separately for the different sensors. The slightly different radiometric charac-teristics of MHS compared to AMSU-B do not significantly affect the continuity of the dataset. Precipitation and convec-tion occurrences from different sensors on different satellites are remarkably consistent, with small biases between the in-struments. When larger biases appear, they can be explained either by the drifts in the satellite orbit (e.g. NOAA-15), scan asymmetry (NOAA-16 after 2007), or the diurnal cycle of precipitation and convection.
The global mean distribution of rain and convection oc-currence in the dataset is in good qualitative agreement with precipitation climatologies in terms of large-scale structures.
The dataset also captures the yearly cycle of moderate rain and convection, consistently with expectations based on the known features of the general circulation. However, the distribution shows a number of regional structures features that are too fine to be captured by the most-widely used satellite-based precipitation climatologies (e.g. CMAP, Xie and Arkin, 1996; GPCP, Adler et al., 2003). Overall, rain and DC occurrence appear to be very much dependant on the cyclones path, in agreement with e.g. Jansa et al. (2001), with a strong link to the orography over land. This dataset is also promising by the number of details regarding the diurnal cycle in terms of rain and convection occurrences that have been illustrated using a single satellite. The use of several simultaneous satellites will enhance this knowledge, and is the subject of an ongoing study.
The interest of such a dataset for evaluating model uncer-tainties has been then illustrated in two different configura-tions (meteorological forecast and climate run). In the first case, data have been used to evaluate the quality of numeri-cal simulations of precipitating systems through a model-to-satellite approach for a high-weather impact event that oc-curred over Italy. Such an evaluation involves the numeri-cal simulation of brightness temperatures at AMSU-B/MHS wavelengths using a radiative transfer model and their com-parison to the observations. While it allows an assessment of the model’s physical parameterizations, it also provides new insights into precipitation events and processes (pres-ence of deep convection). The second case consisted of a multi-year simulation. A big advantage in this case comes from the quasi-identical spatial resolution, which permits to compare not only the large-scale features, but also more local ones and thus validate rain distribution over islands or coastal regions. The seasonal cycles of total and convective rain have been compared for a.m. and p.m. While these compar-isons have shown an overall fair agreement with the observa-tions, they have also indicated some differences (like weaker differences between a.m. and p.m. during winter months), which will prompt further investigations in the future. The dataset offers many more possibilities, particularly with sim-ilar works at the regional scale (e.g. Mediterranean Sea /land only; Western/Eastern Mediterranean region. . . ) and at dif-ferent temporal scales (diurnal, monthly, seasonal). Also, the model-to-satellite approach will be adopted to evaluate the multi-year simulation, in combination with the more classi-cal approach presented here.
Acknowledgements. This work was carried out in the framework of the MEDUP project (Grant ANR-07-VULN-06-001), funded by the Vuln´erabilit´e Milieux et Climat (VMC) programme of the National Research Agency (ANR) and was partly sponsored by the Chaire de D´eveloppement Durable of the Ecole Polytechnique and by Centre National d’Etudes Spatiales. AMSU data was obtained through the French Mixed Service Unit ICARE and CLIMSERV. The MORCE plateform was developed within the MORCE-MED project funded by the GIS “Climat, Environnement et Soci´et´e”, with granted access to the HPC resources of IDRIS (under allocation i2011010227). The MORCE coupled simulation and its validation contribute to the SiMed project (Simulation of the Mediterranean Sea) funded by Groupe Mission Mercator-Coriolis, to the Med-Cordex project (A COordinated Regional climate Downscaling EXperiment – Mediterranean region) funded by the World Climate Research Program, and to the HyMeX program (Hydrological cycle in the Mediterranean EXperiment) through INSU-MISTRALS support.
Edited by: G. Molinie
Reviewed by: S. Dietrich and another anonymous referee
The publication of this article is financed by CNRS-INSU.
References
Adler, R. F., Huffman, G. J., Chang, A., Ferraro, R., Xie, P.-P., Janowiak, J., Rudolf, B., Schneider, U., Curtis, S., Bolvin, D., Gruber, A., Susskind, J., Arkin, P., and Nelkin, E.: The version-2 Global Precipitation Climatology Project (GPCP) monthly pre-cipitation analysis (1979–present), J. Hydrometeor., 4, 1147– 1167, 2003.
Aznar, R., Sotillo, M. G., Martin, M. L., Somot, S., and Valero, F.: Comparison of model and satellite-derived longterm precipita-tion databases over the Mediterranean Basin: a general overview, Atmos. Res., 97, 170–184, 2010.
Bartholy, J., Pongracz, R., and Pattanyus-Abraham M.: Analyzing the genesis, intensity and tracks of western Mediterranean cy-clones, Theor. Appl. Climatol., 96, 133–144, 2009.
Bennartz, R. and Petty, G. W.: The sensitivity of microwave remote sensing observations of precipitation to ice particle size distribu-tions, J. Appl. Met. Clim., 40, 345–364, 2001.
Buehler, S. A. and John, V. O.: A simple method to relate mi-crowave radiances to upper tropospheric humidity. J. Geophys. Res., 110, D02110, doi:10.1029/2004JD005111, 2005.
Buehler, S. A., Kuvatov, M., and John, V. O.: Scan asymme-tries in AMSU-B data, Geophys. Res. Lett., 32, L248110, doi:10.1029/2005GL024747, 2005.
Campins, J., Genoves, A., Jansa, A., Guijarro, J. A., and Ramis, C.: A catalogue and a classification of surface cyclones for the Western Mediterranean, Int. J. Climatol., 20, 969–984, 2000. Chaboureau, J.-P. and Claud, C.: Satellite-based
climatol-ogy of Mediterranean cloud systems and their association with large-scale circulation, J. Geophys. Res., 111, D01102, doi:10.1029/2005JD006460, 2006.
Chaboureau, J. P., Cammas, J. P., Mascart, P., Pinty, J. P., Claud, C., Roca, R., and Morcrette, J. J.: Evaluation of a cloud system life-cycle simulated by Meso-NH during FASTEX using ME-TEOSAT radiances and TOVS-3I cloud retrievals, Q. J. R. Mete-orol. Soc., 126, 1735–1750, 2000.
Chaboureau, J.-P., Pantillon, F., Lambert, D., Richard, E., and Claud, C.: Tropical transition of a Mediterranean storm by jet crossing, Q. J. R. Meteorol. Soc., doi:10.1002/qj.960, in press, 2012.
Claud, C., Alhammoud, B., Funatsu, B. M., and Chaboureau, J.-P.: Mediterranean hurricanes: large-scale environment and convective and precipitating areas from satellite microwave observations, Nat. Hazards Earth Syst. Sci., 10, 2199–2213, doi:10.5194/nhess-10-2199-2010, 2010.
Dee, D. P., Uppala, S. M., Simmons, A. J., Berrisford, P., Poli, P., Kobayashi, S., Andrae, U., Balmaseda, M. A., Balsamo, G., Bauer, P., Bechtold, P., Beljaars, A. C. M., van de Berg, L., Bid-lot, J., Bormann, N., Delsol, C., Dragani, R., Fuentes, M., Geer, A. J., Haimberger, L., Healy, S. B., Hersbach, H., H´olm, E. V., Isaksen, L., K˚allberg, P., K¨ohler, M., Matricardi, M., McNally, A. P., Monge-Sanz, B. M., Morcrette, J.-J., Park, B.-K., Peubey, C., de Rosnay, P., Tavolato, C., Th´epaut, J.-N., and Vitart, F.: The ERA-Interim reanalysis: configuration and performance of the data assimilation system, Q. J. R. Meteorol. Soc., 137, 553– 597, doi:10.1002/qj.828, 2011.
Deeter, M. N. and Vivekanandan, J.: AMSU-B observations of mixed-phase clouds over land, J. Appl. Meteor., 44, 72–85, 2005. Di Tomaso, E., Romano, F., and Cuomo, V.: Rainfall esti-mation from satellite passive microwave observations in the range 89 GHz to 190 GHz, J. Geophys. Res., 114, D18203, doi:10.1029/2009JD011746, 2009.
Drobinski, P., Ducrocq, V., and Lionello P.: Studying the hydro-logical cycle in the Mediterranean, EOS Trans. Am. Geophys. Union, 91, p. 373, doi:10.1029/2010EO410006, 2010.
Drobinski, P., Ducrocq, V., Lionello, P., and Homar, V. : HyMeX, the newest GEWEX regional hydroclimate project, GEWEX Newsletter, 21, 10–11, 2011.
Drobinski, P., Anav, A., Lebeaupin Brossier, C., Samson, G., St´efanon, M., Bastin, S., Baklouti, M., B´eranger, K., Beu-vier, J., Bourdall´e-Badie, R., Coquart, L., D’Andrea, F., De Noblet-Ducoudr´e, N., Diaz, F., Dutay, J.C., Ethe, C., Fou-jols, M.A., Khvorostyanov, D., Madec, G., Mancip, M., Mas-son, S., Menut, L., Palmieri, J., Polcher, J., Turquety, S., Valcke, S., and Viovy, N.: Modelling the Regional Coupled Earth system (MORCE): application to process and climate stud-ies in vulnerable regions, Environ. Model. Softw., in press, doi:10.1016/j.envsoft.2012.01.017, 2012.
Fischer, E. M., Seneviratne, S. I., Luthi, D., and Schar, C.: Contribution of land-atmosphere coupling to recent Euro-pean summer heat waves, Geophys. Res. Lett., 34, L06707, doi:10.1029/2006GL029068, 2007.
Hat-saki, M., Bricolas V., and Asimakopoulos, D.: On cyclonic tracks over the Eastern Mediterranean, J. Climate, 23, 5243– 5257, doi:10.1175/2010JCLI3426.1, 2010.
Frei, C. and Sch¨ar, C.: A precipitation climatology of the Alps from high-resolution rain-gauge observations, Int. J. Climatol., 18, 873–900, 1998.
Funatsu, B. M., Claud, C., and Chaboureau, J. P.: Potential of Advanced Microwave Sounding Unit to identify precipitat-ing systems and associated upper-level features in the Mediter-ranean region: Case studies, J. Geophys. Res., 112, D17113, doi:10.1029/2006JD008297, 2007.
Funatsu, B. M., Claud, C., and Chaboureau, J. P.: A 6-year AMSU-based climatology of upper-level troughs and associated precipi-tation distribution in the Mediterranean region, J. Geophys. Res., 113, D15120, doi:10.1029/2008JD009918, 2008.
Funatsu, B. M., Claud, C., and Chaboureau, J. P.: Comparison be-tween the large-scale environments of moderate and intense pre-cipitating systems in the Mediterranean region, Mon. Weather Rev., 137, 3933–3959, doi:10.1175/2009MWR2922.1, 2009. Gaertner, M. A., Jacob, D., Gil, V., Dominguez, M., Padorno, E.,
Sanchez, E., and Castro, M.: Tropical cyclones over the Mediter-ranean Sea in climate change simulations, Geophys. Res. Lett., 34, L14711, doi:10.1029/2007GL029977, 2007.
Giorgi, F.: Climate change hot-spots, Geophys. Res. Lett., 33, L08707, doi:10.1029/2006GL025735, 2006.
Goodrum, G., Kidwell, K., and Winston, W.: NOAA KLM User’s Guide, US Dept. of Commerce, National Oceanic and Atmo-spheric Administration, National Environmental Satellite Data and Information Service, 2000.
Greenwald, T. J. and Christopher, S. A.: Effect of cold clouds on satellite measurements near 183 GHz, J. Geophys. Res., 107, 4170, doi:10.1029/2000JD000258, 2002.
Hong, G., Heygster, G., Miao, J., and Kunzi, K.: Detection of tropical deep convective clouds from AMSU-B water va-por channels measurements, J. Geophys. Res., 110, D05205, doi:10.1029/2004JD004949, 2005.
Hulme, M., Barrow, E. M., Arnell, N. W., Harrison, P. A., Johns, T. C., and Downing, T. E.: Relative impacts of human-induced cli-mate change and natural variability, Nature, 397, 688–691, 1999. Jansa, A., Genoves, A., Picornell, M. A., Campins, J., Riosalido, R., and Carretero, O.: Western Mediterranean cyclones and heavy rain, Part 2: Statistical approach, Meteor. Appl., 8, 43–56, 2001. John, V. O., Holl, G., Buehler, S. A., Candy, B., Saunders, R. W., and Parker, D. E.: Understanding inter-satellite bi-ases of microwave humidity sounders using global simul-taneous nadir overpasses, J. Geophys. Res., 117, D02305, doi:10.1029/2011JD016349, 2012.
Kain, J. S.: The Kain-Fritsch convective parameterization: An up-date, J. Appl. Meteorol., 43, 170–181, 2004.
Kleespies, T. J. and Watts, P.: Comparison of simulated radiances, Jacobians and linear error analysis for the Microwave Humidity Sounder and the Advanced Microwave Sounding Unit-B, Q. J. R. Meteorol. Soc., 132, 3001–3010, 2007.
Kongoli, C., Pellegrino, P., Ferraro, R., Meng, H., and Dean, C.: The utilization of the AMSU high frequency measurements for improved coastal rain retrievals, Geophys. Res. Lett., 34, L17809, doi:10.1029/2007GL029940, 2007.
Lafore, J. P., Stein, J., Asencio, N., Bougeault, P., Ducrocq, V., Duron, J., Fischer, C., H´ereil, P., Mascart, P., Masson, V., Pinty,
J. P., Redelsperger, J. L., Richard, E., and Vil`a-Guerau de Arel-lano, J.: The Meso-NH Atmospheric Simulation System. Part I: adiabatic formulation and control simulations, Ann. Geophys., 16, 90–109, doi:10.1007/s00585-997-0090-6, 1998.
Laviola, S. and Levizzani, V.: Observing precipitation by means of water vapor absorption lines: a first check of the retrieval capa-bilities of the 183-WSL rain retrieval method, Italian J. Remote Sens., 41, 39–49, 2009.
Laviola, S. and Levizzani, V.: The 183-WSL fast rain rate retrieval algorithm, Part I: Retrieval design, Atmos. Res., 99, 443–461, 2011.
Lebeaupin Brossier, C., B´eranger, K., Deltel, C., and Drobinski, P.: The Mediterranean response to different space-time resolution atmospheric forcings using perpetual mode sensitivity simula-tions, Ocean Model., 36, 1–25, 2011.
Lima, W. F. A., Machado, L. A. T., Morales, C. A., and Vil-tard, N.: Rainfall sensitivity analyses for the HSB sounder: an Amazon case study, Int. J. Remote Sens., 28, 3520–3545, doi:10.1080/01431160601013526, 2007.
Madec, G.: NEMO ocean engine, Note du Pole de mod´elisation, Institut Pierre-Simon Laplace (IPSL), France, No 27, ISSN No 1288-1619, 2008.
Mariotti, A., Struglia, M., Zeng, N., and Lau, K.: The hydrological cycle in the Mediterranean region and implications for the wa-ter budget of the Mediwa-terranean Sea, J. Climate, 15, 1674–1690, 2001.
Meirold-Mautner, I., Prigent, C., Defer, E., Pardo, J.-R., Chaboureau, J.-P., Pinty, J.-P., Mech, M., and Crewell, S.: Ra-diative transfer simulations using mesoscale cloud model out-puts: comparisons with passive microwave and infrared satellite observations for mid-latitudes, J. Atmos. Sci., 64, 1550–1568, 2007.
Mo, T.: AMSU-A antenna pattern corrections, IEEE Trans. Geosci. Remote Sens., 37, 103–112, 1999.
Mo, T.: Calibration and validation of the NOAA-18 Microwave ra-diometers, IEEE MicroRad, 24–28, 2006.
Saunders, R. W., Matricardi, M., Brunel, P., English, S., Bauer, P., O’Keeffe, U., Francis, P., and Rayer, P.: RTTOV-8 Science and Validation Report, Technical Report, Numer. Weather Predic. Satell. Appl. Facil., Exeter, UK, 41 pp., 2005.
Skamarock, W. C., Klemp, J. B., Dudhia, J., Gill, D. O., Barker, D. M., Duda, M. G., Huang, X-Y., Wang, W., and Powers, J. G.: A description of the Advanced Research WRF Version 3, NCAR Tech. Note NCAR/TN-475+STR, 125 pp., 2008.
Surussawadee, C. and Staelin, D. H.: Satellite retrievals of Arctic and Equatorial rain and snowfall rates using Millimeter Wave-lengths, IEEE Trans. Geosci. Remote Sens., 47, 3697–3707, doi:10.1109/TGRS.2009.2029093, 2009.
Surussawadee, C. and Staelin, D.H.: Global precipitation retrievals using the NOAA AMSU Millimeter-Wave Channels: Com-parisons with rain gauges, J. Appl. Met. Clim., 49, 124–135, doi:10.1175/2009JAMC2262.1, 2010.
Trigo, I. F., Bigg, G. R., and Davies, T. D.: Climatology of cyclo-genesis mechanisms in the Mediterranean, Mon. Weather Rev., 130, 549–569, 2002.
Valcke, S.: OASIS3 User Guide (prism\2–5), CERFACS Tech-nical Report TR/CMGC/06/73, PRISM Report No 3, Toulouse, France, 60 pp., 2006.
AMSU precipitation retrievals, J. Geophys. Res., 112, D20119, doi:10.1029/2007JD008617, 2007.
Wiedner, M., Prigent, C., Pardo, J. R., Nuissier, O., Chaboureau, J.-P., Pinty, J.-J.-P., and Mascart, P.: Modeling of passive microwave responses in convective situations using output from mesoscale models: Comparison with TRMM/TMI satellite observations, J. Geophys. Res., 109, D06214, doi:10.1029/2003JD004280, 2004.
Xie, P. and Arkin, P. A.: Analyses of global monthly precipita-tion using gauge observaprecipita-tions, satellite estimates, and numerical model predictions, J. Climate, 9, 840–858, 1996.