On Hunting Animals of the Biometric
Menagerie for Online Signature
Nesma Houmani1*, Sonia Garcia-Salicetti2
1Télécom SudParis, Université Paris-Saclay, 9 rue Charles Fourier 91011 EVRY Cedex, France, 2SAMOVAR, Télécom SudParis, CNRS, Université Paris-Saclay, 9 rue Charles Fourier 91011 EVRY Cedex, France
*nesma.houmani@telecom-sudparis.eu
Abstract
Individuals behave differently regarding to biometric authentication systems. This fact was formalized in the literature by the concept of Biometric Menagerie, defining and labeling user groups with animal names in order to reflect their characteristics with respect to biomet-ric systems. This concept was illustrated for face, fingerprint, iris, and speech modalities. The present study extends the Biometric Menagerie to online signatures, by proposing a novel methodology that ties specific quality measures for signatures to categories of the Biometric Menagerie. Such measures are combined for retrievingautomaticallywriter cate-gories of the extended version of the Biometric Menagerie. Performance analysis with differ-ent types of classifiers shows the pertinence of our approach on the well-known MCYT-100 database.
1. Introduction
Biometric systems’performance is usually assessedgloballyon the whole available data, and that in terms of the two types of errors that a biometric system can make on a given sample: False Rejections and False Acceptances [1]. A False Rejection occurs when a genuine or authen-tic sample of a user is falsely rejected by the biometric system. A False Acceptance occurs when a forgery or imposture is falsely accepted by the system [1]. Even though system performance is measuredglobally, the difficulty in authenticating persons is not the same from one individ-ual to another. In order to have a better insight on the behavior of a biometric system, an alter-native is to identify groups of users having common traits and to assess performance on each group separately.
In [2,3,4,5,6], we introduced a personalized quality measure for online signatures, called Personal Entropy, which allows generating writer categories. Such categories showed a stable relative behavior when being confronted to several classifiers on different databases. This inter-esting result was later confirmed with numerous classifiers on large databases [7,8] in the framework of two international online signature verification competitions, namely BSEC’2009 [9] and ESRA’2011 [10].
OPEN ACCESS
Citation:Houmani N, Garcia-Salicetti S (2016) On Hunting Animals of the Biometric Menagerie for Online Signature. PLoS ONE 11(4): e0151691. doi:10.1371/journal.pone.0151691
Editor:Yongtang Shi, Nankai University, CHINA
Received:September 16, 2015
Accepted:March 2, 2016
Published:April 7, 2016
Copyright:© 2016 Houmani, Garcia-Salicetti. This is an open access article distributed under the terms of theCreative Commons Attribution License, which permits unrestricted use, distribution, and reproduction in any medium, provided the original author and source are credited.
Data Availability Statement:Data are from Professor Javier Ortega at Universidad Autonoma de Madrid, Spain. Future researchers interested by this data must contact Professor Javier Ortega at the following address:javier.ortega@uam.esand Julian Fierrez at the following address:julian.fierrez@uam. es, in order to retrieve and sign a "Non Disclosure Agreement" (NDA), as we did.
Funding:The authors have no support or funding to report.
For several other biometric modalities (speech, face, iris, fingerprints, keystroke dynamics), user groups have been formally defined and labeled with animal names that reflect their behav-ior regarding to biometric systems: this gave rise to the concept of“Biometric Menagerie”
[11,12,13].
The concept of“Biometric Menagerie”was initially formalized by Doddington et al. [11]. The authors grouped speakers in four non-exclusive categories, labeled as“Sheep”,“Goats”,
“Lambs”and“Wolves”(Fig 1). Such categories are defined based on the genuine match scores
orimpostor match scores of a given classifier.“Sheep”represent speakers who are easy to rec-ognize; they exhibit low FRR. At the opposite,“Goats”represent speakers who are difficult to recognize; they tend to increase the FRR.“Lambs”are speakers who are easy to imitate, leading to increase the FAR. Finally,“Wolves”are speakers who are successful at imitating others, tend-ing to increase the FAR significantly. Such categorization was later applied in the context of face [12,14,15], fingerprint [12,13,15], and iris biometrics [12,15,16].
More recently, Yager & Dunstone [12,13] have completed such a Biometric Menagerie by adding four other categories of users:“Worms”,“Chameleons”,“Phantoms”and“Doves”(Fig 2). Such categories were defined according to a user’srelationshipbetween the genuine and impostor match scores [12,13].“Chameleons”lead to high genuine and impostor match scores. At the opposite,“Phantoms”lead to low genuine and impostor match scores.“Doves”are a sub-group of“Sheep”; they represent the best users since they lead both to high genuine and low impostor match scores. At the opposite,“Worms”are a sub-group of“Goats”;they are the worst users, showing low genuine and high impostor scores. This categorization was applied on face, speech, fingerprint, iris and keystroke modalities [12].
Different works focusing on Doddington’s categorization [11,12,13,14,15,16,17,18,19] pro-vide epro-vidence that the Biometric Menagerie exists in most biometric modalities. To our knowl-edge, in the signature biometrics, there is no complete study on the existence of all the
Fig 1. Doddington’s representation of the Biometric Menagerie [11].
categories of the Biometric Menagerie. A preliminary study in offline signature pointed out the existence of“Goats”[20] and their variations according to different feature extractions. Another study on revocability in online signature analyzed the stability of individuals in the categories of“Goats”and“Sheep”[21].
The lack of works in the handwritten signature literature on the Biometric Menagerie is quite surprising since additionally to our works [2,3,4,5,6], the concept of writer categories was already addressed in several other works on handwritten signature [22,23,24,25,26,27]. By relating writer categories to classifier performance, such works pointed out that writers exhibit different behaviors regarding to signature verification systems. Indeed, they set some trends on classifier performance according toquality criteriaof signatures, namely complexity, variability and legibility. In the case of offline signature, Alonso et al. in [22,23] generated manually three groups based onwriter’s intra-variability, which was measured using Mahalanobis distance [22,23]. When analyzing such categories, the authors observed that performance was degraded for writers with highly variable signatures. In [23,24], Alonso et al. consideredcomplexityand
legibilitycriteria for categorizing writers visually into four groups. The authors noted that the most complex and legible signatures lead to the best classifier performance. In the case of online signature, Brault et al. [25] concluded that“problematic signers”are those having unsta-bleandnot complexenough signatures [25].
All these works agree on specific quality criteria for signatures (complexity, stability and leg-ibility) that predict a certain performance level of signature verification systems. However, none of these works tackles the Biometric Menagerie for signatures.
In this paper, we aim at relating the above-mentioned quality criteria for signatures to the concept of Biometric Menagerie. In our previous works [2,4,5,6], we introduced a quality mea-sure, called Personal Entropy, based on the concept of entropy, widely exploited in data mining [28,29,30,31]. The proposed Personal Entropy measure quantifies directly on genuine
Fig 2. Yager & Dunstone’s representation of the Biometric Menagerie [12,13].
signatures both theircomplexityand theirstability. This work will show that Personal Entropy can be successfully exploited for studying the Biometric Menagerie.
Additionally, the objective of this work requires assessing the vulnerability of a writer to skilled forgeries. Indeed, user groups of the Biometric Menagerie are traditionally defined in terms of average genuine and/or average impostor classifier output scores. For this reason, we propose another personalized quality measure, namelyRelative Entropy, which allows a writer to be characterized not only in terms of signature complexity and signature variability, as Per-sonal Entropy does, but also in terms ofhow difficult it is to attacksuch a signature with a
skilled forgery. In the literature, to our knowledge, the only study tackling this problem is that of Brault et al. [26]. In such work, the difficulty of reproducing a signature, namely of carrying out a skilled forgery, is quantified by a“difficulty coefficient”related tocomplexityof the signa-ture [25]. It is computed as a function of the rate of geometric modifications per unit of time. The study concludes that“problematic signers”in terms of systems’performance are those hav-ing a low“difficulty coefficient”.
The adopted methodology in this paper is to hunt animals of the Biometric Menagerie in online signature by combining the two entropy-based quality measures. Moreover, our pro-posal is to retrieve groups of usersautomaticallywith aclustering procedureperformed on such two measures, and to analyze the relationship existing between the characteristics of the obtained groups and classifier performance. The originality of our contribution is to offer for online signature an alternative to the usual methodology for hunting categories of the Menag-erie, methodology that has the limitation of being dependent on a given classifier’s output scores, as stated by several works in the literature [12,13,15,16,17,18,19,20].
This paper is organized as follows: in Section 2, we propose to retrieve automatically by Hierarchical Clustering writer categories of the Biometric Menagerie, based on the output scores of local and global classifiers. In Section 3, we describe the two entropy measures and study their relationship to verification performance. In Section 4, writer categories of the Bio-metric Menagerie are retrieved by Hierarchical Clustering, now based on the two entropy mea-sures. Conclusions and perspectives are given in Section 5.
2. Looking for the Menagerie by Output Scores
’
Analysis
In this section, we intend to retrieve writer categories of the Biometric Menagerie on MCYT-100 online signature database [32], and that by exploiting two classifiers: the first is based on Dynamic Time Warping (DTW) that matches two signatureslocally[33]; the second relies on Hamming distance that performs aglobalmatch of two signatures. The aim of this experiment is to illustrate for online signature the statement of Yager & Dunstone [12]:“a person cannot be labeled an animal independent of a specific algorithm”.
2.1. MCYT-100 database description
In this work, we used the widely used and freely available MCYT-100 database [32]. In such database, signatures are acquired on WACOM pen tablet, model INTUOS A6 USB. The pen tablet resolution is 2540 lines per inch, and the precision is 0.25mm. The maximum detection height is 10 mm (pen-up movements are also considered), and the capture area is 127 mm (width) × 97 mm (height). The sampling frequency was set to 100 Hz. The capture area was further divided into 37.5 mm (width) × 17.5 mm (height) blocks which are used as frames for acquisition. At each sampled point of the signature, the digitizer captures pen coordinates, pen pressure (1024 pressure levels), and Azimuth and Altitude pen inclination angles.
writing naturally, without artifacts such as breaks or slowdowns. The acquisition procedure is as follows. SignerSiwrites a set of 5 genuine signatures, and then 5 skilled forgeries of the
signerSi-1. This procedure is repeated four more times imitating previous usersSi-2,Si-3,Si-4
andSi-5. As a result, each signer contributes with 25 genuine signatures in 5 groups of 5
signa-tures each, and is forged 25 times by 5 different forgers. The total number of donors in MCYT is 330 [32]. However, a subset of only 100 persons is freely available (MCYT-100).
2.2. Score computation of the two classifiers
In this work, we used the DTW-based classifier considering the raw coordinates as input data. It has been shown in different online signature competitions that pen coordinates are sufficient for obtaining good performance with DTW classifier [34]. Concerning the other classifier, we used 40 features [35] computed in a holistic manner on each signature sample. Indeed, it is well-known in the literature [36] that a global approach for signature matching requires a large amount of features for building a good enough classifier.
Genuine and impostor scores are computed as follows with each classifier: we carry out 5 random samplings on genuine signatures. Each sampling contains 5 genuine signatures consid-ered as enrolment signatures. Among the remaining genuine signatures, 10 are used for com-puting genuine scores. Among the available skilled forgeries, 15 are used for comcom-puting impostor scores. Finally, the FRR and the FAR are averaged on the 5 random samplings.
The dissimilarity matching score of the DTW-based classifier is defined as:
Score¼Dminðprobe;enrolmentiÞi¼1;. . .;5 ð1Þ
whereDmindenotes the minimum of thefive distances computed between the probe signature
and thefive enrolment signatures.
The dissimilarity matching score of the global classifier is defined as:
Score¼HDavgðprobe;enrolmentiÞi¼1;. . .;5 ð2Þ
whereHDavgdenotes the average of thefive Hamming distances computed between the probe
signature and thefive enrolment signatures.
The degree of dissimilarity between two signatures is measured by this dissimilarity score. A genuine or authentic score results of matching two signatures of the same user; a forgery or impostor score results of matching two signatures belonging to two different users. The deci-sion rule of the biometric system is the following: when the dissimilarity score is lower than a given threshold value, the probe sample is accepted (the claimed identity too); otherwise it is rejected. A genuine score higher than the decision threshold results in a False Rejection. An impostor score lower than the threshold results in a False Acceptance [1]. The False Accep-tance Rate (FAR) is defined as the fraction of impostor scores that are lower than the threshold; the False Rejection Rate (FRR) is defined as the fraction of genuine scores that are higher than the threshold. For each value of the decision threshold a couple of error rates (FRR, FAR) is computed. A biometric system is usually evaluated in the literature by plotting the FRR against the FAR, when computed at different values of the threshold; this results in the Detection Error Tradeoff (DET-Curve) that displays the tradeoff between the FRR and the FAR [1].
2.3. Hunting animals of the Menagerie with local and global classifiers
Animals of Doddington’s Menagerie (Fig 1) depend on either the FRR or the FAR:“Goats”and
“Sheep”are characterized bygenuine scores(writers respectively difficult or easy to recognize);
imitate or successful at imitating). Besides, in Yager & Dunstone’s Menagerie (Fig 2), new ani-mal groups were defined in terms of arelationship between genuine and impostorscores.
Figs3and4display writer categories of the Biometric Menagerie when considering respec-tively the local and the global classifiers. Such categories are obtained automatically by per-forming a Hierarchical clustering [37,38] first on genuine output scores, then on impostor output scores. Thus, three categories are retrieved along the genuine scores’axis and 3 catego-ries along the impostor scores’axis. It is worth noticing that no thresholds are involved in the clustering procedure leading to animal groups. The resulting membership of users to animal groups is represented in Figs3and4by contours of arbitrary shape.
We notice as expected [12,13,15,16] that the resulting categories of the Menagerie strongly depend on the classifier. Indeed, with the global classifier, there are significantly more“Worms”
(writers difficult to recognize) and more“Lambs”(writers easy to imitate) than with the local classifier. On the other hand, with the local classifier, there are significantly more“Doves” Fig 3. Animals of the Biometric Menagerie hunted with the local classifier.
(writers easy to recognize). All such remarks are in perfect accordance with the literature [36]: it has been shown that classifiers based on a local paradigm outperform in general those based on a global one. The above analysis naturally leads to the following conclusion:the retrieved writer categories reflect the characteristics of the classifier that is used. Although this result is not sur-prising, since the Biometric Menagerie is precisely defined relying on classifiers’scores [12], it points out an inherent methodological difficulty for the retrieval of writer categories.
The present work responds to this methodological difficulty by proposing an alternative approach relying on quality measures. Two entropy measures are exploited for this task: first,
“Personal Entropy”, efficient in former works [2,3,4,5,6] for retrieving meaningful writer cate-gories in terms of verification performance, by using onlygenuinedata; second, a“Relative Entropy”measure here introduced for measuring signature vulnerability to skilled forgeries, computed withboth genuine and impostor data. Next section shows that those measures allow characterizing signatures with regard to their behavior in terms of FRR and FAR, with both the local and global classifiers above presented.
Fig 4. Animals of the Biometric Menagerie hunted with the global classifier.
3. Relating Quality Measures to Verification Performance
For characterizing a writer, we propose on one hand our former Personal Entropy measure [4,6] computed on genuine signatures and, on the other hand a Relative Entropy measure com-puted on both genuine signatures andskilled forgeries. Note that a specific trait of the signature biometrics, as it is behavioral, is that forgeries in the literature are since a long time“skilled”, namely that the impostor tries to match as much as possible the shape or even the dynamics of the target signature.
Our aim in this section is to show that Personal Entropy characterizes a writer in terms of the FRR, while Relative Entropy does the same in terms of atradeoffbetween FRR and FAR.
In the following, we first detail how Personal Entropy and Relative Entropy are computed. In Section 3.2, writer categories are retrieved automatically with each measure. Finally, in Sec-tion 3.3, the behavior of such categories is studied in terms of classifier performance.
3.1. Recalling a Writer
’
s Personal Entropy
As detailed in [4,6], for a given writer, Personal Entropy is measured by means of local density estimation after training a Hidden Markov Model (HMM) [33] on a set ofKgenuine signa-tures. As in our former works, signatures are described only by their raw coordinates(x,y).
A random variableZiis associated to each stationary portionSiof the signature, generated
by the Viterbi algorithm [33] according to the Writer-HMM. The number of portionsNis the number of states of the writer-HMM, computed according to the length of genuine signatures as follows:
N ¼ TTotal
430 ð3Þ
where,TTotalis the total number of sampled points available in the genuine signatures, and
M = 4is the number of Gaussian components per state.
Then, the entropy [28,29] of a portionSiis defined as that of an ensemble of outcomes ofZi,
as follows:
HðZiÞ ¼
X
z2Si
pðzÞlog2pðzÞ ð4Þ
where z corresponds to a given point in the signature described by its coordinates(x,y), belong-ing to the current portionSiaccording to the Writer-HMM.
The local probability distribution function is estimated by using all the sample points belonging to each portion across theKinstances of the writer’s signatures. Then, the entropy of each genuine signature is computed by averaging the local entropy values H(Zi) on all of itsN
portionsSi, and then by normalizing with signing timeTof the genuine signature:
HðZÞ ¼ 1
NT
XN
i¼1
HðZiÞ ð5Þ
Finally, by averaging this measureH(Z)across the writer’sKtraining signatures, we obtain a writer’s Personal Entropy [4,6].
3.2. Measuring a Writer
’
s Relative Entropy
This measure aims at characterizing a writer in terms of the relative behavior existing between his/her genuine signatures and his/her skilled forgeries.
For computing Personal Entropy, the local density is estimated after training an HMM only on a set of genuine signatures. Now, for computing Relative Entropy, we usetwo Writer-HMMs: one for estimating local probability density functions (PDFs) of genuine data, and the second for estimating local PDFs of skilled forgeries. The number of states of the two HMMs is not the same since each one depends on the average length of their associated training signa-tures (Eq 3).
In other words, for each writer, we build a Writer-HMM withKgenuine signatures and a Writer-HMM withKskilled forgeries. Then, we compute the symmetric version of Kullback-Leibler distance [28] for such a writer considering his/herKgenuine signatures andKskilled forgeries as well. On each genuine signatureiand on each skilled forgeryj, we compute:
Dgeniðp;qÞ ¼ 1
2 X
z2geni
pðzÞlog2
pðzÞ
qðzÞþ X
z2geni
qðzÞlog2
qðzÞ
pðzÞ
" #
ð6Þ
Dskjðp;qÞ ¼ 1
2 X
z2skj
pðzÞlog2
pðzÞ
qðzÞþ X
z2skj
qðzÞlog2
qðzÞ
pðzÞ 2
4
3
5 ð7Þ
wherep(z) is the local probability density value on pointz= (x,y) belonging to the current por-tion according to the Writer-HMM of genuine signatures;q(z)is the local probability density value on pointz= (x,y) belonging to the current portion according to the Writer-HMM of skilled forgeries. Both summations are carried out on all points of respectively theithgenuine signaturegeniand thejthskilled forgeryskj.
Then, we average separatelyDgeniðp;qÞacross theKgenuine signatures of the writer being
considered andDskjðp;qÞacross his/herKskilled forgeries:
Dgenðp;qÞ ¼ 1
K
XK
i¼1
Dgeniðp;qÞ ð8Þ
Dskðp;qÞ ¼ 1
K
XK
j¼1
Dskjðp;qÞ ð9Þ
Finally, we average both values of Eqs8and9with a simple mean rule:
Dðp;qÞ ¼ 1
2 Dgenðp;qÞ þDskðp;qÞ
h i
ð10Þ
Relative Entropy therefore measures for a given writer the Kullback-Leibler distance between the local probability laws of his/her genuine signaturespand that of his/her skilled forgeriesq:for a given writer,the lower such a distance,the more such writer’s signatures are vulnerable to skilled forgeries.
3.3. Writer categories and verification performance
numberkof categories (seeS1 Appendix). Indeed, different validity indices [39,40,41], consid-ered as tools for evaluating quantitatively the results of the clustering algorithm, show that
k= 3 is the optimal number of categories.
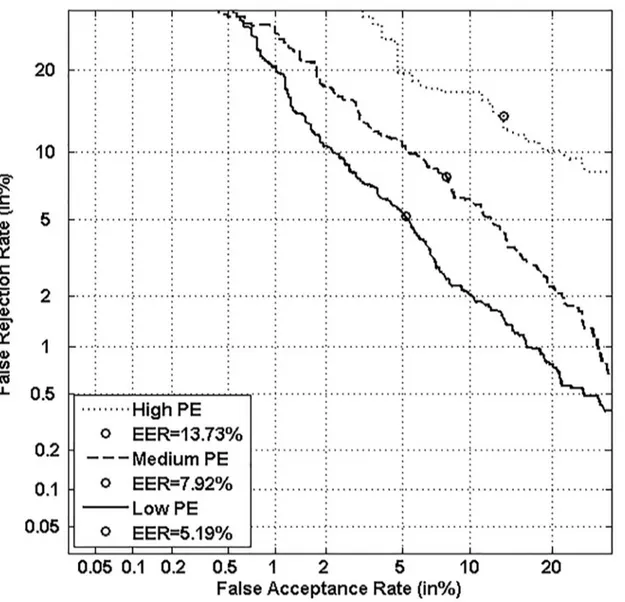
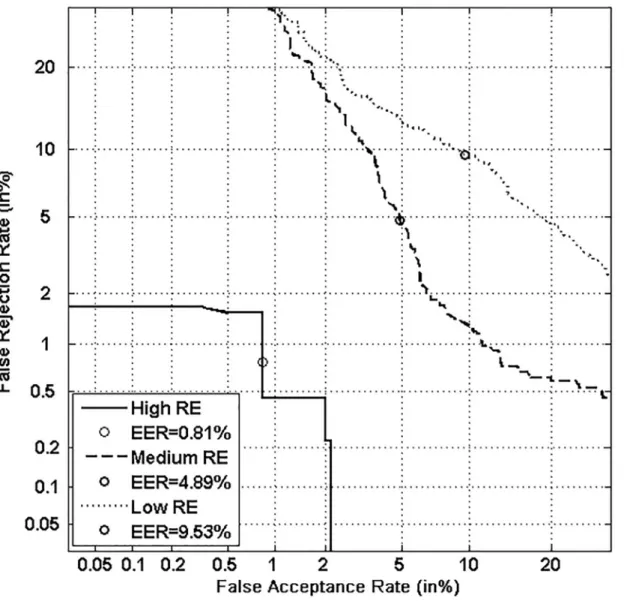
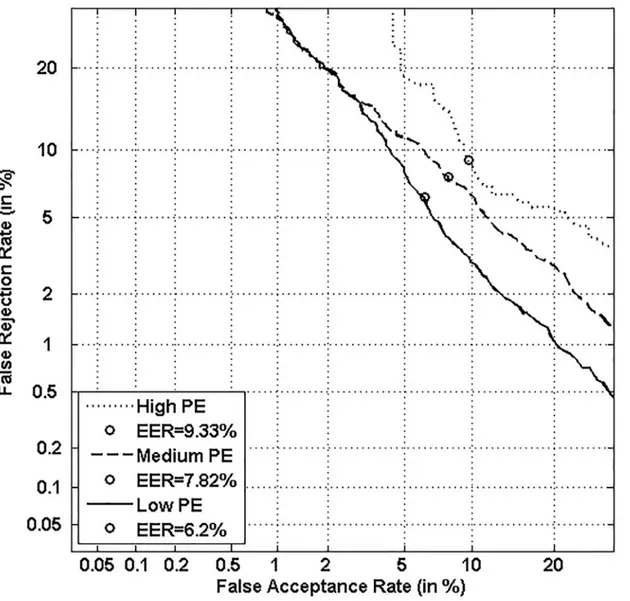
Figs5,6,7and8respectively show verification performance obtained with the local classi-fier (Figs5and6) and the global classifier (Figs7and8), and that on the three categories gener-ated with Personal Entropy and on the other three categories genergener-ated with Relative Entropy.
We first remark that there is a difference in performance between the three writer catego-ries, obtained with each entropy measure. Also, there is a significant difference in performance between the best category obtained with Personal Entropy and the best obtained with Relative Entropy. For the local classifier, Figs5and6show a relative improvement in performance of 91.50% at the EER on the best Relative Entropy category, which contains the least vulnerable signatures, comparatively to the best category generated with Personal Entropy. Improvement is observed not only at the EER but for all functioning points, especially for low values of FAR where FRR values are bounded at a quite low value (less than 2%). In case of the global classifier (Figs7and8), the relative improvement between the two categories is only observed for high values of FAR and of FRR.
Fig 5. Performance of the local classifier on each category of MCYT-100 database generated with Personal Entropy (PE).
These results show that the two entropy measures generate categories containing writers exhibiting different properties. For this reason, we propose in the sequel to exploit such mea-sures for analyzing writer categories of the Biometric Menagerie.
4. Hunting Animals of the Biometric Menagerie with Quality
Measures
This section relates writer categories obtained with the two entropy measures to those of Dod-dington’s Menagerie (Fig 1) and Yager & Dunstone’s Menagerie (Fig 2).
Personal Entropy and Relative Entropy measures do not infer the same properties on writ-ers, as reflected for example in Figs5and6. Personal Entropy characterizes a writer through the local probability distribution of his/her genuine signatures. Therefore, it can be used to infer writer categories according toFRRs. On the other hand, Relative Entropy characterizes a writer in terms of his/her vulnerability to attacks: indeed, it is computed as the Kullback-Leibler distance between the local probability distribution of genuine signatures and that of skilled
Fig 6. Performance of the local classifier on each category of MCYT-100 database generated with Relative Entropy (RE).
forgeries. For this reason, Relative Entropy can be used to infer writer categories in terms of
both FRRs and FARs.
In this work, we exploit both entropy measures in a progressive manner: we start by analyz-ing Doddanalyz-ington’s Menagerie by means of Personal Entropy and Relative Entropy, considering themseparately. Then, in a second step, we consider themsimultaneouslyfor analyzing Yager & Dunstone’s Menagerie.
4.1. Hunting animals of Doddington
’
s Menagerie
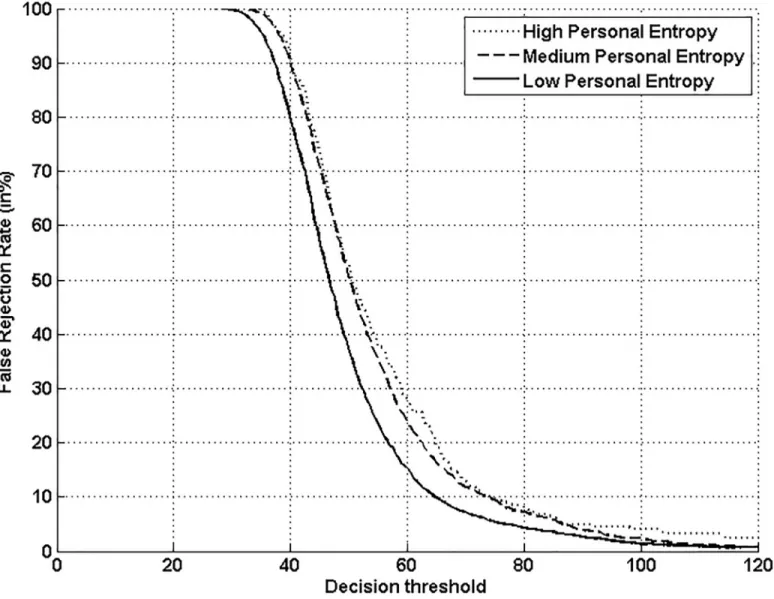
In the following, we analyze on one hand the behavior of Personal Entropy-based categories in terms of FRR (Figs9and10) and on the other hand the behavior of Relative Entropy-based cat-egories in terms of FAR (Figs11and12).
Figs9and10show that the highest FRR is obtained on the highest Personal Entropy cate-gory and the lowest FRR on the lowest Personal Entropy catecate-gory. Finally, the medium Per-sonal Entropy category exhibits FRR in between those of the two extreme categories. For these
Fig 7. Performance of the global classifier on each category of MCYT-100 database generated with Personal Entropy (PE).
reasons, we are able to state thatPersonal Entropy can be exploited for the automatic generation of meaningful writer categories in terms of FRR.
Based on this result, we propose to analyze the relationship between Personal Entropy-based categories and those categories of Doddington’s Menagerie that are only characterized by their average genuine scores:“Goats”and“Sheep”.“Goats”are actually defined as writers showing low genuine scores or accordingly high FRRs; in other words, such writers are difficult to recognize, and thuscorrespond to writers of the highest Personal Entropy category. Some sig-nature samples of such category are displayed inFig 13a. Note that they are not complex enough; moreover, as shown in [3,5,6], those signatures are highly variable. In the literature, such writers are actually considered as being“problematic signers”[25]. On the other hand,
“Sheep”that are defined as writers easy to recognize,correspond to writers of both medium and low Personal Entropy categories(Fig 13b and 13c). These writers lead to a considerably lower FRR with the two classifiers as shown in Figs9and10. Note that signatures of such writers are of higher complexity and also more stable as shown in [4,6].
Fig 8. Performance of the global classifier on each category of MCYT-100 database generated with Relative Entropy (RE).
Finally,“Lambs”that are defined as writers that are easy to imitate,correspond to writers of the lowest Relative Entropy category. Indeed, for such writers, the Kullback-Leibler distance between genuine signatures and skilled forgeries is the lowest.Fig 14adisplays signature sam-ples of lowest Relative Entropy: such signatures are of lower complexity compared to the other categories shown inFig 14b and 14c. Figs11and12confirm that such writers exhibit a higher FAR with the two classifiers, for most values of the decision threshold, especially when com-pared to the highest Relative Entropy category.
Note that“Wolves”, defined as writers successful at imitating (good forgers), do not appear in our analysis. In all previous works in the literature on the Biometric Menagerie, impostor scores are computed consideringonly“random”forgeriesbecause most databases of physiologi-cal biometrics do not contain forgeries that could be qualified as being“skilled”. This is due to the difficulty of producingskilledattacks in the case of non-behavioral biometrics. This choice of“random”forgeries as the only type of attacks to biometric systems, allows supplying all the necessary information about the forger, since the latter is another client of the biometric
Fig 9. FRR with the local classifier on the three Personal Entropy categories.
system. But this choice on the type of attacks is totallyunrealisticfor the signature biometrics, which is actually challenged since a long time by skilled forgeries. For this reason, in this work, we chose to study the Signature Menagerie considering only thesehigh-level attacks.
4.2. Hunting animals of Yager & Dunstone
’
s Menagerie
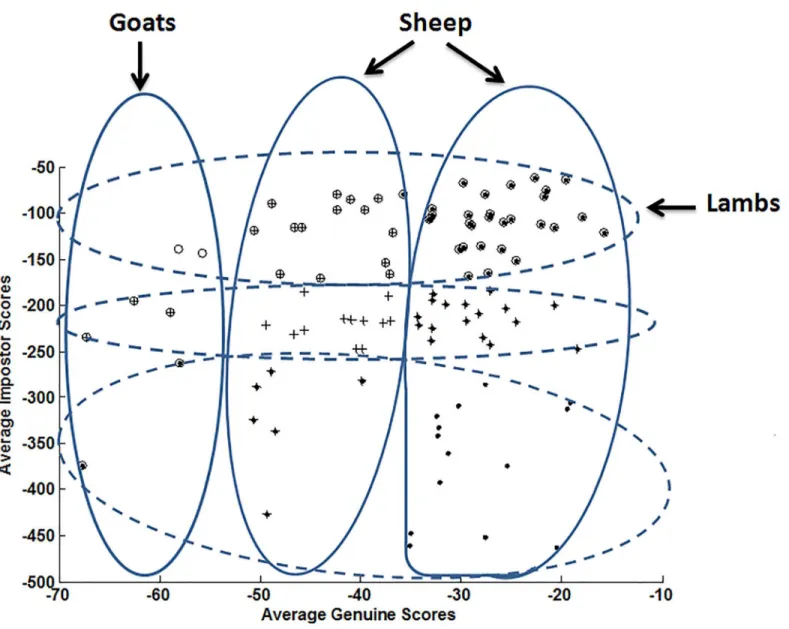
For analyzing the extended Menagerie of Yager & Dunstone [12], we propose to relate Personal Entropy and Relative Entropy by simplyoverlappingthe two obtained automatic categoriza-tions (one per entropy measure) on the same 100 writers of the MCYT-100 database. Indeed, we follow the same methodology used by Yager & Dunstone when defining new groups of ani-mals in terms of arelationshipbetween genuine and impostor scores [12].
Fig 15displays the resulting categories whenoverlappingthe three Personal Entropy-based categories and the three Relative Entropy-based categories. We recall that categories are gener-ated automatically by a clustering procedure and thusFig 15displays theresulting membership
of users to different animal groups. For a better understanding, we also report at the top right
Fig 10. FRR with the global classifier on the three Personal Entropy categories.
corner inFig 15the axis of“Average Genuine Scores”and“Average Impostor Scores”that characterize the graphical representation of the Biometric Menagerie.
Additionally to“Goats”,“Sheep”and“Lambs”already analyzed in Section 4.1, three new sub-categories of Yager & Dunstone’s Menagerie emerge inFig 15:“Worms”,“Chameleons”
and“Doves”.
Let’s start by the two extreme sub-categories, namely“Worms”and“Doves”. On one hand, “Worms”appear as the worst writers as they are difficult to recognize (low genuine scores) and at the same time easy to forge (high impostor scores). Indeed, as shown inFig 15,“Worms”are a sub-category of“Goats”and“Lambs”. In terms of entropy measures,“Worms”have the high-est Personal Entropy and the lowhigh-est Relative Entropy. In MCYT-100 database,“Worms” repre-sent only 5% of writers of the database.
On the other hand,“Doves”are the best writers since they are easy to recognize (high genu-ine scores) and at the same time difficult to forge (low impostor scores), as shown inFig 15. In terms of entropy measures,“Doves”have the lowest Personal Entropy and the highest Relative
Fig 11. FAR with the local classifier on the three Relative Entropy categories.
Entropy. Actually,“Doves”are a sub-category of“Sheep”; they represent 12% of the MCYT-100 database.
Finally,“Chameleons”belonging to the intersection of“Sheep”and“Lambs”are easy to rec-ognize (high genuine scores) and at the same time easy to forge (high impostor scores). In terms of entropy measures,“Chameleons”have the lowest Personal Entropy and the lowest Rel-ative Entropy; they represent 17% of the MCYT-100 database.
The category of“Phantoms”that is a sub-category of“Goats”(low genuine scores and low impostor scores) is empty inFig 15. In other biometrics (iris, face,. . .),“Phantoms”emerge
when there is a failure at the acquisition of enrolment data (non-cooperative user, occlusions in images, dark or blurred images,. . .). In such cases, the poor quality of enrolment data
gener-ates at the matching step the rejection of both client and impostor data (random forgeries). For online signature, any degradation at the acquisition step appears as an intrinsic highly variable signature (case of“Goats”). In this case, contrary to other biometrics, although genuine samples tend to be rejected, a“skilled”forgerymay match the target signature better than a genuine one.
Fig 12. FAR with the global classifier on the three Relative Entropy categories.
Fig 13. Signatures from MCYT-100 database of (a) High, (b) Medium and (c) Low Personal Entropy.
doi:10.1371/journal.pone.0151691.g013
Fig 14. Signatures from MCYT-100 database of (a) Low, (b) Medium and (c) High Relative Entropy.
We have this far obtained all the categories of the Biometric Menagerie with an alternative methodology exploiting quality measures for online signatures. In the following, we pursue our analysis by assessing performancecategory per category(“Goats”,“Sheep”,“Lambs”,“Worms”, “Doves”,“Chameleons”), and that with the local and global classifiers. The focus will be put on
relative performance assessmentbetween categories, and on the stability of results for both types of classifier, which are based ondifferent matching paradigms.
Figs16and17display classifier performance on the three categories of Doddington’s Menagerie, namely“Goats”,“Sheep”and“Lambs”with both classifiers. Figs18and19display classifier performance on the three sub-categories of Yager & Dunstone’s Menagerie, namely
“Worms”,“Doves”and“Chameleons”with both classifiers.
We first observe that“Goats”and“Sheep”respectively give the worst and best performance for all functioning points and that for both classifiers. In case of the local classifier, a relative improvement of 55.71% at the EER is observed between the two categories. Such an improve-ment is of 29.06% for the global classifier. This result is natural since“Sheep”are writers that are easy to characterize while“Goats”are writers that are difficult to characterize [3,4,6].
Fig 15. Yager & Dunstone’s Menagerie by overlapping Personal Entropy and Relative Entropy categories.
Finally,“Lambs”show a performance level in between those of“Sheep”and“Goats”: indeed, as Doddington’s categories are non-exclusive (Fig 1), the category of“Lambs”contains both
“Sheep”and“Goats”, but with a higher percentage of“Sheep”which improves performance for
“Lambs”comparatively to“Goats”.
Concerning the retrieved sub-categories of Yager & Dunstone’s Menagerie (“Doves”,
“Worms”, and“Chameleons”), Figs18and19show that the two extreme categories,“Worms” (the worst writers) and“Doves”(the best writers),respectively give the worst and best perfor-mance for all functioning points and that for both classifiers. In case of the local classifier, a rela-tive improvement of 75% at the EER is observed between such two categories. Such an
improvement is of 29.81% at the EER for the global classifier.
Moreover, when comparing Figs18and19to Figs16and17, we notice as expected that per-formance of the two classifiers is degraded on“Sheep”relatively to that obtained on“Doves”. Finally, classifier performance on“Chameleons”is, as expected, in between those of“Doves”
and“Worms”; indeed,“Chameleons”are easy to recognize as“Doves”, and at the same time easy to forge as“Worms”.
Fig 16. Performance on“Sheep”,“Goats”and“Lambs”with the local classifier.
We have this far shown that our entropy measures allow retrievingautomaticallyanimal groups of the Biometric Menagerie by means of a clustering procedure. Indeed, we confirmed by means of two classifiers, thatthe so obtained categories behave as expected in terms of relative verification performance,according to their description in the Biometric Menagerie[11,12,13].
This study allows concluding that Relative Entropy combined to Personal Entropy may be used as an alternative for retrievingautomatically and directly from genuine and impostor sig-nature samples, writer categories of the Biometric Menagerie.
5. Conclusions and Perspectives
This work tackles for the first time the existence of animal groups of the Biometric Menagerie in the framework of online signature. Up to now, the concept of Biometric Menagerie was illus-trated for other biometrics (speech, iris, fingerprint, face,. . .), and that relying onclassifiers’
average output scores. This fact raises an inherent methodological difficulty pointed out by sev-eral authors [12,13,15,16,17,18,19]:categories of the Menagerie are closely tied to both the matching algorithm and the dataset being used.
Fig 17. Performance on“Sheep”,“Goats”and“Lambs”with the global classifier.
The present work responds to this main issue by proposing an alternative methodology for hunting animals of the Biometric Menagerie. Our proposal is based onquality measures
instead of on a classifier’s output scores. Indeed, quality measures have the main advantage of operating directly onsignature samplesand thus characterize writers independently of their behavior with respect to a specific classifier.
Our main contribution in this paper consists in tying two quality measures for signatures to the existing categories of the Biometric Menagerie: Personal Entropy, already presented in our previous works [2,3,5,6] and Relative Entropy, here introduced.
In this novel context for hunting animals of the Menagerie, wecoupled quality measures to an unsupervised clustering procedure. This approach allows retrievingautomaticallyanimal groups and has the advantage of avoiding the use of thresholds for separating users into categories.
Through a progressive analysis, we first showed that the categories of Doddington’s Menag-erie can be obtained by consideringseparatelyPersonal Entropy and Relative Entropy. Indeed,
Fig 18. Performance on“Worms”,“Doves”and“Chameleons”, with the local classifier.
“Goats”and“Sheep”, defined in Doddington’s Zoo in terms of FRR only [11], can be retrieved with Personal Entropy that operates only ongenuinesignature samples, while“Lambs”defined in terms of FAR only [11], can be retrieved with Relative Entropy that operates onboth genuine and impostorsignature samples.
Then, analogously to Yager & Dunstone’s methodology [12,13], bycombining the two qual-ity measures, we retrieved extra categories of the extended Zoo of Yager & Dunstone (“ Chame-leons”,“Doves”,“Worms”).
Our study showed on the widely used MCYT-100 online signature database, that the major-ity of writers behave as“Sheep”(95% of the database). This result is in perfect accordance with Doddington’s definition of“Sheep”[11]:“Sheep dominate the population”. On the other hand,
“Worms”, defined by Yager & Dunstone as the worst conceivable users of a biometric system [13], represent only 5% of the database. These figures support the use of online signature as a reliable behavioral biometric traitfor most individuals. This result is particularly interesting in the framework of Biometrics since contrary to other modalities, we considered a difficult type of forgeries, namelyskilled forgeries.
Fig 19. Performance on“Worms”,“Doves”and“Chameleons”, with the global classifier.
For a better insight on the meaning of the obtained categories, we also carried outan exten-sive performance analysis on animal groups. To this end, two classifiers based on different matching paradigms (local versus global approaches) were exploited. Our experimental study reveals that the obtained categoriesbehave as expected in terms of relative verification perfor-mance,according to their description in the Biometric Menagerie[11,12,13].
We have this far proved theexistence of the Biometric Menagerie for online signature. Also, our original methodology based on measuring signature quality revealed thatanimal groups exist beyond any classifier that could be used. These new results impact online signature verification since on a given database, animal groups can now potentially be used to compare different signa-ture verification approaches and find out which is the most appropriate for each animal group. Furthermore, our approach could be useful in the framework of signature competitions: on one hand, an analysis could be conducted on the development and test datasets abouthow well user groups are represented; on the other hand, performance should be assessedper category.
Moreover, the proposed Relative Entropy measure presents a great potential in many differ-ent directions:
1. It could be used to rank sets of forgery of different types (static, dynamic, synthetic) in terms of their proximity to the target genuine signatures for a more accurate performance assessment of signature verification systems, for instance in competitions.
2. As these last years, many interesting works on synthetic signature generation have been published, Relative Entropy measure could be exploited for assessing the quality of synthetic signatures. Indeed, it could be a quantitative indicator of how close a set of synthetic signa-tures are to a set of genuine signasigna-tures and that for a given writer.
3. Relative Entropy is based on the statistics of forgery production and thus presents a strong potential for analyzing who are“Wolves”in a population. Indeed, Personal Relative Entropy could be used for characterizing a given forger by estimating the local PdFs of the skilled forgeries that he/she produced.
4. The previous idea could be exploited at the acquisition step of online signature databases for selecting good forgers or even for training forgers to improve themselves.
In the future, we aim at extending our analysis on larger databases, for studying how the dis-tribution of the population into animal groups evolves. This could indeed allow having a com-plete picture of who are the users of online signature verification systems.
Supporting Information
S1 Appendix.
(DOCX)
S1 Fig. The resulting dendrogram of the Hierarchical Clustering procedure on Relative Entropy values.
(TIF)
S2 Fig. Krzanowski-Laï index for each value of (k) number of writer categories.
(TIF)
S3 Fig. C-index for each value of (k) number of writer categories.
(TIF)
S4 Fig. RMSSTD Group indices for each value of (k) number of writer categories.
Author Contributions
Conceived and designed the experiments: NH. Performed the experiments: NH. Analyzed the data: NH. Contributed reagents/materials/analysis tools: NH SG. Wrote the paper: NH SG.
References
1. Jain A, Flynn P, Ross AA. Handbook of Biometrics. Springer-Verlag, US. 2008.
2. Garcia-Salicetti S, Houmani N, Dorizzi B. A Client-entropy Measure for On-line Signatures. In: Proc. IEEE Biometrics Symposium. 2008. 10.1109/BSYM.2008.4655527.
3. Houmani N, Garcia-Salicetti S, Dorizzi B. A Novel Personal Entropy Measure confronted with Online Signature Verification Systems’Performance. In: Proc. IEEE 2ndIntl. Conf. on Biometrics: Theory,
Applications and Systems. 2008. 10.1109/BTAS.2008.4699362.
4. Garcia-Salicetti S, Houmani N, Dorizzi B. A Novel Criterion for Writer Enrolment based on a Time-Nor-malized Signature Sample Entropy Measure. EURASIP Journal on Advances in Signal Processing. Special issue on recent advances in biometric systems: a signal processing perspective. 2009. doi:10. 1155/2009/964746
5. Houmani N. Analyse de la qualité des signatures manuscrites en-ligne par la mesure d’entropie. PhD Thesis n°2011TELE0004. Télécom SudParis. 2011.
6. Houmani N, Garcia-Salicetti S. Quality criteria for on-line handwritten signature. In Signal and Image Processing for Biometric. LN in Electrical Engineering. 2014; 292:255–283. doi: 10.1007/978-3-642-54080-6_10
7. http://www.biosecure.info
8. Ortega-Garcia J, Fierrez J, Alonso-Fernandez F, Galbally J, Freire MR, Gonzalez-Rodriguez J et al. The Multiscenario Multienvironment BioSecure Multimodal Database (BMDB). IEEE Trans. on Pattern Analysis and Machine Intelligence. 2010; 32(6). doi:10.1109/TPAMI.2009.76
9. Houmani N, Mayoue A, Garcia-Salicetti S, Dorizzi B, Khalil MI, Moustafa MN et al. BioSecure Signature Evaluation Campaign (BSEC'2009): Evaluating Online Signature Algorithms Depending on the Quality of Signatures. Pattern Recognition. 2012; 45(3): 993–1003. doi:10.1016/j.patcog.2011.08.008
10. Houmani N, Garcia-Salicetti S, Dorizzi B, Montalvão J, Canuto JC, Andrade MV et al. BioSecure
Signa-ture Evaluation Campaign (ESRA’2011): Evaluating Systems on Quality-based Categories of Skilled Forgeries. In: Proc Int. Joint Conf. on Biometrics. 2011. 10.1109/IJCB.2011.6117487.
11. Doddington G, Liggett W, Martin A, Przybocki M, Reynolds D. Sheeps, Goats, Lambs and Wolves A Statistical Analysis of Speaker Performance in the NIST 1998 Speaker Recognition Evaluation. In: Proc. Int. Conf. on Spoken Language Processing. 1998.
12. Yager N, Dunstone T. The Biometric Menagerie. IEEE Trans. on Pattern Analysis and Machine Intelli-gence. 2010; 32(2). doi:10.1109/TPAMI.2008.291
13. Yager N, Dunstone T. Worms, Chameleons, Phantoms and Doves: New Additions to the Biometric Menagerie. In: Proc. IEEE Workshop on Automatic Identification Advanced Technologies. 2007. 10.1109/AUTOID.2007.380583.
14. Wittman M, Davis P, Flynn P. Empirical Studies of the Existence of the Biometric Menagerie in the FRGC 2.0 Color Image Corpus. In: Proc. IEEE Conf. on Computer Vision and Pattern Recognition Workshop. 2006. 10.1109/CVPRW.2006.71.
15. Poh N, Kittler J. A Methodology for Separating Sheep from Goats for Controlled Enrollment and Multi-modal Fusion. In: Proc. the 6thBiometrics Symposium. 2008; 17–22. 10.1109/BSYM.2008.4655517. 16. Paone J, Flynn P. On the consistency of the biometric menagerie for irises and iris matchers. In: Proc.
IEEE of the Int. Workshop on Information Forensics and Security. 2011; 1–6. 10.1109/ WIFS.2011.6123158.
17. Poh N, Kittler J, Rattani A, Tistarelli M. Group-specific score normalization for biometric systems. IEEE Computer Society Conference on Computer Vision and Pattern Recognition Workshops. 2010; 38–45. 10.1109/CVPRW.2010.5543235.
18. Poh N, Bengio S, Ross A. Revisiting Doddington's Zoo: A Systematic Method to Assess User-depen-dent Variabilities. In: Proc. the 2ndWorkshop on Multimedia User Authentication. 2006.
19. Poh N, Kittler J. Biometric Menagerie Index for Characterizing Template/Model-Specific Variation. In: Proc. the 3rdInt. Conf. on Advances in Biometrics. 2009; 816
–827.
20. Ahmad SMS, Shakil A, Faudzi MA, Anwar RM. Analysis of Goat within user population of an offline sig-nature biometrics. In: Proc. the 10thInt. Conf. on Information Science, Signal Processing and their
21. Islam T, Fairhurst MC. Natural Revocability in Handwritten Signatures to Enhance Biometric Security. In: Proc. Int. Conference on Frontiers in Handwriting Recognition. 2012. 10.1109/ICFHR.2012.240. 22. Alonso-Fernandez F, Fairhurst MC, Fierrez J, Ortega-Garcia J. Automatic measures for predicting
per-formance in off-line signature. In: Proc. IEEE Int. Conf. on Image Processing. 2007; 1: 369–372. 10.1109/ICIP.2007.4378968.
23. Alonso-Fernandez F. Biometric Sample Quality and its Application to Multimodal Authentication Sys-tems. PhD thesis. Universidad Politecnica de Madrid. 2008.
24. Alonso-Fernandez F, Fairhurst MC, Fierrez J, Ortega-Garcia J. Impact of Signature Legibility and Sig-nature Type in Off-Line SigSig-nature Verification. In: Proc. IEEE Biometrics Symposium. 2007; 1–6. 10.1109/BCC.2007.4430548.
25. Brault JJ, Plamondon RA. How to detect problematic signers for Automatic Signature Verification. In Proc. Int. Canadian Conf. on Security Technology. 1989; 127–132. 10.1109/CCST.1989.751966. 26. Brault JJ, Plamondon RA. Complexity Measure of Handwritten Curves: Modeling of Dynamic Signature
Forgery. IEEE Trans on Systems, Man, and Cybernetics. 1993; 23(2): 400–413. doi:10.1109/21. 229453
27. Bouletreau V, Vincent N, Sabourin R, Emptoz H. Handwriting and signature: one or two personality identifiers?. In: Proc. the 14thIntl. Conf. on Pattern Recognition. 1998; 1758
–1760. 10.1109/ ICPR.1998.712067.
28. Cover TM, Thomas JA. Elements of Information Theory. Second Edition. John Wiley & Sons. 2006. 29. Holzinger A, Hörtenhuber M, Mayer C, Bachler M, Wassertheurer S, Pinho AJ, Koslicki D. On
Entropy-Based Data Mining. Interactive Knowledge Discovery and Data Mining in Biomedical Informatics, Eds: Holzinger A, Jurisika I. Series Lecture Notes in Computer Science. 2014; 8401: 209–226. doi:10. 1007/978-3-662-43968-5_12
30. Chen Z, Dehmer M, Shi Y. A note on distance-based graph entropies. Entropy. 2014; 16(10): 5416– 5427. doi:10.3390/e16105416
31. Cao S, Dehmer M, Shi Y. Extremality of degree-based graph entropies. Information Sciences. 2014; 78: 22–23. doi:10.1016/j.ins.2014.03.133
32. Ortega-Garcia J, Fierrez-Aguilar J, Simon D, Gonzalez J, Faundez-Zanuy M, Espinosa V et al. MCYT Baseline Corpus: A Bimodal Biometric Database. IEE Proc. Vision, Image and Signal Processing. Spe-cial Issue on Biometrics on the Internet. 2003; 150(6): 395–401. doi:10.1049/ip-vis:20031078
33. Rabiner L, Juang BH. Fundamentals of Speech Recognition. Prentice Hall Signal Processing Series. 1993.
34. Yeung D, Chang H, Xiong Y, George S, Kashi R, Matsumoto T et al. SVC2004: First International Sig-nature Verification Competition. Int. Conf. on Biometric Authentication. LNCS Springer. 2004; 3072: 16–22. doi:10.1007/978-3-540-25948-0_3
35. Garcia-Salicetti S, Houmani N, Ly-Van B, Dorizzi B, Alonso-Fernandez F, Fierrez J et al. On-line Hand-written Signature Verification. In Guide to Biometric Reference Systems and Performance Evaluation. Eds: Petrovska-Delacrétaz D, Chollet G, Dorizzi B. Publisher Springer-Verlag, London. 2009; 125– 164.
36. Fierrez-Aguilar J, Nanni L, Lopez-Peñalba J, Ortega-Garcia J, Maltoni D. An on-line signature verifica-tion system based on fusion of local and global informaverifica-tion. In: Proc. the 5thIntl. Conf. on Audio- and
Video-based Biometric Person Authentication. Springer LNCS-3546. 2005; 523–532. 10.1007/ 11527923_54.
37. Jain A, Murty MN, Flynn P. Data Clustering data: A Review. ACM Computing Surveys. 1999; 31(3): 264–323.
38. Tan PN, Steinbach M, Kumar V. Introduction to data mining. Pearson Addison Wesley. 2006. 39. Halkidi M, Batistakis Y, Vazirgiannis M. On Clustering Validation Techniques. Intelligent Information
Systems Journal. 2001; 17(2–3): 107–145. doi:10.1023/A:1012801612483
40. Hubert L, Schultz J. Quadratic assignment as a general data-analysis strategy. British Journal of Math-ematical and Statistical Psychology. 1976; 29: 190–241. doi:10.1111/j.2044-8317.1976.tb00714.x
![Fig 1. Doddington ’ s representation of the Biometric Menagerie [11].](https://thumb-eu.123doks.com/thumbv2/123dok_br/18418473.360616/2.918.307.856.118.510/fig-doddington-s-representation-biometric-menagerie.webp)
![Fig 2. Yager & Dunstone ’ s representation of the Biometric Menagerie [12,13].](https://thumb-eu.123doks.com/thumbv2/123dok_br/18418473.360616/3.918.49.813.117.505/fig-yager-amp-dunstone-s-representation-biometric-menagerie.webp)