Immune Cell Functions Associate with Resistance to
Pneumococcal Infection
Magda S. Jonczyk1, Michelle Simon2, Saumya Kumar2, Vitor E. Fernandes1, Nicolas Sylvius3, Ann-Marie Mallon2, Paul Denny2¤, Peter W. Andrew1*
1Department of Infection Immunity and Inflammation, University of Leicester, Leicester, United Kingdom,2MRC Harwell, Mammalian Genetics Unit, Oxford, United Kingdom,3Department of Genetics, University of Leicester, Leicester, United Kingdom
Abstract
Streptococcus pneumoniaeis an important human pathogen responsible for high mortality and morbidity worldwide. The susceptibility to pneumococcal infections is controlled by as yet unknown genetic factors. To elucidate these factors could help to develop new medical treatments and tools to identify those most at risk. In recent years genome wide association studies (GWAS) in mice and humans have proved successful in identification of causal genes involved in many complex diseases for example diabetes, systemic lupus or cholesterol metabolism. In this study a GWAS approach was used to map genetic loci associated with susceptibility to pneumococcal infection in 26 inbred mouse strains. As a result four candidate QTLs were identified on chromosomes 7, 13, 18 and 19. Interestingly, the QTL on chromosome 7 was located withinS. pneumoniae resistance QTL (Spir1) identified previously in a linkage study of BALB/cOlaHsd and CBA/CaOlaHsd F2 intercrosses. We showed that only a limited number of genes encoded within the QTLs carried phenotype-associated polymorphisms (22 genes out of several hundred located within the QTLs). These candidate genes are known to regulate TGFb signalling, smooth muscle and immune cells functions. Interestingly, our pulmonary histopathology and gene expression data demonstrated, lung vasculature plays an important role in resistance to pneumococcal infection. Therefore we concluded that the cumulative effect of these candidate genes on vasculature and immune cells functions as contributory factors in the observed differences in susceptibility to pneumococcal infection. We also propose that TGFb -mediated regulation of fibroblast differentiation plays an important role in development of invasive pneumococcal disease. Gene expression data submitted to the NCBI Gene Expression Omnibus Accession No: GSE49533 SNP data submitted to NCBI dbSNP Short Genetic Variation http://www.ncbi.nlm.nih.gov/projects/SNP/snp_viewTable.cgi?handle = MUS PNEUMONIA.
Citation:Jonczyk MS, Simon M, Kumar S, Fernandes VE, Sylvius N, et al. (2014) Genetic Factors Regulating Lung Vasculature and Immune Cell Functions Associate with Resistance to Pneumococcal Infection. PLoS ONE 9(3): e89831. doi:10.1371/journal.pone.0089831
Editor:Bernard Beall, Centers for Disease Control & Prevention, United States of America
ReceivedAugust 18, 2013;AcceptedJanuary 27, 2014;PublishedMarch 3, 2014
Copyright:ß2014 Jonczyk et al. This is an open-access article distributed under the terms of the Creative Commons Attribution License, which permits unrestricted use, distribution, and reproduction in any medium, provided the original author and source are credited.
Funding:This work was supported by the European Union-funded Pneumopath Project HEALTH-F3-2009-222983. The funders had no role in study design, data collection and analysis, decision to publish, or preparation of the manuscript.
Competing Interests:The authors have declared that no competing interests exist. * E-mail: [email protected]
¤ Current address: Gene Effects, Farnham Common, Buckinghamshire, United Kingdom
Introduction
Streptococcus pneumoniaeis an important pathogen of humans. It is estimated that pneumococcal diseases cause 5–35% mortality worldwide while less severe pneumococcal infections give rise to high costs of healthcare [1,2]. Numerous reports show that infection, even with a highly virulent pneumococcal strain, may not result in death or severe clinical outcome in all infected individuals [3,4,5,6,7]. This observation suggests there is a genetic component to host susceptibility. However, although the patho-genesis of pneumococcal disease and determinants of pneumo-coccal virulence are quite well described [8,9,10,11,12,13,14,15], little is known about the genetic aspects of host susceptibility. Identification of the host factors important in resistance or susceptibility to pneumococci could help develop new biomarkers, find novel drug targets and improve our knowledge about the disease and recovery.
Attempts to characterize the genetic factors in pneumococcal pneumonia susceptibility in humans have predominantly taken a candidate gene approach and been limited to a small number of pneumonia cases [16,17,18,19,20]. Unfortunately, the candidate gene approach precludes identification of new genes involved in the disease. Furthermore, while studying a human population a range of factors other than host genetic background can affect the power of disease associations. For example, misdiagnosis of the cases, as well as a number of confounding factors affecting the phenotype, such as previous exposures, lifestyle or medical treatment, can significantly increase noise in the data.
(predominantly in lungs) at different stages of the disease [3,6,8,9,21,22]. Although these studies delivered much useful information, they have no power to explain what genetic components are responsible for observed phenotypic differences.
Previously we undertook mapping of the disease susceptibility loci using BALB/c and CBA/Ca crosses and a S. pneumoniae infection resistance QTL 1 (Spir1) was identified on proximal chromosome 7 [23]. The locus spans a 7cM region encompassing too many genes to easily hypothesise a candidate.
A huge drawback in linkage analysis is its low mapping resolution that rarely leads to gene discovery. Additionally, a genetic effect of the QTL may be attributed to the combined effect of several physically linked genetic elements and can be disrupted during an attempt to narrow the QTL [24,25,26,27,28]. Therefore, linkage analysis can benefit hugely from Genome Wide Association studies (GWAS), which attains high mapping resolution [29,30]. Recently GWAS studies in humans proved to be very successful in identification of causal genes involved in common diseases such as diabetes, HDL- and LDL-cholesterol regulation, systemic lupus or Crohn disease [31]. Nevertheless, the GWAS in humans remain very expensive, require tens of thousands of subjects and a huge bioinformatics effort [32]. In comparison, studies in mice can successfully identify disease associations using a fraction of these resources [24,27]. They are also highly reproducible and benefit from availability of excellent mouse models for further functional characterisation of candidate genes [24,33,34].
Currently the Jackson Laboratory (JAX) holds the largest repository of mouse strains (JAX-mouse strains). It offers a wide range of inbred, mutant and genetically engineered mouse strains for which the dense genotyping data and other relevant information are freely available. Recently 17 of the inbred mouse strains from the Jackson Laboratory have been fully sequenced by the Sanger Institute [35]. All these advances in mouse genetics make the mouse increasingly attractive for the genetic dissection of complex traits.
In this study a panel of inbred JAX-mouse strains was evaluated for their susceptibility to infection with pneumococci. Collected phenotype data were then analysed by Efficient Mixed Model Association (EMMA) and Haplotype Association Mapping (HAM) to identify susceptibility loci. The complete sequences within the identified disease QTLs were then examined to narrow the number of candidate genes to those carrying the phenotype-specific polymorphism. Comparative analysis of the pulmonary gene expression in resistant and susceptible mouse strains was also used to support hypotheses of candidate genes and pathways. This approach identified three putative novel susceptibility QTLs, significantly narrowed the previously identified Spir1 locus [23] and selected a small number of gene candidates for further hypotheses.
Our results indicate an important role of lung vasculature remodelling and immune cell regulation in the resistance to pneumococcal infection. We demonstrated that a prominent feature associated with the resistance was lung perivascular area free from cellular infiltrates. Subsequently we discussed the possible role of lung fibroblasts and/or smooth muscle cells in the resistance to pneumococcal infections. We also hypothesize a role of candidate genes in regulation of the TGFbpathway and the vascular and immune cell functions in relation to the resistance to pneumococcal infection.
Results
Differences in susceptibility to pneumococcal infection in inbred mouse strains
Variation in susceptibility to pneumococcal infection was examined in 26 inbred JAX-mouse strains and the two Harlan strains, BALB/cOlaHsd and CBA/CaOlaHsd previously used in a linkage study of S. pneumoniae susceptibility [23]. Mice were infected intranasally withS. pneumoniaestrain D39 and observed for 168 h (7 days), after which time each mouse that was alive was considered to have survived the infection. The shortest survival time was 21 h (LP/J) and the longest (for non-survivors) was 154 h (A/J) and the average survival time (excluding survivors) was 49 h. 32% of all tested animals survived infection but among the tested mouse strains the survival rate ranged from 100% to 0%. Survival differed significantly (p,0.001) between the mouse strains as measured by the time (hours) animal survived post-infection (Table 1). The susceptible mouse strains differed significantly in their survival from the resistant strains (p,0.0001) and there was a group of mouse strains, classified as intermediate, that differed from none of the tested strains or only from the strains representing the most extreme phenotype within the resistant or susceptible group of mice (p-value between 0.05–0.01). The resistant strains had a survival rate of 70%–100%, the susceptible 0%–20%, and the intermediate 30%–50%, (Table 1).
The bacterial load in tissues at the time of death was highly correlated with the survival time (h) with Pearson R2= 0.83 and R2= 0.87 for bacterial counts in lung and blood respectively. The level of bacteraemia at 24 h post-infection showed a lower correlation with the survival, with R2= 0.7. Interestingly, we
found that the intermediate strain, C58/J, with a 50% survival rate, had a very high bacterial load in the lungs at the time of death and all survivors had bacteria present in their lungs at the end of the experiment (Fig. 1C). Furthermore, the susceptible strain, SEA/GnJ, showed low bacterial counts in the blood at 24 h post infection, but nevertheless all animals died in less than 3 days. In contrast, the intermediate strains, DBA/1J and DBA/2J, despite the high 24 h bacteraemia survived on average 84 h and 94 h respectively, and had a 30%–40% survival rate (Fig. 1A, Table 1).
Genetic susceptibility toS. pneumoniaeinfection is associated with mouse chromosomes 7, 13, 18 and 19
The survival time of the 26 inbred JAX-mouse strains were used to map candidate pneumonia susceptibility loci using two statistical approaches: the Efficient Mixed Model Associations (EMMA) and the Haplotype Association Mapping (HAM). The EMMA mapping was done using the EMMA server and the HAM mapping was done using PLINK software. Two SNP panels (132K and 4Mil) and data for individual mouse were used in the EMMA mapping. The P value was calculated for each SNP in the panels and the SNPs with a P value below 561028 were considered
significant. For the HAM model the 132K SNP panel and the average survival time were used and the P value cut-off for an inferred haplotype was 1025. The QTL interval was defined as a region containing SNPs or haplotypes that passed the significance threshold plus 1 Mb upstream or downstream of this region.
resistance 1 QTL (Spir1) identified during linkage analysis of progeny of crosses between CBA/CaOlaHsd and BALB/cOlaHsd [23]. The Spir1 locus spans 7 cM and the GWAS analysis helped narrow this locus from 13 Mb (24 Mb–37 Mb) to 2.6 Mb (28.7 Mb–31.3 Mb).
The phenotype-associated SNPs were detected within 22 genes and intergenic regions
The SNPs that passed the genome-wide significance threshold (p,561028) in the EMMA mapping, using the 4Mil SNP panel, were then extracted and the nucleotide variant at the selected SNP position was examined in the tested panel of 26 inbred JAX-mouse strains and in the two Harlan strains (CBA/CaOlaHsd and BALB/cOlaHsd). There were 17 significant SNPs within the QTL on chromosome 7, seven of them within coding sequences for Ryr1,RasGRP4andSpint2and two SNPs within regions annotated as regulatory by the Mouse Phenome Database (Table S1). Four significant SNPs were located within the QTL on chromosomes 13 (withinNtrk2gene) and five significant SNPs within the QTL on chromosome 18 (intergenic, upstream ofSmad4gene) (Table S1).
The QTL on chromosome 19 had the highest number of significant SNPs, 169, including 79 SNPs located within five proteins:Stambpl1,Acta2,Fas,Slc16a12andKif20b(Table S1).
Comparison of the significant SNP variants between the tested mouse strains showed a clear separation of the resistant strains from the others (Table S1), although at some of the positions within the QTLs on chromosomes 18 and 19 a few intermediate mouse strains displayed a SNP variant associated with resistance (for example, C58/J, MA/MyJ and NOD/ShiLtJ within chro-mosome 18 and C57BLKS/J, C57L/J and C58/J within QTL on chromosome 19). Furthermore, in case of two resistant strains: A/J and C57BR/cdJ some of the of SNPs within the QTL on chromosome 7 displayed a susceptible variant. The later strain also displayed a susceptible SNP pattern within the QTL on chromosome 13 (Table S1).
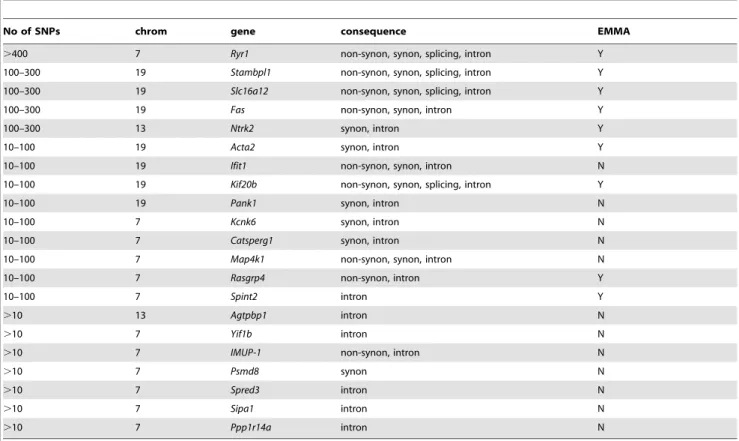
A comprehensive analysis of the phenotype-associated SNP variation within the candidate QTLs was also done for the mouse strains for which the complete sequence data are available. Among these strains four represented resistant strains (BALB/cJ, A/J, FVB/NJ and BALB/cOlaHsd), five susceptible strains (LP/J, C3H/HeJ, 129S1/SvImJ, CBA/J and CBA/CaOlaHsd) and four strains with intermediate phenotypes (AKR/J, NOD/ShiLtJ, DBA/2J, and C57BL/6J). In this approach a SNP was classified as phenotype-associated if it was shared exclusively by all the mouse strains representing a given phenotype (i.e. resistant, susceptible or intermediate). Only SNPs differentiating resistant mouse strains from both susceptible and intermediate strains were identified in this analysis. No SNPs were found associated only with susceptible or only with an intermediate phenotype. The resistance phenotype-associated SNPs were located within the intergenic regions and the nine genes (Ryr1, RasGRP4, Spint2, Ntrk2, Stambpl1, Acta2, Fas, Slc16a12 and Kif20b) previously identified by EMMA and described above, but phenotype-associated SNPs also were found in a further 13 genes (Table 3). However, these newly identified 13 genes displayed a lower number of phenotype-associated SNPs than the genes identified during the EMMA mapping (Table 3).
The largest number of phenotype-associated SNPs was found within theRyr1gene (over 400), including SNPs causing amino acid change or substitutions within a splicing site (Table 4). The highest number of phenotype-associated amino acid changes was found within the Map4k1sequence. There were a further eight genes identified with phenotype-associated amino acid changes (Table 4). The PROVEAN score for each of the detected non-synonymous alterations did not indicate any highly deleterious effect for the tested proteins, with the lowest PROVEAN score of 20.87 and20.74 for RasGRP4 and FAS respectively (Table 4). Interestingly, the QTL on chromosome 18 was the only one for which the phenotype-associated SNPs were found exclusively within an intergenic region, namely between theDccand Smad4 genes. Two more members of the SMAD family were found to be encoded by genes near this QTL:Smad2andSmad7. An additional SMAD gene, Smad5, was found located near the QTL on chromosome 13.
The pulmonary transcriptome differed between resistant and susceptible mouse strains during pneumococcal infection
Differences in pulmonary gene expression between highly resistant (BALB/cOlaHsd) and highly susceptible (CBA/CaO-laHsd) mouse strains, during the early stage of pneumococcal infection (6 h post-infection), were then investigated. Gene expression was measured using an Illumina MouseWG-6_V2_0_R3 microarray and result submitted to the NCBI Gene Table 1.Survival of tested inbred mouse strains and disease
phenotype after intranasal infection withS. pneumoniae, D39.
Mouse strain
Mean survival
(h) SE
Survival
rate (%) Group
LP/J 31 3.4 0 susceptible
C3H/HeJ 31 3.7 0 susceptible
NZW/LacJ 40 1.9 0 susceptible
CBA/CaOlaHsd 46 13.7 10 susceptible
129S1/SvImJ 52 13.1 10 susceptible
CBA/J 54 4.1 0 susceptible
SJL/J 54 13.0 10 susceptible
SEA/GnJ 56 4.0 0 susceptible
BTBRT+tf/J 59 11.7 0 susceptible
I/LnJ 59 4.9 0 susceptible
SM/J 69 17.5 20 susceptible
PL/J 75 16.1 20 susceptible
NOD/ShiLtJ 77 16.5 30 intermediate C57BLKS/J 81 21.9 30 intermediate
DBA/1J 84 18.8 30 intermediate
C57L/J 87 17.8 30 intermediate
AKR/J 91 21.1 40 intermediate
DBA/2J 94 20.3 40 intermediate
C57BL/6J 95 20.0 40 intermediate
MA/MyJ 104 21.3 50 intermediate
C57BL/10J 116 18.7 50 intermediate
C58/J 119 16.9 50 intermediate
A/J 140 17.4 70 resistent
FVB/NJ 154 9.2 80 resistent
BALB/cJ 155 12.6 90 resistent
C57BR/cdJ 157 11.3 90 resistent
BALB/cOlaHsd 161 6.7 90 resistent
BALB/cByJ 168 0.0 100 resistent
SE – standard error.
Expression Omnibus, Accession No: GSE49533. The results were then validated by the real time RT-PCR of 15 selected genes. On average, an 81% correlation was observed between the two methods (Table S2). Genes were considered differentially ex-pressed (DEG) if their expression changed at least 50% compared to sham-infected controls and there was a P value of,0.05. As a result, three lists of DEGs were created: BALB/cOlaHsd infected versuscontrol, CBA/CaOlaHsd infectedversuscontrol and control BALB/cOlaHsdversuscontrol CBA/CaOlaHsd. All three lists of DEGs were compared with the list of genes encoded within the QTLs. 30 genes located within the QTLs were differentially expressed in at least at one of the comparisons (Table 5). Five genes with detected phenotype-specific polymorphism were also among the DEGs (Map4k1, Spint2, Fas, Ppp1r14a and Pank1). Interestingly,Smad2located near to the QTL on chromosome 18 was differentially regulated in BALB/cOlaHsd, but not in CBA/ CaOlaHsd, during the infection. Two additional members of the SMAD family:Smad1andSmad6were also differentially expressed during the disease in BALB/cOlaHsd and CBA/CaOlaHsd, respectively (Table 5).
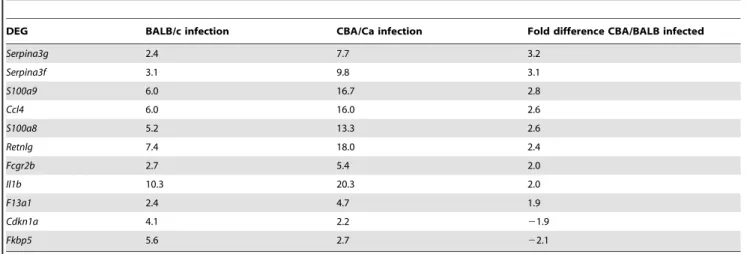
The magnitude of DEGs up-regulation was much higher (about 40-fold change) than that of down-regulation (about 3-fold change) (Fig. 2). Approximately a half of the DEGs were found to be uniquely associated with the infection of only one of the tested mouse strains, either BALB/cOlaHsd or CBA/CaOlaHsd (Fig. 3). Interestingly, though, the magnitude of change of these strain-specific DEGs (uDEGs) was relatively low (up to 4-fold) (Table 6). If the ratio of expression in the two mouse strains of the most highly up-regulated genes (above 4-fold change during infection) was calculated BALB/cOlaHsd and CBA/CaOlaHsd differed at least 2-fold in the regulation of genes encoding leukocytes chemoattractants and protease inhibitors (Table 7).
The DEGs also were analysed with the web-based DAVID tool, in order to identify pathways in which DEGs were over-represented. Consequently, pathways involved in cell proliferation and differentiation (hematopoietic lineage pathway and p53-signalling) and axon guidance signalling were uniquely associated with the pulmonary transcriptome of the resistant BALB/cOlaHsd mice during the infection (Table 8). Interestingly the hematopoi-etic pathway was also among the most significant pathways when DEGs of control animals (BALB/cOlaHsdversusCBA/CaOlaHsd PBS-treated) were compared (Table 8). The pathways unique for susceptible mice were adipocytokine signalling, natural killer cell mediated cytotoxicity, T-cell receptor signalling and cytosolic DNA-sensing pathway (Table 8). Interestingly majority of these pathways are related to immune cell function. Furthermore,
significant enrichment of genes involved in vasculature remodel-ling and responses to wounding was found in both mouse strains during the infection. The enrichment score for these two clusters was between 8.3 and 10.6, while enrichment scores of any subsequent functional clusters were below 5.5 (Table 9). There was no functional cluster with enrichment score 5 or more for the pulmonary transcriptome of control animals.
Lung histopathology of BALB/cOlaHsd and CBA/ CaOlaHsd mice showed differences in immune cells recruitment
Examination of lung histopathology showed that about 30% of perivascular areas of resistant BALB/cOlaHsd and almost 80% of susceptible CBA/CaOlaHsd mice were affected by cellular infiltration at 24 h post-infection and this difference was statisti-cally significant. However the difference between both mouse strains was not observed at 6 h post-infection when about 30%– 40% of perivascular areas of both CBA/CaOlaHsd and BALB/ cOlaHsd were affected by cellular infiltrates (Fig. 4). Interestingly, the perivascular areas of resistant BALB/cOlaHsd mice were largely unaffected by immune cells infiltration even though considerable inflammation was present within the lung parenchy-ma. In contrast, the susceptible CBA/CaOlaHsd mice had substantial accumulation of immune cells within perivascular areas, even when no visible infiltration was observed within alveolar space (Fig. 5).
Discussion
Pneumococcal infections can lead to a high mortality and morbidity in humans. While substantial effort has been made to understand the pneumococcal attributes that explain this situation, almost nothing has been done to explain the fact that individuals vary in their innate susceptibility to these infections. Identification of the host factors explaining innate resistance or susceptibility would help development of alternative, host-directed therapies and screening tests to identify individuals at risk. In the present study we aimed to identify host factors determining resistance to pneumococcal infection, using mouse models of pneumonia and bacteraemia. We phenotyped a panel of genetically defined inbred mouse strains for their resistance to pneumococcal infection and looked for association between the host genetic background and disease phenotype. Furthermore we analysed differences in gene expression and lung pathology between two mouse strains representing opposite disease phenotypes (susceptible CBA/ CaOlaHsd versus resistant BALB/cOlaHsd).
Figure 1. Bacterial counts in tissues of the tested inbred mice after intranasal-infection withS. pneumoniae, D39.Strains are ordered by increasing mean survival time post-infection. A) Bacterial count in blood 24 h post-infection B) Bacterial count in blood at the time of death C) Bacterial count in lungs at the time of death. Results are for a group of 10 animals. Error bar shows standard error (SE).
doi:10.1371/journal.pone.0089831.g001
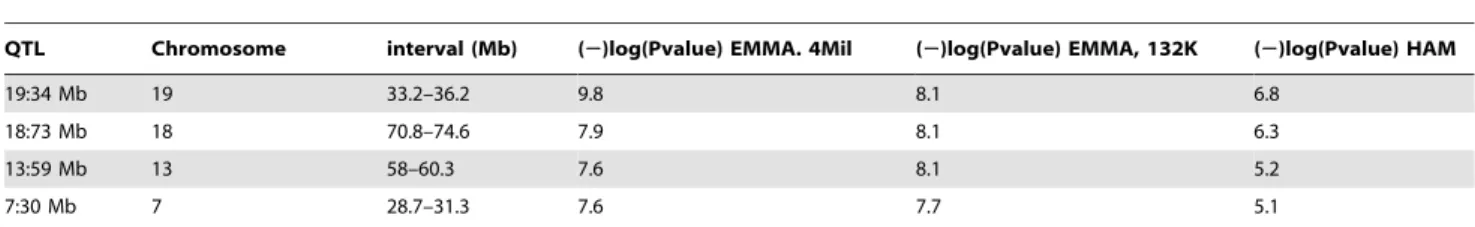
Table 2.S. pneumoniaeresistance QTLs identified by genome wide mapping from EMMA and HAM mapping using survival data (h).
QTL Chromosome interval (Mb) (2)log(Pvalue) EMMA. 4Mil (2)log(Pvalue) EMMA, 132K (2)log(Pvalue) HAM
19:34 Mb 19 33.2–36.2 9.8 8.1 6.8
18:73 Mb 18 70.8–74.6 7.9 8.1 6.3
13:59 Mb 13 58–60.3 7.6 8.1 5.2
7:30 Mb 7 28.7–31.3 7.6 7.7 5.1
Table 4.Phenotype-specific genetic polymorphisms withinS. pneumoniaeresistance QTLs leading to amino acid change or alteration within the splicing site.
Amino acid change Splicing site
Gene name Chrom SNP_ID change: R.S PROVEAN score SNP_ID or position nt change: R.S
Map4k1 7 rs31155356 R.C 0.329 rs31836292 I.V 20.328
rs31836292 I.V 20.328
Ryr1 7 rs51295578 S.A 20.383 29832579 A.G
29842146 T.G
rs48602222 G.A
Stambpl1 19 rs30934349 M.I 0.156 rs30754595 C.T rs30525805 N.S 0.04
Slc16a12 19 rs46173389 T.C 20.011 34749291 C.A
Fas 19 rs30844760 H.R 20.738
Ifit1 19 rs50377880 V.I 0.387
Kif20b 19 rs13483601 E.G 1.586 rs30751713 A.G
Rasgrp4 7 rs45673726 I.M 20.872 IMUP-1 7 rs32347251 K.M 2.833
change: R.S – amino acid or nucleotide change, resistant (R)versussusceptible (S) variant. doi:10.1371/journal.pone.0089831.t004
Table 3.Phenotype-specific genetic polymorphisms withinS. pneumoniaeresistance QTLs.
No of SNPs chrom gene consequence EMMA
.400 7 Ryr1 non-synon, synon, splicing, intron Y
100–300 19 Stambpl1 non-synon, synon, splicing, intron Y
100–300 19 Slc16a12 non-synon, synon, splicing, intron Y
100–300 19 Fas non-synon, synon, intron Y
100–300 13 Ntrk2 synon, intron Y
10–100 19 Acta2 synon, intron Y
10–100 19 Ifit1 non-synon, synon, intron N
10–100 19 Kif20b non-synon, synon, splicing, intron Y
10–100 19 Pank1 synon, intron N
10–100 7 Kcnk6 synon, intron N
10–100 7 Catsperg1 synon, intron N
10–100 7 Map4k1 non-synon, synon, intron N
10–100 7 Rasgrp4 non-synon, intron Y
10–100 7 Spint2 intron Y
.10 13 Agtpbp1 intron N
.10 7 Yif1b intron N
.10 7 IMUP-1 non-synon, intron N
.10 7 Psmd8 synon N
.10 7 Spred3 intron N
.10 7 Sipa1 intron N
.10 7 Ppp1r14a intron N
The number of phenotype-associated polymorphisms within the coding region of the QTLs and their consequences. The presented number of SNPs includes the SNPs identified in the EMMA mapping and in the analyses of the full-length sequences within the disease QTLs. No of SNPs– number of phenotype-associated SNPs identified within the gene; Chrom – chromosome, non-synon – SNP causing amino acid change, synon – SNP causing silent mutation, intron – SNP within intron, splicing – SNP within splicing site of the gene. EMMA – indicates whether the genome-wide significant SNPs (p-value,561028) were identified within the gene during the EMMA
mapping: Y-yes, N-no.
The tested panel of inbred mouse strains displayed variable disease phenotypes, ranging from death to complete resistance. The time that animal survived the infection (survival) was used to map pneumococcal pneumonia susceptibility/resistance loci and four candidate QTLs on chromosomes 7, 13, 18 and 19 were identified. It is noteworthy that the candidate QTL on chromo-some 7 is located within theS. pneumoniaeresistance QTL 1 (Spir1), identified by our previous linkage analysis of BALB/cOlaHsd (refer thereafter as BALB/c) and CBA/CaOlaHsd crosses (refer thereafter as CBA/Ca) [23]. Subsequently, the GWAS mapping
helped to narrow down theSpir1locus from 13 Mb to 2.6 Mb. The most statistically significant SNPs identified by EMMA were located within nine genes, or in intergenic regions, and were able to differentiate the resistant from the susceptible mouse strains, therefore they were regarded as specific (or phenotype-associated).
We took advantage of the availability of the full nucleotide sequences of thirteen of the tested inbred stains [35] to search for the genes or intergenic regions, carrying potential causal variants. This approach was possible because within the subset of the Table 5.Differentially expressed genes (DEGs) within candidate susceptibility QTL between mice intranasally infected withS. pneumoniae, D39 and control animals.
Chrom QTL QTL interval (Mb) Gene name
BALB/c infection
CBA/Ca infection
BALB/CBA controls
BALB/CBA infection
7 7:30 Mb 28.7–31.3 Dmkn 1.6 2.4 22.4
7 7:30 Mb 28.7–31.3 Ffar2 3.1 4.4
7 7:30 Mb 28.7–31.3 Fxyd3 1.6 21.9
7 7:30 Mb 28.7–31.3 Hcst 1.6 1.6
7 7:30 Mb 28.7–31.3 Nfkbib 2
7 7:30 Mb 28.7–31.3 Nfkbid 2.8 3.3
7 7:30 Mb 28.7–31.3 Ppp1r14a 21.5 1.8
7 7:30 Mb 28.7–31.3 Tyrobp 1.8 1.8
7 7:30 Mb 28.7–31.3 Zfp260 21.5 2.2 1.5
13 13:59 Mb 58–60.3 Isca1 21.5
18 18:74 Mb 70.8–74.6 Mbd1 3.1 2.9 21.9
19 19:34 Mb 33.2–36.2 Ankrd1 2 1.9 22.3 22.5
19 19:34 Mb 33.2–36.2 Ch25h 7.2 5.7 21.5 21.7
19 19:34 Mb 33.2–36.2 Fas 2.8 2.3 21.5
19 19:34 Mb 33.2–36.2 Ifit3 21.5 21.6 21.6
19 19:34 Mb 33.2–36.2 Pank1 21.8 21.6 22.5
7 7:30 Mb 28.7–31.3 Capns1 21.9
7 7:30 Mb 28.7–31.3 Cd22 5.9 5.2
7 7:30 Mb 28.7–31.3 Cox7a1 2
7 7:30 Mb 28.7–31.3 Lsr 22.2
7 7:30 Mb 28.7–31.3 Map4k1 1.8
7 7:30 Mb 28.7–31.3 Mrps12 22.9 23.2
7 7:30 Mb 28.7–31.3 Psmd8 210.5 28.1
7 7:30 Mb 28.7–31.3 Spint2 21.6
7 7:30 Mb 28.7–31.3 Zbtb32 2.6 3.1
7 7:30 Mb 28.7–31.3 Zfp27 22.4 22
7 7:30 Mb 28.7–31.3 Zfp30 2.5 2.5
7 7:30 Mb 28.7–31.3 Rasgrp4 22.5
7 7:30 Mb 28.7–31.3 Hspb6 21.6
7 7:30 Mb 28.7–31.3 Zfp383 22
13 13:59 Mb 58–60.3 Ubqln1 21.9
18 18:74 Mb 70.8–74.6 Elac1 2.2 2.1
18 18:74 Mb 70.8–74.6 Me2 23 22.2
18 18:74 Mb 70.8–74.6 Smad2 21.5 21.8 23
8 N/A N/A Smad1 1.8
9 N/A N/A Smad6 21.8
Pulmonary gene expression 6 h post-infection is represented as fold change between infected and non-infected animals (BALB/c infection: BALB/c-infectedversus PBS-treated, CBA/Ca infection: CBA/Ca infectedversusPBS-treated), between PBS-treated control animals (BALB/CBA: BALB/cversusCBA/Ca PBS-treated) and between infected BALB/c and infected CBA/Ca (BALB/CBA infection). Chrom. - chromosome.
sequenced inbred strains, the resistant, susceptible and interme-diate disease phenotypes were matched in numbers. The analysis resulted in identification of further phenotype-specific SNPs within the nine genes selected by the association analysis, but additionally found thirteen other candidate genes within the QTLs. Among these candidate genes was a member of a solute carrier transporter family:Slc16a12. A large number of phenotype-associated SNPs were identified within this gene, some of them leading to a change within the amino acid sequence and the splicing site. This is worth mentioning because one of the best-known genetic factors influencing susceptibility to bacterial infection is a solute carrier transporter,Slc11a1(also known asNramp1) [36,37]. TheSlc11a1 gene was not associated with pneumococcal disease in our GWAS but finding another member of the same family associated with resistance to pneumococcal infection may suggest a broader role of the solute carrier transporters during bacterial infection. The transporter associated with pneumococcal disease, Slc16a12, belongs to the monocarboxylate transporters [38]. Monocarbox-ylates, such as lactate, pyruvate or ketones, are important elements of several metabolic pathways and therefore their availability to pneumococci could be crucial for bacterial survival and virulence within the host.
However, the susceptibility to complex diseases such as infectious diseases, most likely depends on networks of genes, with additive genetic effects, or on groups of proteins forming interacting networks [24,28]. Indeed, previous reports show that altered genes underlying disease susceptibility were frequently clustered within the same or related pathways [39,40]. Therefore the discovery of multiple candidate genes and QTLs involved in the susceptibility to pneumococcal pneumonia initiated our
investigation into common aspects of the candidate genes, such as signalling pathways, functional similarities or tissue-specificity.
The presence of a cluster of genes encoding members of the SMAD family within or nearby two of the disease QTLs (Smad4, Smad2andSmad7on chromosome 18 andSmad5on chromosome 13) focused our attention on the TGFbpathway, in which SMAD proteins are key factors [41,42]. As well as the SMAD genes we
Figure 2. Change in gene expression 6 h post-infection of BALB/cOlaHsd (resistant) and CBA/CaOlaHsd (susceptible) with S. pneumoniae, D39. Fold change is represented as compared to control animals (PBS-treated). Only the ten most up-regulated and ten most down-regulated genes are presented.
doi:10.1371/journal.pone.0089831.g002
Figure 3. Number of differentially regulated genes (DEGs) during infection with S. pneumoniae, D39. The included genes show fold change in expression $1.5 and change is significant at p#0.05. The total number of BALB/cOlaHsd (resistant) and CBA/ CaOlaHsd (susceptible) DEGs is indicated below the strain number and amount of commonly and uniquely regulated genes is indicated within the Venn diagram.
doi:10.1371/journal.pone.0089831.g003
Table 6.Differentially expressed genes unique (uDEGs) in either BALB/cOlaHsd (resistant) or CBA/CaOlaHsd (susceptible) after intranasal-infection withS. pneumoniae, D39.
BALB/c CBA/Ca
uDEG FOLD PVALUE FOLD PVALUE
Egr1 4.1 1.00E-04
Plek 3.0 8.10E-03
Srgn 3.0 1.90E-03
Nol5 2.9 4.00E-04
Fos 2.7 1.00E-04
Ptpn22 2.6 1.00E-04
Cyp7b1 2.5 1.90E-03
Iigp2 2.4 1.40E-03
Abcb1b 2.4 1.60E-03
Igtp 2.3 7.30E-03
Kif1b 22.0 8.00E-04
Bcl9l 22.1 1.00E-04
Ehd4 22.1 1.75E-02
Nrp 22.2 1.36E-02
Cidec 22.2 3.60E-03
Gdf10 22.2 9.00E-04 Krtap17-1 22.3 3.00E-04
Sox7 22.4 1.00E-04
Kif1b 22.4 1.00E-04
Kcnk2 22.4 1.50E-03
Expression is represented as fold change (infected animals versus PBS-treated). Only the five most up-regulated and the five most down-regulated uDEGs are presented for each strain.
found two other candidate genes with extensive phenotype-specific polymorphism that are associated with the TGFb pathway: Stambpl1 and Acta2 (both within the QTL on chromosome 19). The former gene encodes the STAM binding protein-like 1 that interacts with SMAD2 and SMAD7 [43] and the later gene
encodes actin smooth muscle, a target gene of TGFb signalling [44,45].
Gene expression analysis showed that Smad2 is significantly down-regulated whileSmad1and the activin receptor geneAcvr1b [43] are up-regulated in the resistant BALB/c mouse during infection, but not in the susceptible CBA/Ca. Interestingly, the Table 7.Differentially expressed genes during intranasal-infection withS. pneumoniae, D39 in both BALB/cOlaHsd and CBA/ CaOlaHsd and showing at least two-fold change difference between the two strains during the infection.
DEG BALB/c infection CBA/Ca infection Fold difference CBA/BALB infected
Serpina3g 2.4 7.7 3.2
Serpina3f 3.1 9.8 3.1
S100a9 6.0 16.7 2.8
Ccl4 6.0 16.0 2.6
S100a8 5.2 13.3 2.6
Retnlg 7.4 18.0 2.4
Fcgr2b 2.7 5.4 2.0
Il1b 10.3 20.3 2.0
F13a1 2.4 4.7 1.9
Cdkn1a 4.1 2.2 21.9
Fkbp5 5.6 2.7 22.1
doi:10.1371/journal.pone.0089831.t007
Table 8.Significantly regulated pathways (KEGG) during infection and differentiating PBS-treated BALB/c and CBA/Ca mice.
KEGG pathway BALB/c CBA/Ca BALB/CBA control
PValue PValue PValue
Cytokine-cytokine receptor interaction 3.92E-07 2.38E-08
Pathways in cancer 2.92E-05 6.33E-07
Toll-like receptor signalling pathway 3.32E-04 1.33E-06 B cell receptor signalling pathway 3.10E-03 4.43E-05
Chemokine signalling pathway 9.02E-03 5.10E-05
MAPK signalling pathway 1.93E-05 1.08E-04
Apoptosis 1.57E-03 1.09E-04
Jak-STAT signalling pathway 1.88E-04 3.02E-03
NOD-like receptor signalling pathway 8.63E-03 5.88E-03
Hematopoietic cell lineage 1.20E-03 4.30E-04
Axon guidance 3.92E-03
p53 signalling pathway 4.33E-03
Adipocytokine signalling pathway 1.56E-04
Natural killer cell mediated cytotoxicity 9.83E-04
T cell receptor signalling pathway 6.06E-03
Cytosolic DNA-sensing pathway 1.05E-02
Antigen processing and presentation 8.79E-05
Allograft rejection 5.73E-04
Autoimmune thyroid disease 1.10E-03
Graft-versus-host disease 2.16E-03
Type I diabetes mellitus 4.05E-03
Cell adhesion molecules (CAMs) 4.95E-03
Systemic lupus erythematosus 8.53E-03
Smad6 and the TGFb superfamily receptor Acvrl1 [46] were significantly down-regulated in susceptible CBA/Ca but not in resistant BALB/c. These observations are in agreement with our previous results that demonstrated an important role of TGFbin resistance to pneumococcal infection [21]. We reported significant differences in the concentrations of TGFbin BALB/c and CBA/ Ca mice and that the higher levels of TGFb found in BALB/c lungs during pneumococcal infection correlated with the increase in the number of T regulatory cells (Treg) in the lungs.
Furthermore we showed that blockade of TGFbwith a synthetic peptide blocked the induction of Treg cells and decreased BALB/c resistance to infection [21].
In addition to influencing certain immune cells, the TGFb -pathway also regulates wound healing, angiogenesis and extracel-lular matrix production via activation of fibroblast differentiation [44]. The results of our study suggested fibroblast activation and functioning might play a role in the resistance to pneumococcal pneumonia. We demonstrated that the marker of fibroblast activation, Acta2, has extensive phenotype-associated polymor-phism. Furthermore, we found that during pneumococcal infection the expression of genes known to regulate transcription of Acta2 differed significantly between resistant and susceptible mice. For example, the candidate geneCh25hencoded within the QTL on chromosome 19 is known to enhanceActa2expression and increase TGFb1 release [47]. We showed that transcription of Ch25h significantly differed between resistant BALB/c and susceptible CBA/Ca during pneumococcal infection and between control animals. Interestingly,Ch25his located near to the cluster of highly significant intergenic SNPs identified by the EMMA. Therefore it would be interesting to know whether the identified polymorphisms within this intergenic region are responsible for observed differences inCh25hexpression. Another example of an Acta2-regulating gene was the early growth response factor 1 (Egr1), up-regulated only by BALB/c during pneumococcal infection. Egr1 is known to inhibit TGFb-mediated Acta2 expression [48].
Fibroblasts are ubiquitous cells, which in normal lungs residue in vascular adventitia and airway wall tissue. Beside their vital role in maintaining tissue structure and integrity, fibroblasts also regulate immune cells trafficking, site-specific accumulation and survival [49,50,51]. Furthermore the phenotypic differences between fibroblasts collected from different tissues or even different locations within the organ are widely reported [52,53,54]. One example of such heterogeneity is human pulmonary fibroblasts [49]. It was demonstrated that the Table 9.Functional annotation clustering of differentially expressed genes during pneumococcal infection of BALB/cOlaHsd and CBA/CaOlaHsd.
BALB/c CBA/Ca
ID Description PValue PValue
GO:0001944 vasculature development 1.50E-11 3.89E-10
GO:0001568 blood vessel development 3.66E-11 2.04E-10
GO:0048514 blood vessel morphogenesis 5.34E-10 1.78E-09
GO:0001525 angiogenesis 1.79E-08 1.36E-07
Annotation Cluster 1 Enrichment Score: 9.6 8.7
GO:0009611 response to wounding 1.71E-09 1.67E-12
GO:0006954 inflammatory response 1.01E-10 4.72E-12
inflammatory response 1.06E-08 2.20E-10
GO:0006952 defense response 4.12E-07 2.35E-10
Annotation Cluster 2 Enrichment Score: 8.3 10.6
GO:0042035 regulation of cytokine biosynthetic process 6.54E-07
GO:0042108 positive regulation of cytokine biosynthetic process 2.81E-06 GO:0043123 positive regulation of I-kappaB kinase/NF-kappaB cascade 2.46E-05
Annotation Cluster 3 Enrichment Score: 5.4
Only clusters with enrichment score above 5 are shown. Information provided: the overall enrichment score for the cluster based on EASE score of each member (Enrichment score), name of annotation (Description) and its GO code (ID) if applicable, p-value for the term (PValue).
doi:10.1371/journal.pone.0089831.t009
Figure 4. Percentage of lung’s blood vessel affected by inflammation within perivascular areas after infection withS. pneumoniae D39. Results are presented for 6 h and 24 h post-infection for BALB/cOlaHsd (black bars) and CBA/CaOlaHsd (open bars), from two independent experiments, with a total of 5 animals per group. ** p,0.001.
fibroblasts residing in the bronchi show higher expression of extracellular matrix (ECM) proteins while the fibroblasts from lung parenchyma display increased TGFbsignalling andActa2 expres-sion. The parenchymal fibroblasts, but not the bronchial ones can rapidly activate endogenous TGFb via tension-mediated mecha-nism [54,55,56]. In the light of the above observations it is particularly interesting to see that the pattern of lung inflammation differs between resistant BALB/c and susceptible CBA/Ca. The cellular infiltrates are located predominantly within lung paren-chyma of BALB/c mice while in CBA/Ca it accumulates within peribronchial and perivascular areas [3,9]. Fibroblasts are activated during tissue injury and they can also recognize pathogen-associated molecular patterns (PAMPs) [47]. Rapid activation of TGFb by parenchymal fibroblasts could explain observed TGFb-mediated increase in Treg population, a feature of BALB/c infection [21]. Considering all the evidence it can be easily envisaged that the differences in the fibroblast phenotypes contributed to the observed differences in the immune cell migration, TGFbavailability and subsequently to the susceptibility to pneumococcal infection.
The large accumulation of immune cells within perivascular areas of CBA/Ca but not BALB/c mice suggests that the vasculature is involved in the resistance. We showed that perivascular areas of resistant BALB/c mice were either unaffected or mildly inflamed, even when massive inflammation within lung parenchyma was observed. The accumulation of leukocytes within perivascular areas could cause damage to the vessel structure and facilitate bacterial dissemination into the blood, which is a feature of infection of CBA/Ca but not of BALB/c mice. The hypothesis that alteration of the vasculature is a key aspect of susceptibility is further supported by analysis of our pulmonary gene expression data that showed one of the most enriched functional gene clusters during the pneumococcal infection is for the remodelling of lung vasculature. Furthermore, we have found a group of candidate genes with identified phenotype-associated polymorphism to be involved in smooth muscle functioning (Ryr1, Kcnk6, Ntrk2, Ppp1r14aandKif20b).Ryr1is a calcium channel [57,58],Kcnk6is a potassium channel [59], Ppp1r14p is a phosphatase inhibitor [60],Ntrk2is a neutrophin receptor [61,62] andKif20bencodes a kinesin [63]. TheNtrk2knock-out mice show significantly reduced blood vessel formation [64] and Kcnk6 knock-out mice show vascular dysfunction [59]. Smooth muscles are a product of fibroblast differentiation and an important component of airways and lung vasculature [65,66,67].
Interestingly, we found that the enrichment of genes belonging to the adipocytokine signalling pathway was unique for the CBA/ Ca pulmonary transcriptome. This is worth noting because the adipocytokines are secreted predominantly by adipose tissue, which in the lung is located within perivascular areas. This perivascular adipose tissue (PVAT) plays an important role in the regulation of vascular structure and homeostasis [65]. It is known that leukocyte infiltration and their oxygen radical production are key factors in PVAT dysfunction, which in turn leads to compromised blood vessel functionality [68]. Thus the accumu-lation of immune cells within perivascular areas of CBA/Ca mice is likely to be affecting PVAT functioning. Consistent with this, we observed that the expression of resistin-like molecule c (Retnlg), which is secreted by adipocytes, was almost 3-fold higher in the susceptible CBA/Ca mice during pneumococcal infection.
PVAT is also an important element of a brain-blood vessel axis because nerve endings are present in the PVAT, enabling neuronal control of vessel function [69]. It is therefore of interest that the genes involved in axon guidance were significantly over-represented in the pulmonary transcriptome of infected BALB/c Figure 5. Inflammation pattern in lungs of BALB/cOlaHsd and
CBA/CaOlaHsd mice after infection with S. pneumoniae, D39. Hematoxylin-and-eosin-stained paraffin wax lung sections from BALB/ cOlaHsd (A, A1–C,C1) and CBA/CaOlaHsd (D,D1–F,F1). Panels A,A1 and D,D1 represent lungs of PBS-treated animals, panels B,B1–C,C1 and E,E1–F,F1 are lung sections at 24 h-post infection. Panels A–F represent magnification 406and panels A1–F1 magnification 2006. Bar indicates 500mm for 406magnification and 100mm for 2006magnification. Black arrows indicate perivascular areas. Yellow arrow in panel F1 indicates perivascular adipose tissue.
mice. We also found that the axon guidance receptor gene Dcc (netrin receptor Dcc) was encoded within the QTL on chromo-some 18, in direct proximity of the cluster of highly significant intergenic SNPs. In addition to the axon guidance pathway being involved in the formation of the neuronal network that can control blood vessels and bronchial contractility, it can also regulate leukocyte transmigration from blood to lung tissue [70,71]. This may offer a further explanation to better clearance of immune cells from the perivascular areas of infected BALB/c mice.
It is noteworthy though, that a candidate gene Ntrk2 (in the QTL on chromosome 13), for a neutrophin receptor, is also involved in cross-talk between nervous and immune systems [72], regulation of Th1/Th2 polarisation [73], T-cells development [74] and smooth muscle cells proliferation [75]. This wide range of Ntrk2functions places this gene in a central position linking airway smooth muscle, nervous and immune system, three areas where differences were found between resistant and susceptible strains during pneumococcal infection. In this context it is also notable that Ntrk2 was recently described as a protecting factor in pneumococcal meningitis [76], making this gene a very promising candidate for further investigation.
There is clear evidence that regulation of immune cell populations differs between resistant and susceptible strains during pneumococcal infection. This can be seen in timing and quantity of cellular infiltrations [3,9], T-cell recruitment [21] and macrophage functioning [77]. Furthermore, the results from our present study showed that pathways that differentiated between pulmonary transcriptomes of resistant and susceptible mice were associated with immune cells proliferation and functioning. We showed that hematopoietic cell lineage and p53-signalling pathways are unique for BALB/c, while pathways involved in immune cells functioning such as T-cells receptor signalling and natural killer cells mediated cytotoxicity were unique to susceptible CBA/Ca mice. Furthermore, we found that candidate genesFas, Map4k1,RasGRP4andSpint2(all butFasencoded within the QTL on chromosome 7) were involved in regulation of immune cells. For example, RasGRP4 encodes guanine nucleotides exchange factor, which was recently reported to influence ROS production in neutrophils [78] and Spint2 encodes a Kunitz-type serine protease inhibitor. Interestingly, a Kunitz-type protease inhibitor was reported to suppress pro-inflammatory cytokine production in macrophages and neutrophils [79,80,81] offering possible expla-nation for observed differences in BALB/c and CBA/Ca macrophages [77]. Two very interesting genes were Fas and Map4k1both of which showed phenotype-associated amino acid substitutions. Their expression also differed between CBA/Ca and BALB/c in disease or between control animals. Although Fas regulates apoptosis in a wide range of cells,Map4k1is expressed exclusively in hematopoietic compartment.Map4k1plays a pivotal role in regulation of activation induced T-cell apoptosis [82]. This function seems especially interesting because many reports demonstrate that T-cells are recruited and highly engaged during pneumococcal infection [8,21,83] and affect host survival [21,84,85].
The regulation of immune cell populations is a key factor in resistance to pneumococci that can lead to either resolution (associated with resistance) or uncontrolled inflammation (associ-ated with susceptibility). The trafficking of immune cells from the bloodstream to tissues parenchyma is regulated by fibroblasts and may be critical for the host early defences against pneumococci [51]. Furthermore our data demonstrate that lung vasculature may be equally important to host survival, not least because it constitutes an important barrier to bacterial dissemination into blood and development of invasive pneumococcal disease. The
accumulation of immune cells within lung perivascular areas could affect vessel functioning and facilitate bacterial dissemination into blood, a prominent feature of susceptible mice infection. In contrast, migration of leukocytes into lung parenchyma could activate parenchymal fibroblasts and initiate TGFb-mediated immunomodulatory responses, a feature of resistant mice infec-tion. This pattern of inflammation is likely a result of inherited differences in lung vasculature (e.g.: fibroblast/smooth muscle cells) and/or immune cells qualities (e.g.: motility or ability to clear bacteria). This is a promising hypothesis since we found that half of the genes carrying phenotype-associated polymorphism have well documented roles in fibroblast differentiation, smooth muscle and immune cells functioning. Therefore we propose that the phenotype of pulmonary fibroblasts may contribute to host survival through regulation of immune cells trafficking, synthesis and activation of TGFb and modulation of vessel functioning. Furthermore we speculate that the resistance to pneumococcal infection is modulated by the cumulative effect of alteration within several genetic factors. This hypothesis comes from the discovery of multiple disease QTLs and observation that the phenotype-associated polymorphism was located within very limited number of genes and intergenic regions (22 genes out of few hundred encoded within identified four QTLs). We also observed mixed pattern of susceptible and resistant SNP variants associated with intermediate but not susceptible mouse strains, supporting our speculation on the cumulative effect of candidate genes on resistance to pneumococci.
Methods
Ethics statement
All animal experiments were performed in accordance to the UK Home Office guidelines. The University of Leicester Ethics Committee and the UK Home Office approved the study protocols. Animals were housed and experiments carried out at designated facility at the University of Leicester.
Mice
The female mice of 26 inbred Jax-mouse strains, 10 mice per strain were purchased from The Jackson Laboratory: 129S1/ SvImJ, A/J, AKR/J, BALB/cByJ, BALB/cJ, BTBR T+ tf/J, C3H/HeJ, C57BL/J, C57BL/6J, C57BL/10J, C57BLKS/J, C57BR/cdJ, C58/J, CBA/J, DBA/1J, DBA/2J, FVB/NJ, I/ LnJ, LP/J, MA/MyJ, NOD/ShiLtJ, NZW/LacJ, PL/J, SEA/ GnJ, SJL/J and SM/J while two strains BALB/cOlaHsd and CBA/CaOlaHsd were purchased from Harlan, UK. Mice were housed in the Division of Biomedical Services, University of Leicester. All mice were fed on fundamental diet. Mice used for the experiments were 9 to 12 week old.
Bacterial strain
Streptococcus pneumoniaserotype 2 strain D39 (NCTC7466) from the National Collection of Type Cultures, Central Public Health Laboratory, London, United Kingdom was used. To prepare a challenge stock bacteria were grown overnight on blood agar base (BAB) plate with 5% horse blood in CO2jar at 37uC. Next day
bacterial colonies were transferred from the BAB plate to THY media (Gibco) until OD600reached 0.2. The primary culture was
diluted 100 times in THY and grown at 37uC in anaerobic condition until the culture reached OD600 corresponding to 1–
Infection
To prepare the challenge dose, aliquot of bacteria stock was centrifuged (13 K rpm) and pellet resuspended in PBS to final concentration 2.56108CFU/ml. Mice were lightly anaesthetized
with 2.5 to 5.0% (v/v) fluothane (Zeneca Pharmaceuticals, Macclesfield, United Kingdom) over oxygen (1.5 to 2 l/min) and intranasally infected with 20ml (56106) of the challenge dose. 24 h post-infection about 50ml of blood were taken from the tail vain and bacteria load in blood was measured by viable count (Gingles at al 2001). Mice were closely monitored and the pain score chart was filled every 6 h until animal was lethargic or until the end of the experiment (7 days) when animal was classified as a survivor. This time point was then used as a surrogate for the survival end point. Animals were humanly euthanized by cervical dislocation when they reached the end point, either when lethargic or at the end of the experiment (168 h). At the time of death blood and lung were collected and bacterial load was measured by viable count.
Phenotype analysis
The time the animal survived the infection (survival), was used for genome-wide associations mapping to identify disease QTLs. Collected data for each mouse were first analysed using statistical software SPSS. Bartlett’s test for equal variances was calculated for each mouse strain and phenotype. One-way ANOVA and Tukey’s Multiple Comparison post-test were used to check for statistically significant differences between strains. Strains were classified as resistant, sensitive or intermediate based on the ANOVA results of the survival time for each strain. The rate of survival was represented as the percentage of animals that survived the infection (168 h).
Microarray
Pulmonary gene expression in CBA/CaOlaHsd and BALB/ cOlaHsd mice (Harlan, UK) was assessed at 6 h post infection. Mice inoculated with 20ml of PBS and sacrificed 6 h post-inoculation were treated as control. Six control animals and five infected animals per strain were used in the gene expression experiment. Control and infected mice were sacrificed at 6 h time point and whole lung was removed. Lungs were cut into small squares and immediately immersed in RNAlater (Qiagen). Lung RNA was isolated using RNAeasy mini kit (Qiagen) according to manufacturer instructions. cRNA was synthesized using Ambion MessageAmp kit for Illumina arrays according to manufacturer instruction. The whole lung gene expression was done using chip MouseWG-6_V2_0_R3 on Illumina platform. Gene expression data deposited within the NCBI Gene Expression Omnibus (GEO), Accession No: GSE49533.
Analysis of microarray data
Microarray data were analysed using GenomeStudio (Illumina) and ArrayTrack [86]. Signal intensity data were normalized across all arrays using quintile normalization in GenomeStudio (Illumina) software. The lists of differentially expressed genes were then created using t-test in ArrayTrack. Differentially expressed genes were selected by calculating a ratio between signal intensity of infected and non-infected conditions for each mouse strain or by calculating the ratio between signal intensity of control BALB/ cOlaHsd and CBA/CaOlaHsd animals to check for background differences unrelated to infection.
Real-time PCR
For quantitative RT-PCR, 500 ng of total RNA was reverse transcribed using the RevertAid H Minus First Strand
cDNA-Syntheis Kit according to manufacturer protocol (Fermentas). Real time quantitative PCR was performed in triplicate on a LightCycler 480 Real-Time PCR System (Roche) in a final volume of 5ml using 16Maxima SYBR Green qPCR master mix (Fermentas) and 3.3mM of forward and reverse primers for each
mRNA tested. Cycling conditions were 95uC for 15 minutes, and 38 cycles of amplification at 95uC for 15 seconds, 60uC for 30 seconds and 72uC for 30 seconds. Primers were designed to amplify the same transcripts as those tested on the Illumina MouseWG-6_V2_0_R3 whole genome gene expression beadchips (Table S3). Gapdh and Hprt-1 mRNAs were selected for data normalisation using Genorm [87]. The expression of each mRNA tested was normalised to the geometric mean of Gapdh and Hprt-1 expression [87].
Genome Wide Association Mapping by PLINK
Genotype files (130K SNP panel, Mouse Assembly NCBIM37) for phenotyped inbred Jax-mouse strains were downloaded from Mouse Phenome Database (MPD). To search for haplotype associations (Haplotype Association Mapping, HAM) the mean survival time (hours) was used. Data were analysed using gPLINK version 2.050 [88].
Genome Wide Association Mapping by EMMA
Measurements for survival in hours for 10 animals per mouse strain were used to search for association using Efficient Mixed Model Association, EMMA [89]. Analyses were done using EMMA Correction Server for all tested inbred mouse strains. EMMA algorithm corrects for population structure and related-ness among inbred mouse strains. QTL mapping by EMMA was done using both 130K and 4Mil SNP panels available.
QTL selection
The QTLs were consider a candidate disease QTL if at least 3 SNPs within 0.5 Mb were found displaying significance equal or below p-value 1025 for 130K SNP panel and p-value equal or below 561028when 4Mil SNP panel was used. The interval of the QTL was calculated as the region containing significant SNPs with 1 Mb downstream and upstream of this region [90]. The list of candidate QTLs was generated and cross-compared between both methods. QTL that was significant in both EMMA and PLINK was selected as candidate QTL.
Sequence polymorphism within Harlan BALB/c and CBA/ Ca strains within candidate QTLs
6J and LP/J). We generated a list of SNPs between CBA/ CaOlaHsd and BALB/cOlaHsd that were copied in CBA/J and BALB/cJ; this was used as the final list of differentiating SNPs. List of SNPs was deposited in NCBI dbSNP [91].
Gene Identification
Gene list were generated for each selected QTL using MGI Genes and Markers Query Form. Genes within selected QTLs were then compared with the lists of differentially expressed genes during pneumococcal infection of BALB/c and CBA/Ca strains (ArrayTrack). The list of differentially expressed genes between non-disease condition in BALB/cOlaHsd and CBA/CaOlaHsd was also analysed. The sequence of the genes within QTL region was examined using Mouse Phenome Database (MPD) SNP variation query form (NCBIM37). The gene was classified as most likely causal candidate if found within susceptibility QTL and either showed genetic polymorphism within or nearby its coding region or showed change in expression during pneumococcal infection. The identified nucleotide substitutions within candidate genes that led to amino acid change were also analysed using the PROVEAN tool [92] to evaluate an effect of the alteration on the protein function.
Preparation and analysis of lung tissues sections At necropsy, tissue samples were immersed in 10% v/v neutral buffered formaldehyde solution prior to conventional processing and embedding in paraffin wax. Histopathological assessment was performed on tissue section stained with haematoxylin and eosin (BDH). Lungs samples were then examined microscopically and vessels with visible perivascular areas were counted as affected (accumulation of cellular influx) or unaffected (clear perivascular areas). The number of affected vessels per lung was then calculated
as a percentage of total number of counted vessels (affected and unaffected) in the lung section. Lungs of five animals per time point (6 h and 24 h) and per mouse strain were examined.
Supporting Information
Table S1 The genome-wide significant SNPs (p-value ,5610E-8) identified during the EMMA mapping and
their alteration within tested inbred mouse strains.The SNP ID, Ensemble annotation for the SNP (I – intron variant, U3 – UTR variant 39, Cn – missense, Cs synonymous codon) and log10 p-value scores for the EMMA mapping [GWAS log(p)] are presented. The red colour indicates resistant mouse strain or SNP associated with the resistance to pneumococcal infection.
(XLSX)
Table S2 Correlation between expression scores ob-tained by microarray and RT-qPCR technique.
(XLSX)
Table S3 Primer pairs used for RT-qPCR of selected mouse genes.
(XLSX)
Acknowledgments
We thank Janine E. Moreton for technical assistance with processing of lung sections and Dr. Peter Greaves for his advice on lung pathology.
Author Contributions
Conceived and designed the experiments: PWA PD MSJ. Performed the experiments: MSJ NS VEF. Analyzed the data: MSJ MS SK AMM PD PWA. Contributed reagents/materials/analysis tools: PWA AMM. Wrote the paper: MSJ PWA PD.
References
1. O’Brien KL, Wolfson LJ, Watt JP, Henkle E, Deloria-Knoll M, et al. (2009) Burden of disease caused byStreptococcus pneumoniaein children younger than 5 years: global estimates. Lancet 12: 893–902.
2. Martens P, Worm SW, Lundgren B, Konradsen HB, Benfield T (2004) Serotype-specific mortality from invasive Streptococcus pneumoniae disease revisited. BMC Infect Dis 30: 4–21.
3. Kerr AR, Irvine JJ, Search JJ, Gingles NA, Kadioglu A, et al. (2002) Role of inflammatory mediators in resistance and susceptibility to pneumococcal infection. Infect Immun 70: 1547–57.
4. Mizrachi-Nebenzahl Y, Lifshitz S, Teitelbaum R, Novick S, Levi A, et al. (2003) Differential activation of the immune system by virulent Streptococcus pneumoniae strains determines recovery or death of the host. Clin Exp Immunol 134: 23–31.
5. Kadioglu A, Cuppone AM, Trappetti C, List T, Spreafico A, et al. (2011) Sex-based differences in susceptibility to respiratory and systemic pneumococcal disease in mice. J Infect Dis 204: 1971–9.
6. Marriott HM, Dockrell DH. (2006) Streptococcus pneumoniae: the role of apoptosis in host defense and pathogenesis. Int J Biochem Cell Biol 38: 1848–54. 7. Hollingsworth JW, Whitehead G, Berman KG, Tekippe EM, Gilmour MI, et al. (2007) Genetic basis of murine antibacterial defense to streptococcal lung infection. Immunogenetics 59: 713–24.
8. Kadioglu A, Gingles NA, Grattan K, Kerr A, Mitchell TJ, et al. (2000) Host cellular immune response to pneumococcal lung infection in mice. Infect Immun 68: 492–501.
9. Gingles NA, Alexander JE, Kadioglu A, Andrew PW, Kerr A, et al. (2001) Role of genetic resistance in invasive pneumococcal infection: identification and study of susceptibility and resistance in inbred mouse strains. Infect Immun 69: 426– 34.
10. Kadioglu A, Andrew PW (2004) The innate immune response to pneumococcal lung infection: the untold story. Trends Immunol 25: 143–9
11. Cruse G, Fernandes VE, de Salort J, Pankhania D, Marinas MS, et al. (2010) Human lung mast cells mediate pneumococcal cell death in response to activation by pneumolysin. J Immunol 184: 7108–15.
12. van Rossum AM, Lysenko ES, Weiser JN (2005) Host and bacterial factors contributing to the clearance of colonization by Streptococcus pneumoniae in a murine model. Infect Immun 73: 7718–26.
13. Brueggemann AB, Griffiths DT, Meats E, Peto T, Crook DW, et al. (2003) Clonal relationships between invasive and carriage Streptococcus pneumoniae
and serotype- and clone-specific differences in invasive disease potential. J Infect Dis 187: 1424–32.
14. Fernebro J, Blomberg C, Morfeldt E, Wolf-Watz H, Normark S, et al. (2008) The influence of in vitro fitness defects on pneumococcal ability to colonize and to cause invasive disease. BMC Microbiol 8: 65.
15. Blomberg C, Dagerhamn J, Dahlberg S, Browall S, Fernebro J, et al. (2009) Pattern of accessory regions and invasive disease potential in Streptococcus pneumoniae. J Infect Dis 199: 1032–42.
16. Chapman SJ, Khor CC, Vannberg FO, Rautanen A, Walley A, et al. (2010) Common NFKBIL2 polymorphisms and susceptibility to pneumococcal disease: a genetic association study. Crit Care 14(6): R227.
17. Chapman SJ, Khor CC, Vannberg FO, Rautanen A, Segal S, et al. (2010) NFKBIZ polymorphisms and susceptibility to pneumococcal disease in European and African populations. Genes Immun 11: 319–25.
18. Chapman SJ, Khor CC, Vannberg FO, Frodsham A, Walley A, et al. (2007) IkappaB genetic polymorphisms and invasive pneumococcal disease. Am J Respir Crit Care Med 176: 181–7.
19. Glavan BJ, Holden TD, Goss CH, Black RA, Neff MJ, et al. (2011) Genetic variation in the FAS gene and associations with acute lung injury. Am J Respir Crit Care Med 183: 356–63.
20. Lingappa JR, Dumitrescu L, Zimmer SM, Lynfield R, McNicholl JM, et al. (2011) Identifying host genetic risk factors in the context of public health surveillance for invasive pneumococcal disease. PLoS One 6(8): e23413. 21. Neill DR, Fernandes VE, Wisby L, Haynes AR, Ferreira DM, et al. (2012) T
regulatory cells control susceptibility to invasive pneumococcal pneumonia in mice. PLoS Pathog 8(4): e1002660.
22. Sun K, Gan Y, Metzger DW (2011) Analysis of murine genetic predisposition to pneumococcal infection reveals a critical role of alveolar macrophages in maintaining the sterility of the lower respiratory tract. Infect Immun 79: 1842–7. 23. Denny P, Hopes E, Gingles N, Broman KW, McPheat W, et al. (2003) A major locus conferring susceptibility to infection by Streptococcus pneumoniae in mice. Mamm Genome 14: 448–53.
24. Flint J, Eskin E (2012) Genome-wide association studies in mice. Nat Rev Genet 13: 807–17.
26. Hirschhorn JN, Daly MJ. (2005) Genome-wide association studies for common diseases and complex traits. Nat Rev Genet 6: 95–108.
27. Hunter KW, Crawford NP (2008) The future of mouse QTL mapping to diagnose disease in mice in the age of whole-genome association studies. Annu Rev Genet 42: 131–41.
28. Flint J, Valdar W, Shifman S, Mott R (2005) Strategies for mapping and cloning quantitative trait genes in rodents. Nat Rev Genet 6: 271–86.
29. Liu P, Vikis H, Lu Y, Wang D, You M (2007) Large-scale in silico mapping of complex quantitative traits in inbred mice. PLoS One 2(7): e651.
30. Bennett BJ, Farber CR, Orozco L, Kang HM, Ghazalpour A, et al. (2010) A high-resolution association mapping panel for the dissection of complex traits in mice. Genome Res 20: 281–90.
31. Manolio TA, Brooks LD, Collins FS (2008) A HapMap harvest of insights into the genetics of common disease. J Clin Invest 118: 1590–605.
32. Flint J (2013) Gwas. Curr Biol 23(7): R265–6.
33. Leduc MS, Lyons M, Darvishi K, Walsh K, Sheehan S, et al. (2011) The mouse QTL map helps interpret human genome-wide association studies for HDL cholesterol. J Lipid Res 52: 1139–49.
34. Su Z, Leduc MS, Korstanje R, Paigen B (2010) Untangling HDL quantitative trait loci on mouse chromosome 5 and identifying Scarb1 and Acads as the underlying genes. J Lipid Res 51: 2706–13.
35. Keane TM, Goodstadt L, Danecek P, White MA, Wong K, et al. (2011) Mouse genomic variation and its effect on phenotypes and gene regulation. Nature 477: 289–94.
36. Malo D, Vogan K, Vidal S, Hu J, Cellier M, et al. (1994) Haplotype mapping and sequence analysis of the mouse Nramp gene predict susceptibility to infection with intracellular parasites. Genomics 23: 51–61.
37. Mackenzie B, Hediger MA (2004) SLC11 family of H+-coupled metal-ion transporters NRAMP1 and DMT1. Pflugers Arch 447: 571–9.
38. Halestrap AP (2013) The SLC16 gene family - structure, role and regulation in health and disease. Mol Aspects Med 34: 337–49.
39. Chapman SJ, Hill AV (2012) Human genetic susceptibility to infectious disease. Nat Rev Genet 13: 175–88.
40. Degn SE, Jensenius JC, Thiel S (2011) Disease-causing mutations in genes of the complement system. Am J Hum Genet 88: 689–705.
41. Miyazono K, ten Dijke P, Heldin CH (2000) TGF-beta signaling by Smad proteins. Adv Immunol 75: 115–57.
42. Heldin CH, Moustakas A (2012) Role of Smads in TGFbsignaling. Cell Tissue Res 347: 21–36.
43. Ibarrola N, Kratchmarova I, Nakajima D, Schiemann WP, Moustakas A, et al. (2004) Cloning of a novel signaling molecule, AMSH-2, that potentiates transforming growth factor beta signaling. BMC Cell Biol 5: 2.
44. Desmoulie`re A, Geinoz A, Gabbiani F, Gabbiani G (1993) Transforming growth factor-beta 1 induces alpha-smooth muscle actin expression in granulation tissue myofibroblasts and in quiescent and growing cultured fibroblasts. J Cell Biol 122: 103–11.
45. Roy SG, Nozaki Y, Phan SH (2001) Regulation of alpha-smooth muscle actin gene expression in myofibroblast differentiation from rat lung fibroblasts. Int J Biochem Cell Biol 33: 723–34.
46. Romano V, Raimondo D, Calvanese L, D’Auria G, Tramontano A, et al. (2012) Toward a better understanding of the interaction between TGF-b family members and their ALK receptors. J Mol Model 18: 3617–25.
47. Ichikawa T, Sugiura H, Koarai A, Kikuchi T, Hiramatsu M, et al. (2013) 25-Hydroxycholesterol promotes fibroblast-mediated tissue remodeling through NF-kB dependent pathway. Exp Cell Res 319: 1176–86.
48. Liu X, Kelm RJ Jr, Strauch AR (2009) Transforming growth factor beta1-mediated activation of the smooth muscle alpha-actin gene in human pulmonary myofibroblasts is inhibited by tumor necrosis factor-alpha via mitogen-activated protein kinase kinase 1-dependent induction of the Egr-1 transcriptional repressor. Mol Biol Cell 20: 2174–85.
49. McGettrick HM, Butler LM, Buckley CD, Rainger GE, Nash GB (2012) Tissue stroma as a regulator of leukocyte recruitment in inflammation. J Leukoc Biol 91: 385–400.
50. Parsonage G, Filer AD, Haworth O, Nash GB, Rainger GE, Salmon M, Buckley CD (2005) A stromal address code defined by fibroblasts. Trends Immunol 26: 150–6
51. Behzad AR, Chu F, Walker DC (1996) Fibroblasts are in a position to provide directional information to migrating neutrophils during pneumonia in rabbit lungs. Microvasc Res 51: 303–16
52. Wynn TA (2008) Cellular and molecular mechanisms of fibrosis. J Pathol 214: 199–210.
53. Meneghin A, Hogaboam CM (2007) Infectious disease, the innate immune response, and fibrosis. J Clin Invest 117: 530–8.
54. Wipff PJ, Rifkin DB, Meister JJ, Hinz B (2007) Myofibroblast contraction activates latent TGF-beta1 from the extracellular matrix. J Cell Biol 179: 1311– 23.
55. Pechkovsky DV, Hackett TL, An SS, Shaheen F, Murray LA, et al. (2010) Human lung parenchyma but not proximal bronchi produces fibroblasts with enhanced TGF-beta signaling and alpha-SMA expression. Am J Respir Cell Mol Biol 43: 641–51.
56. Blobe GC, Schiemann WP, Lodish HF (2000) Role of transforming growth factor beta in human disease. N Engl J Med 342: 1350–8.
57. Du W, Stiber JA, Rosenberg PB, Meissner G, Eu JP (2005) Ryanodine receptors in muscarinic receptor-mediated bronchoconstriction. J Biol Chem 280: 26287– 94.
58. Sanderson MJ, Delmotte P, Bai Y, Perez-Zogbhi JF (2008) Regulation of airway smooth muscle cell contractility by Ca2+signaling and sensitivity. Proc Am Thorac Soc 5: 23–31.
59. Lloyd EE, Crossland RF, Phillips SC, Marrelli SP, Reddy AK, et al. (2011) Disruption of K(2P)6.1 produces vascular dysfunction and hypertension in mice. Hypertension 58: 672–8.
60. Pagiatakis C, Gordon JW, Ehyai S, McDermott JC (2012) A novel RhoA/ ROCK-CPI-17-MEF2C signaling pathway regulates vascular smooth muscle cell gene expression. J Biol Chem 287: 8361–70.
61. Kermani P, Hempstead B (2007) Brain-derived neurotrophic factor: a newly described mediator of angiogenesis. Trends Cardiovasc Med 17: 140–3. 62. Kermani P, Rafii D, Jin DK, Whitlock P, Schaffer W, et al. (2005)
Neurotrophins promote revascularization by local recruitment of TrkB+
endothelial cells and systemic mobilization of hematopoietic progenitors. J Clin Invest 115: 653–63.
63. Mandelkow E, Mandelkow EM (2002) Kinesin motors and disease. Trends Cell Biol 12: 585–91.
64. Wagner N, Wagner KD, Theres H, Englert C, Schedl A, et al. (2005) Coronary vessel development requires activation of the TrkB neurotrophin receptor by the Wilms’ tumor transcription factor Wt1. Genes Dev 19: 2631–42.
65. Miao CY, Li ZY (2012) The role of perivascular adipose tissue in vascular smooth muscle cell growth. Br J Pharmacol 165: 643–58.
66. Xia YC, Redhu NS, Moir LM, Koziol-White C, Ammit AJ, et al. (2013) Pro-inflammatory and immunomodulatory functions of airway smooth muscle: emerging concepts. Pulm Pharmacol Ther 26: 64–74.
67. Koziol-White CJ, Damera G, Panettieri RA (2011) Targeting airway smooth muscle in airways diseases: an old concept with new twists. Expert Rev Respir Med 5: 767–77.
68. Szasz T, Bomfim GF, Webb RC (2013) The influence of perivascular adipose tissue on vascular homeostasis. Vasc Health Risk Manag 9: 105–16. 69. Guzik TJ, Marvar PJ, Czesnikiewicz-Guzik M, Korbut R (2007) Perivascular
adipose tissue as a messenger of the brain-vessel axis: role in vascular inflammation and dysfunction. J Physiol Pharmacol 58: 591–610.
70. Mirakaj V, Thix CA, Laucher S, Mielke C, Morote-Garcia JC, et al. (2010) Netrin-1 dampens pulmonary inflammation during acute lung injury. Am J Respir Crit Care Med 181: 815–24.
71. Morote-Garcia JC, Napiwotzky D, Ko¨hler D, Rosenberger P (2012) Endothelial Semaphorin 7A promotes neutrophil migration during hypoxia. Proc Natl Acad Sci U S A 109: 14146–51.
72. Prakash Y, Thompson MA, Meuchel L, Pabelick CM, Mantilla CB, et al. (2010) Neurotrophins in lung health and disease. Expert Rev Respir Med 4: 395–411. 73. Besser M, Wank R (1999) Cutting edge: clonally restricted production of the neurotrophins brain-derived neurotrophic factor and neurotrophin-3 mRNA by human immune cells and Th1/Th2-polarized expression of their receptors. J Immunol 162: 6303–6.
74. Maroder M, Bellavia D, Meco D, Napolitano M, Stigliano A, et al. (1996) Expression of trKB neurotrophin receptor during T cell development. Role of brain derived neurotrophic factor in immature thymocyte survival. J Immunol 157: 2864–72.
75. Kwapiszewska G, Chwalek K, Marsh LM, Wygrecka M, Wilhelm J, et al. (2012) BDNF/TrkB signaling augments smooth muscle cell proliferation in pulmonary hypertension. Am J Pathol 181: 2018–29.
76. Li L, Shui QX, Zhao ZY, Zhu XD, Bao WQ (2011) Dynamic changes of TrkB gene expression in Streptococcus pneumoniae meningitis after treatment with antibiotics and dexamethasone. World J Pediatr 7: 250–6.
77. Ripoll VM, Kadioglu A, Cox R, Hume DA, Denny P (2010) Macrophages from BALB/c and CBA/Ca mice differ in their cellular responses to Streptococcus pneumoniae. J Leukoc Biol 87: 735–41.
78. Suire S, Le´cureuil C, Anderson KE, Damoulakis G, Niewczas I, et al. (2012) GPCR activation of Ras and PI3Kc in neutrophils depends on PLCb2/b3 and the RasGEF RasGRP4. EMBO J 31: 3118–29.
79. Kanayama S, Yamada Y, Onogi A, Shigetomi H, Ueda S, et al. (2007) Bikunin suppresses expression of pro-inflammatory cytokines induced by lipopolysac-charide in neutrophils. J Endotoxin Res 13: 369–76.
80. Wakahara K, Kobayashi H, Yagyu T, Matsuzaki H, Kondo T, et al. (2005) Bikunin suppresses lipopolysaccharide-induced lethality through down-regula-tion of tumor necrosis factor- alpha and interleukin-1 beta in macrophages. J Infect Dis 191: 930–8.
81. Matsuzaki H, Kobayashi H, Yagyu T, Wakahara K, Kondo T, et al. (2004) Bikunin inhibits lipopolysaccharide-induced tumor necrosis factor alpha induction in macrophages. Clin Diagn Lab Immunol 11: 1140–7.
82. Brenner D, Krammer PH, Arnold R (2008) Concepts of activated T cell death. Crit Rev Oncol Hematol 66: 52–64.
83. Kemp K, Bruunsgaard H, Skinhøj P, Pedersen B (2002) Pneumococcal infections in humans are associated with increased apoptosis and trafficking of type 1 cytokine-producing T cells. Infect Immun 70: 5019–25.
84. LeMessurier K, Ha¨cker H, Tuomanen E, Redecke V (2010) Inhibition of T cells provides protection against early invasive pneumococcal disease. Infect Immun 78: 5287–94.