AMTD
7, 9803–9838, 2014Evaluation of MOZAIC Capacitive
Hygrometer
P. Neis et al.
Title Page
Abstract Introduction
Conclusions References
Tables Figures
◭ ◮
◭ ◮
Back Close
Full Screen / Esc
Printer-friendly Version Interactive Discussion
Discussion
P
a
per
|
Discus
sion
P
a
per
|
Discussion
P
a
per
|
Discussion
P
a
per
|
Atmos. Meas. Tech. Discuss., 7, 9803–9838, 2014 www.atmos-meas-tech-discuss.net/7/9803/2014/ doi:10.5194/amtd-7-9803-2014
© Author(s) 2014. CC Attribution 3.0 License.
This discussion paper is/has been under review for the journal Atmospheric Measurement Techniques (AMT). Please refer to the corresponding final paper in AMT if available.
Evaluation of the MOZAIC Capacitive
Hygrometer during the airborne field
study CIRRUS-III
P. Neis1,3, H. G. J. Smit1, M. Krämer2, N. Spelten2, and A. Petzold1
1
Forschungszentrum Jülich GmbH, Institut für Energie and Klimaforschung, IEK-8 Troposphäre, 52425 Jülich, Germany
2
Forschungszentrum Jülich GmbH, Institut für Energie and Klimaforschung, IEK-7 Stratosphäre, 52425 Jülich, Germany
3
Johannes Gutenberg Universität Mainz, Institut für Physik der Atmosphäre, 55099 Mainz, Germany
Received: 15 July 2014 – Accepted: 3 September 2014 – Published: 22 September 2014
Correspondence to: P. Neis ([email protected])
AMTD
7, 9803–9838, 2014Evaluation of MOZAIC Capacitive
Hygrometer
P. Neis et al.
Title Page
Abstract Introduction
Conclusions References
Tables Figures
◭ ◮
◭ ◮
Back Close
Full Screen / Esc
Printer-friendly Version Interactive Discussion
Discussion
P
a
per
|
Discus
sion
P
a
per
|
Discussion
P
a
per
|
Discussion
P
a
per
|
Abstract
The MOZAIC Capacitive Hygrometer (MCH) is usually operated onboard of passenger aircraft in the framework of MOZAIC (Measurement of Ozone by AIRBUS In-Service Aircraft). In order to evaluate the performance of the MCH, it was operated aboard a Learjet 35A aircraft as part of the CIRRUS-III field study together with a closed-cell 5
Lyman-α fluorescence hygrometer (FISH) and an open path tunable diode laser
sys-tem (OJSTER) for water vapour measurement. After reducing the data set to MOZAIC-relevant conditions, the 1 Hz relative humidity (RH) cross correlation between MCH and reference instruments FISH (clear sky) and OJSTER (in-cirrus) yielded a remarkably
good agreement ofR2=0.97 and slopem=0.96 and provided the MCH uncertainty
10
of 5 % RH. Probability distribution functions of RH deduced from MCH and reference instruments agreed well over the entire range of observations. The main limitation for the use of MCH data is related to sensor temperatures below the calibration limit of
Tsensor=−40 ◦
C (corresponds to ambient temperature of Tambient=−70
◦
C at typical cruising speed of long-haul passenger aircraft), which causes a delay in the sensor’s 15
time response. Good performance of MCH for clear sky as well as for in-cirrus condi-tions demonstrated the sensor robustness also for operation inside ice clouds.
1 Introduction
Water vapour is one of the most important variables for weather prediction and climate research. Particularly, the interaction between the water vapour in the UT/LS (upper 20
troposphere and lowermost stratosphere) and tropopause dynamics is not well under-stood. Thus, in the latest IPCC report (Stocker et al., 2013), it is stated that the knowl-edge about potential trends and climate feedback mechanisms of upper tropospheric water vapour is low because of the lack of long data records of high quality in this specific region of the global atmosphere. Neither the global radiosondes network nor 25
AMTD
7, 9803–9838, 2014Evaluation of MOZAIC Capacitive
Hygrometer
P. Neis et al.
Title Page
Abstract Introduction
Conclusions References
Tables Figures
◭ ◮
◭ ◮
Back Close
Full Screen / Esc
Printer-friendly Version Interactive Discussion
Discussion
P
a
per
|
Discus
sion
P
a
per
|
Discussion
P
a
per
|
Discussion
P
a
per
|
while the regular in-situ measurement of upper tropospheric humidity (UTH) is still dif-ficult.
Since 1994, the European research programme MOZAIC (Measurement of Ozone by AIRBUS In-Service Aircraft; Marenco et al., 1998) and its successor IAGOS (In-service Aircraft for a Global Observing System; Petzold et al., 2013) provide regular 5
data for relative humidity (RH) and other meteorological quantities like temperature and pressure as well as data on atmospheric composition (e.g. ozone and CO) with high spatial and temporal resolution on a global scale. The long-term observations are obtained by in-situ measurements aboard civil passenger aircraft using the existing infrastructure of the international air transport system. However, the continuous high-10
quality in-situ measurements are restricted to the major global flight routes and to the cruising altitude band of 9–13 km, i.e. the observations refer to a large extent to the UT/LS region. Relative humidity data from the MOZAIC programme have been used for various climatological studies including the distribution of UTH (Kley et al., 2007; Luo et al., 2007, 2008), the distribution of RH with respect to ice (RHice, e.g., Gierens et al.,
15
1997, 1999) and ice-supersaturation regions (e.g., Gierens et al., 2000; Spichtinger et al., 2003) in the upper troposphere. A reanalysis of the global MOZAIC RH data set for the period 2000–2009 was performed recently (Smit et al., 2014).
Atmospheric RH is measured in the MOZAIC/IAGOS approach through a compact airborne humidity sensing device using capacitive sensors (MOZAIC Capacitive Hy-20
grometer: MCH). The sensor itself and the applied calibration techniques are described in detail by Helten et al. (1998). First validation studies from wing-by-wing flights of a MOZAIC aircraft and a research aircraft are reported by Helten et al. (1999), while Smit et al. (2008) presents an approach for a potential in-flight calibration of MCH.
In order to assess the validity of the long-term water vapour data and its limita-25
tions, Helten et al. (1999) provided an in-flight comparison of MOZAIC and POLINAT (Schlager et al., 1997; Schumann, 1997) water vapour measurements. However, this
wing-by-wing flight intercomparison was difficult to analyse because the twin-engine
AMTD
7, 9803–9838, 2014Evaluation of MOZAIC Capacitive
Hygrometer
P. Neis et al.
Title Page
Abstract Introduction
Conclusions References
Tables Figures
◭ ◮
◭ ◮
Back Close
Full Screen / Esc
Printer-friendly Version Interactive Discussion
Discussion
P
a
per
|
Discus
sion
P
a
per
|
Discussion
P
a
per
|
Discussion
P
a
per
|
time lags and distances. In 2006, there was the opportunity to participate in the aircraft campaign CIRRUS-III along with other more sophisticated instruments for measuring the water vapour volume mixing ratio (VMR). The in-flight single-platform measure-ments permitted a blind intercomparison of the MCH with high performance research water vapour instruments by measuring the same air masses for a longer time and un-5
der different atmospheric conditions than in the limited wing-by-wing study published by Helten et al. (1999). A similar analysis of the improved IAGOS Capacitive Hygrometer is in preparation and will be published elsewhere.
2 MOZAIC Capacitive Hygrometer
The compact airborne MCH consists of a capacitive sensor (Humicap-H, Vaisala, Fin-10
land) whose capacitance depends on the relative humidity of the dielectric layer of the condensor and a platinum resistance sensor (Pt100) for the direct measurement of the temperature at the humidity sensing surface. The basic measurement process is based on the diffusion-limited adsorption of the H2O-molecules by the dielectric membrane of
the sensor. Since diffusion is strongly temperature-dependent, the sensor response
15
slows down at lower temperatures. Figure 1 shows how both sensors are mounted in the used air sampling housing (Model 102 BX, Rosemount Inc.; see Stickney et al., 1990). The relative humidity and temperature signals are linearized by a microproces-sor controled transmitter unit (HMP230, Vaisala).
In its original MOZAIC mounting position aboard an Airbus A340-400 the sensor 20
housing is placed approx. 7 m downstream of the aircraft nose on the left side with a 7 cm distance from the aircraft skin to avoid possible contaminating interferences with the aircraft skin. Inside the Rosemount housing the air flow is separated into the main flow, which traverses straight through the housing and the minor flow, which follows a sharp right angle into a smaller channel where the sensors are placed. The housing 25
AMTD
7, 9803–9838, 2014Evaluation of MOZAIC Capacitive
Hygrometer
P. Neis et al.
Title Page
Abstract Introduction
Conclusions References
Tables Figures
◭ ◮
◭ ◮
Back Close
Full Screen / Esc
Printer-friendly Version Interactive Discussion
Discussion
P
a
per
|
Discus
sion
P
a
per
|
Discussion
P
a
per
|
Discussion
P
a
per
|
The right angle of the minor flow protects the RH and T sensors against dust, water
drops, and ice particles.
Due to the strong speed reduction in the inlet part of the housing, the sampled air flow is significantly heated through adiabatic heating. Assuming 100 % conversion of kinetic
energy to heat during flow deceleration, the ambient temperature Tambient (Static Air
5
Temperature SAT; see Helten et al., 1998) increases to the temperature at the sensor inside the housing, i.e. the sensor temperatureTsensor (Total Air Temperature TAT; see
Helten et al., 1998). The relationship between ambient temperatureTambientand sensor
temperatureTsensoris a function of the aircraft speed, i.e. its Mach-number M:
Tsensor=Tambient·
1+
c
p−cv
2cv
·M2
(1) 10
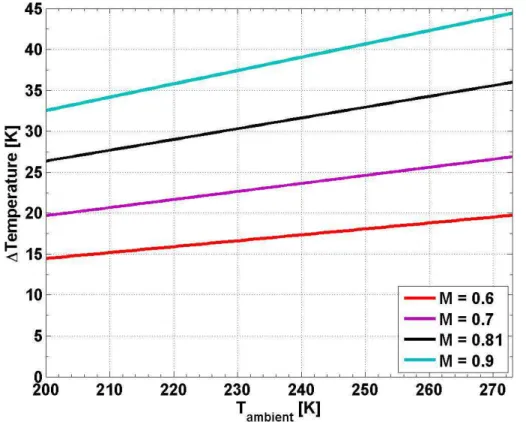
wherecp(=1005 J kg−1K−1) andcv (=717 J kg−1K−1) are the specific heat of dry air at constant pressure and volume, respectively. The resulting difference betweenTsensor
and Tambient at 10–12 km cruising altitude for different Mach-numbers is displayed in
Fig. 2: for the MOZAIC-typical aircraft speed of M=0.81 the adiabatic heating effect 15
is approx. 30 K.Tambientis derived from Eq. (1) with an uncertainty of less than±0.5 K
resulting from uncertainties in Tsensor (±0.25 K) andM (Helten et al., 1998). Because
of the strong temperature increase, the detected dynamic relative humidity RHdynamic
(RHD; Helten et al., 1998) is significantly lower than the static relative humidity RHstatic (RHS; Helten et al., 1998) of the ambient air atTambient(Helten et al., 1998):
20
RHstatic=RHdynamic· T
ambient
Tsensor
cpcp−cv es, liquid(Tsensor)
es, liquid(Tambient)
(2)
wherees, liquid is the water vapour saturation pressure over liquid water atTsensor and
Tambient, respectively. The water vapour saturation pressure over liquid water es, liquid
follows the Goff and Gratch (1946) formulation of saturation water vapour pressure
25
AMTD
7, 9803–9838, 2014Evaluation of MOZAIC Capacitive
Hygrometer
P. Neis et al.
Title Page
Abstract Introduction
Conclusions References
Tables Figures
◭ ◮
◭ ◮
Back Close
Full Screen / Esc
Printer-friendly Version Interactive Discussion
Discussion
P
a
per
|
Discus
sion
P
a
per
|
Discussion
P
a
per
|
Discussion
P
a
per
|
Meteorolgical Organization (WMO, 1990) and adapted to ther international tempera-ture scale 1990 (ITS-90) by Sonntag (1994). For fast high-flying aircraft the relation RHstatic/RHdynamicreaches a factor of approx. 13 (Helten et al., 1998), which leads to
the fact, that the RH sensor operates in the lowest 10 % of its full dynamic range. Since the sensor is operating in the lower part of its full dynamic range, an individual calibra-5
tion of each sensor is necessary, which is accomplished in the atmospheric simulation chamber at Jülich (Smit et al., 2000) before installation on the aircraft and after de-tachment past 500 h of flight. These calibrations are made over a sensor temperature
range between −40 and +20◦C against (i) Lyman-α fluorescence hygrometer (Kley
and Stone, 1978) at water vapour mixing ratios below 1000 ppmv (relative accuracy 10
±4 %, Helten et al., 1998) and (ii) dew/frost point hygrometer (General Eastern, Type
D1311R) at water vapour mixing ratios above 1000 ppmv with an accuracy of±0.5 K.
The relative humidity of a calibrated sensor (RHC) at constant temperatureT is found
to be linearly related to the uncorrected output value (RHUC) provided by the HMP230
transmitter unit (Helten et al., 1998) 15
RHC(T)=a(T)+b(T)·RHUC(T) (3)
Evaluation of 5 years of pre- and post-flight calibrations in MOZAIC has shown that the offseta(T) is the most critical parameter in determining the uncertainty of the measure-ments, while the sensitivity is less critical and more stable (Smit et al., 2008).
20
AMTD
7, 9803–9838, 2014Evaluation of MOZAIC Capacitive
Hygrometer
P. Neis et al.
Title Page
Abstract Introduction
Conclusions References
Tables Figures
◭ ◮
◭ ◮
Back Close
Full Screen / Esc
Printer-friendly Version Interactive Discussion
Discussion
P
a
per
|
Discus
sion
P
a
per
|
Discussion
P
a
per
|
Discussion
P
a
per
|
3 Experimental section
3.1 The CIRRUS-III field campaign
To extend the performance assessment of the MCH from the wing-by-wing flight in-tercomparison (Helten et al., 1999), the sensor was operated aboard a twin-engine business-jet aircraft of type Learjet 35A as part of the CIRRUS-III field study, which 5
was coordinated by Forschungszentrum Jülich.
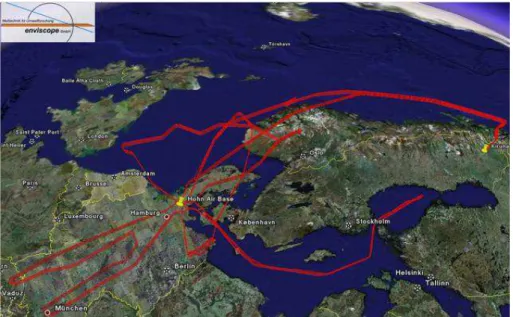
The overarching goals of CIRRUS-III were to understand the formation mechanism of cirrus clouds in different background conditions, their radiative effects and the micro-physical properties of the cirrus cloud particles. In total 6 flights were conducted in the
period between 23 and 29 November 2006 at mid-latitudes (45–70◦N, see Fig. 3) and
10
at flight altitudes between 7 and 12 km. These flights in the UT/LS were launched from
Hohn Airforce Base in Northern Germany with the Learjet 35A operated byenviscope
GmbH.
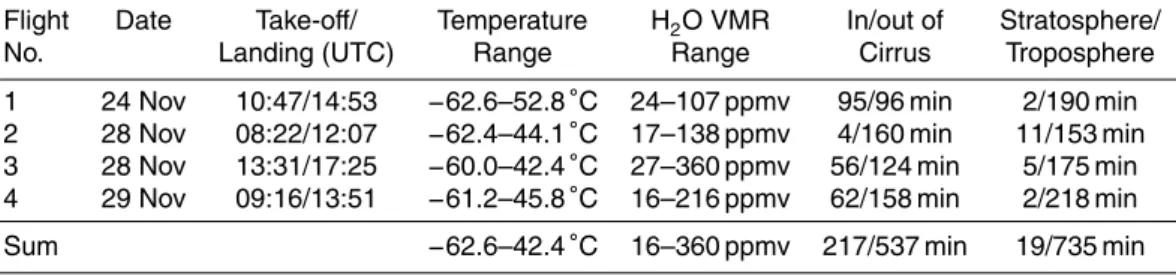
For the sensor intercomparison studies CIRRUS-III provided 4 flights (see Table 1).
The dataset consists of approx. 13 flight hours in air masses colder than −40◦C at
15
cruise altitude, approx. 4 flight hours in cirrus clouds and 9 flight hours out of clouds. Furthermore, stratospherically influenced air masses have been sampled for 19 min with ozone VMR above 125 ppmv measured by the dual-beam UV-absorption ozone photometer JOE (Jülich Ozone Experiment) instrument (Mottaghy, 2001). Two flights had to be discarded due to inlet heating problems at the reference instrument. An 20
overview of the individual flights is provided in Table 1.
3.2 Instrumentation
During the CIRRUS-III field campaign, sophisticated instruments were operated on board of the aircraft to characterize the air masses probed during flight patterns in frontal cirrus clouds. An important part of the instrumentation was dedicated to 25
AMTD
7, 9803–9838, 2014Evaluation of MOZAIC Capacitive
Hygrometer
P. Neis et al.
Title Page
Abstract Introduction
Conclusions References
Tables Figures
◭ ◮
◭ ◮
Back Close
Full Screen / Esc
Printer-friendly Version Interactive Discussion
Discussion
P
a
per
|
Discus
sion
P
a
per
|
Discussion
P
a
per
|
Discussion
P
a
per
|
included a MCH and an open path tunable diode laser system (OJSTER; MayComm Instruments, May and Webster, 1993; Krämer et al., 2009) to measure gas phase
wa-ter vapour VMR. Simultaneously, total wawa-ter VMR (= gas phase plus ice water) was
measured by the reference measurement instrument FISH (Fast In-Situ Hygrometer,
Zöger et al., 1999). The closed-cell Lyman-α fluorescence hygrometer was equipped
5
with a forward facing inlet to sample gas phase water in clear sky and total water inside cirrus clouds. To determine whether a data point is in a cirrus cloud or not, the ratio
of RHice from FISH (total water) and OJSTER (water vapour) was used (see Krämer
et al., 2009). FISH was calibrated using a laboratory calibration facility with the capa-bility to simulate realistic atmospheric conditions, i.e. water vapour VMR from several 10
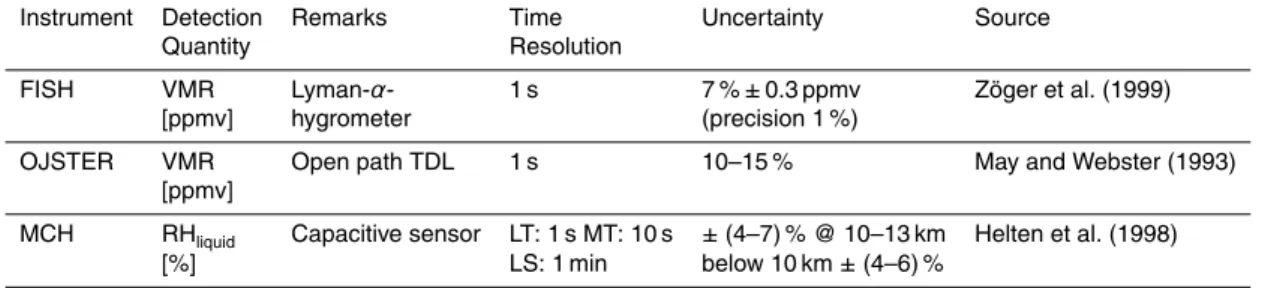
hundred to a few ppmv and pressure from 1000 to 10 hPa. Finally, the water vapour mixing ratio was determined using a commercial dew point hygrometer (MBW DP30). The instruments and the parameters derived from their measurements are listed in Table 2.
Prior to the CIRRUS-III campaign the MCH has been (pre-flight) calibrated in the 15
simulation chamber at Forschungszentrum Jülich following the procedures briefly de-scribed in chapter 2. Unfortunately a post-flight calibration was not possible due to sensor failure after de-installation of the MCH from the Learjet aircraft at the end of the campaign. From long term experiences of MOZAIC pre- and post-flight calibrations it is well known that over the three months period between the pre-flight calibration and the 20
end of the campaign the offseta(T) can change significantly while the sensitivityb(T) is almost stable over time (see Eq. (3) and Smit et al., 2008). In order to determine the potential drift of the offset a(T) between pre-flight calibration and the end of the campaign the so called in-flight calibration (IFC) method (Smit et al., 2008) has been applied.
25
AMTD
7, 9803–9838, 2014Evaluation of MOZAIC Capacitive
Hygrometer
P. Neis et al.
Title Page
Abstract Introduction
Conclusions References
Tables Figures
◭ ◮
◭ ◮
Back Close
Full Screen / Esc
Printer-friendly Version Interactive Discussion
Discussion
P
a
per
|
Discus
sion
P
a
per
|
Discussion
P
a
per
|
Discussion
P
a
per
|
stratospherically influenced air masses was about 20±1 ppmv as measured by the
FISH instrument. Its resulting contribution to the RHliquid-signal of the MCH is minimal.
Compared to the pre-flight calibration an offset drift of (4.5±1) % RHliquid was found.
The RHliquid-flight data of the MCH obtained during the CIRRUS-III campaign have
been corrected for this offset drift. The resulting overall uncertainty of the RH measure-5
ments by the MCH, including contributions from temperature uncertainties, is about
±5 % RHliquid which is in good agreement with the mean uncertainty range obtained
from long term MOZAIC-measurements (Smit et al., 2014).
4 Results
4.1 Case study – flight 2
10
The instrumentation deployed in CIRRUS-III allows an in-flight intercomparison of all water vapour instruments. Figure 4 illustrates an example of the kind of data collected during one research flight on 28 November 2006 (Flight 2). Data from the water vapour sensing instruments used for the intercomparison are shown as VMR. The ambient
temperaturesTambient encountered during the flight ranged from−44.1
◦
C to −62.4◦C 15
for relevant measurement altitudes. Respective water vapour VMR covered the range from 17 ppmv at the tropopause to approx. 150 ppmv in the free troposphere and even higher values during ascent from and descent into the airport.
For the instrument intercomparison we analysed the sensors with respect to RHliquid
since this is the parameter the MCH is calibrated against in the sensor temperature 20
range (see Sect. 2). Further, data for water vapour VMR>1000 ppmv were excluded
in this study because the FISH instrument becomes optically thick and thus insensitive at these conditions (Zöger et al., 1999).
In Fig. 5, we compare RHliquiddata and VMR data from MCH (red line) and gas-phase
reference (blue line), i.e. OJSTER data in cloud, otherwise FISH data for a complete 25
AMTD
7, 9803–9838, 2014Evaluation of MOZAIC Capacitive
Hygrometer
P. Neis et al.
Title Page
Abstract Introduction
Conclusions References
Tables Figures
◭ ◮
◭ ◮
Back Close
Full Screen / Esc
Printer-friendly Version Interactive Discussion
Discussion
P
a
per
|
Discus
sion
P
a
per
|
Discussion
P
a
per
|
Discussion
P
a
per
|
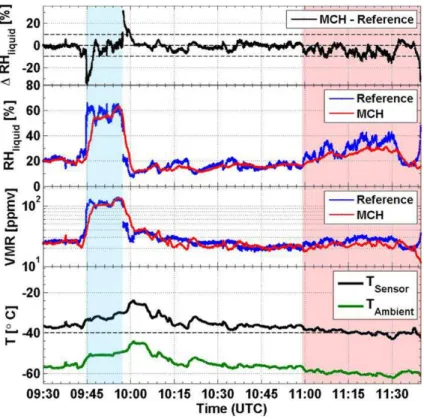
well as the sensor temperature Tsensor (black line) measured at the MCH inside the
Rosemount housing are shown in the bottom panel. Largest deviations of the MCH to the reference (see e.g.∆RHliquidin the top pannel) are found in clear sky air masses for
cold conditions with sensor temperatureTsensor<−40 ◦
C (this corresponds to ambient
temperature below approx.−60◦C atM=0.70). Except for these extreme conditions,
5
the difference between the MCH and the reference is of the order of 10 % RHliquid or
less. It has to be noted that regular operation conditions of the MCH aboard
long-haul passenger aircraft like A340-300 with a cruising speed of approx. M=0.81 are
characterised by sensor temperature Tsensor≥ −35
◦
C (Helten et al., 1998), whereas during the operation aboard the slower flying Learjet 35A (cruising speed< M=0.70) 10
sensor temperatureTsensor values≤ −40
◦
C were reached since∆T increases withM
(see Fig. 2). Given the fact that during CIRRUS-III the MCH was operated at its lower limit of performance, the agreement with the research-grade reference instruments is remarkably good.
4.2 Assessment of sensor characteristics
15
4.2.1 Evaluation against reference
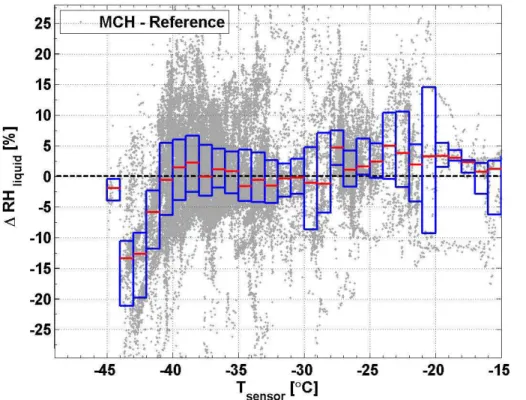
In order to prepare a data set for evaluation, data with sensor temperaturesTsensor<
−40◦C were excluded because of too dry measurement conditions which were below
the MCH calibration limits (see Sect. 2). This fact is illustrated in Fig. 6 showing the
difference in RHliquid between MCH and reference instruments, i.e. OJSTER data in
20
cloud, otherwise FISH data, according to sensor temperature Tsensor. A first overall
good agreement of the two sensors down to the calibration limit of −40◦C can be
stated in the range of±5 %. Furthermore, the maximum ambient temperatureTambient
was set to the level of instantaneous freezing of−40◦C in order to neglect effects of warmer clouds.
25
AMTD
7, 9803–9838, 2014Evaluation of MOZAIC Capacitive
Hygrometer
P. Neis et al.
Title Page
Abstract Introduction
Conclusions References
Tables Figures
◭ ◮
◭ ◮
Back Close
Full Screen / Esc
Printer-friendly Version Interactive Discussion
Discussion
P
a
per
|
Discus
sion
P
a
per
|
Discussion
P
a
per
|
Discussion
P
a
per
|
passenger aircraft. To obtain information about the MCH performance relevant for the MOZAIC data set, i.e. for nearly constant flight levels with moderately slow changes in temperature and humidity, the flight altitude for CIRRUS-III was smoothed over 90 s time intervals, and in case altitude changes exceeded∆z >6 m in 5 s the respective data points were excluded from the intercomparison.
5
The correlation between MCH and reference RHliquiddata from FISH (clear sky) and
OJSTER (in-cirrus) is shown in Fig. 7. The bottom panel shows the 1 Hz data scatter plot for the data set reduced to MOZAIC-relevant conditions (herafter referred to as “re-duced dataset”). Linear regression analysis yields a correlation coefficient ofR2=0.92 with an offset of 0.18±0.09 % RHliquid and a slope of 1.00±0.002. The deviations of 10
the MCH from reference RHliquiddata are represented in the upper panel for 1 Hz data
points. Additionally, the deviations are grouped into 5 % RHliquid bins corresponding
to the previously determined precision of the MCH of 5 % RHliquid (see Sect. 3.2 and
Helten et al., 1999). Red lines in the box and whisker plots represent the median devi-ation for each bin. For the statistically relevant bins, i.e. bins with more than 100 data 15
points, median deviations fall within±5 % RHliquid (see also Table 3).
A more statistically based view on the data set is shown in Fig. 8, where the
corre-lation between the sensors averaged for 5 % RHliquid bins is shown. The MCH agrees
very well with the reference instruments over the entire range of values measured in the cloud-free atmosphere (see also Table 4). Inside cirrus clouds, i.e. RHliquid> ap-20
prox. 60 %, the sensors deviate as expected since the reference measures total water while the MCH measures gas-phase water. Linear regression analysis provides a cor-relation coefficient ofR2=0.97 with an offset of 2.20±2.00 % RHliquid and a slope of
0.96±0.05. Median values and almost all of the 25th and 75th percentiles fall within
the±5 % RHliquidrange around the linear regression line, which confirms the previously
25
determined MCH uncertainty of 5 % RHliquid.
For a better understanding of an uncertainty of 5 % RHliquidFig. 9 shows water vapour
VMR as a function of temperature for 5 % and 10 % RHliquidfor pressure levels at typical
AMTD
7, 9803–9838, 2014Evaluation of MOZAIC Capacitive
Hygrometer
P. Neis et al.
Title Page
Abstract Introduction
Conclusions References
Tables Figures
◭ ◮
◭ ◮
Back Close
Full Screen / Esc
Printer-friendly Version Interactive Discussion
Discussion
P
a
per
|
Discus
sion
P
a
per
|
Discussion
P
a
per
|
Discussion
P
a
per
|
220 hPa a measured RHliquid=5 % with an uncertainty of 5 % RHliquid corresponds to
a VMR of approx. 5 ppmv±5 ppmv.
The proof of validity of the MCH RHliquiddata is shown in Fig. 10. As is shown in the
bottom panel, the probability distribution function (PDF) for RHliquid derived from MCH data agree very well with those derived from the reference for the entire data set. Larger 5
deviations at higher values of RHliquid, e.g. at possible cirrus cloud edges reflect the fact
that the reference instrument FISH measures total water and the data are not classified as cirrus cloud by the algorithm of Krämer et al. (2009). The sensor behaviour for those conditions at the limit of the sensor operation specifications is analysed in detail in the following section.
10
4.2.2 Sensor characterisitcs at the limit of its operation range
The comparison between the MCH RHliquid data and the reference RHliquid data, i.e.
OJSTER data in cloud, otherwise FISH data, during the CIRRUS-III field study shows a remarkably good agreement for the reduced data set. However, the performance of the MCH sensor in conditions at its limits of operation, e.g. next to the lower calibration 15
limit ofTsensor=−40 ◦
C or during strong humidity changes has to be analysed in detail in order to assess the sensor’s operation range. For this purpose, the time series of Flight 2 is revisited in Fig. 11, where the individual RHliquid time series are given in the upper panel, the 60 s moving average of the difference of both RHliquid time series in
the middle panel, as well as theTsensortime series in the bottom panel.
20
The following 3 phases of interest have to be analysed:
– Phase 1 is shaded in blue colour illustrates a strong humidity change while flying
through a cirrus cloud. Because of slower MCH sensor response at colder
sen-sor temperatures, the MCH RHliquid values (green line) can not follow the rapid
changes in RHliquid as observed by the reference (blue line). However, as was
25
AMTD
7, 9803–9838, 2014Evaluation of MOZAIC Capacitive
Hygrometer
P. Neis et al.
Title Page
Abstract Introduction
Conclusions References
Tables Figures
◭ ◮
◭ ◮
Back Close
Full Screen / Esc
Printer-friendly Version Interactive Discussion
Discussion
P
a
per
|
Discus
sion
P
a
per
|
Discussion
P
a
per
|
Discussion
P
a
per
|
– Phase 2 is shaded in red and refers to a section of the flight whenTsensorreaches
values below the sensor calibration limit ofTsensor=−40 ◦
C, i.e. ambient
tempera-tures below−70◦C at commercial aircraft speed of Mach-numberM=0.81. The
MCH shows reduced performance and increasing deviations between the MCH and the reference instruments occur.
5
– Phase 3 shaded in grey refers to mixed conditions with isolated rapid humidity
changes, while flying through small cirrus clouds those rapid RHliquidchanges are
superimposed by strong temperature changes because of the aircraft ascent to measurement altitude and the occurrence of temperatures below the calibration limit, which both cause a reduction of the MCH time resolution.
10
Despite of reduced sensor response to conditions at the limit of its operation range, the MCH shows a very good overall performance during the CIRRUS-III field study. Figure 12 compares frequency of occurrence (top panel) and PDF (bottom panel) of RHliquid based on 5 % RHliquid bins of the complete MCH data set, i.e. all data points
above the homogenous freezing threshold ofTambient=−40
◦
C, with those of the data 15
set reduced to MOZAIC-relevant conditions. The comparison of the observed RHliquid
counts and PDF per 5 % bin demonstrates the equivalence of the statistical distribution of RHliquidof both data sets. Main quantitative deviations are observed in the transition
region between clear sky (<25 % RHliquid) and next to cirrus clouds (>50 % RHliquid)
during rapid changes in flight altitude at very cold conditions and therefore with a longer 20
sensor response time at flight sequences into and out of cirrus clouds.
Figure 13 shows the PDF of water vapour VMR data as a function ofTambient(panels
a–c for the complete data set and panels d–f for the reduced data set, respectively)
according to Kunz et al. (2008). The frequencies of occurrence are calculated in 1◦C
bins for the MCH data set (panels a and d), the reference data set (panels b and e) 25
AMTD
7, 9803–9838, 2014Evaluation of MOZAIC Capacitive
Hygrometer
P. Neis et al.
Title Page
Abstract Introduction
Conclusions References
Tables Figures
◭ ◮
◭ ◮
Back Close
Full Screen / Esc
Printer-friendly Version Interactive Discussion
Discussion
P
a
per
|
Discus
sion
P
a
per
|
Discussion
P
a
per
|
Discussion
P
a
per
|
The MCH seems to remain at dryer values for the coldest temperatures ofTambient∼=
−60◦C, which is again a result of the delayed sensor response at sensor temperatures
below the calibration limit. Further, small deviations at lower temperatures are also observed. In summary data sets for both cases show a similar behaviour in the water vapour VMR distribiution with only small deviations but as shown before in Fig. 12 these 5
deviations have no statistically significant relevance.
5 Conclusions and recommendations
The CIRRUS-III (2006) aircraft campaign provided a data set for evaluating the MOZAIC Capacitive Hygrometer (MCH) in a blind intercomparison with high perfor-mance water vapour instruments based on tunable diode laser absorption spectrome-10
try (in-cloud reference) and Lyman-αfluorescence detection (clear sky reference).
Except for conditions at its operation limit (e.g., at sensor temperatures Tsensor<
−40◦C and during rapid changes in RHliquid), the MCH performes with a difference of 10 % RHliquidor less to the references, i.e. OJSTER data in cloud, otherwise FISH data.
In order to obtain a representative result for the MCH’s uncertainty for its regular 15
deployment aboard passenger aircraft, the data set was restricted to more MOZAIC
relevant conditions: data with sensor temperatures below−40◦C were excluded due to
the calibration limit. In MOZAIC less than 1 % of RH observations are made at sensor
temperatures colder than−40◦C. Strong ascent and descent sequences of the aircraft
were removed and the maximum ambient temperature (Tambient) was set to−40
◦
C to 20
exclude effects of warm clouds.
The 1 Hz correlation yielded a robust linear fit with a slope of unity, with no statistically significant offset and a correlation coefficient ofR2=0.92 which was confirmed by the correlation of the binned RHliquid data. The RHliquid data grouped in 5 % RHliquid bins
agree very well for the MCH and reference instruments over the entire cloud-free range 25
AMTD
7, 9803–9838, 2014Evaluation of MOZAIC Capacitive
Hygrometer
P. Neis et al.
Title Page
Abstract Introduction
Conclusions References
Tables Figures
◭ ◮
◭ ◮
Back Close
Full Screen / Esc
Printer-friendly Version Interactive Discussion
Discussion
P
a
per
|
Discus
sion
P
a
per
|
Discussion
P
a
per
|
Discussion
P
a
per
|
Comparing the MCH’s and references’ probability distribution functions (PDF) for RHliquidshows no statistically significant effect of delayed sensor response because of
the limitations of the MCH. Neither strong humidity changes, nor operation at the lower calibration limits causes considerable sensor failures. The main limitation for the use
of MCH RHliquid data are related to sensor temperatures below the calibration limit of
5
Tsensor=−40 ◦
C. However, these temperatures are encountered only infrequently in the MOZAIC programme as long as the current flight tracks don’t reach polar air masses
with ambient temperatures below−70◦C. In summary, the MCH is highly suitable for
climatology analyses in the MOZAIC programme even if the sensor is not applicable to high time resolution measurements.
10
A value for the limit of detection is not appropriate for the MCH, but the variable
to describe its performance is the here determined uncertainty of the RHliquid
mea-surements. RHliquid measurements below 5 %, which are common in the lowermost
stratosphere, have to be used carefully because these data are close to the sensor uncertainty range, which as shown before in Sect. 4.2.1, results in a relative deviation 15
of 100 %.
Acknowledgements. The authors gratefully acknowledge Peter Spichtinger (Mainz Univ.) for
fruitful discussions. The support byenviscopeGmbH at the technichal organization of the field study is also appreciated. Part of this work was funded by the German Federal Ministry for Research and Education (BMBF) in the framework of the joint programme IAGOS-D under 20
Grant No. 01LK1223A.
The service charges for this open access publication have been covered by a Research Centre of the Helmholtz Association.
AMTD
7, 9803–9838, 2014Evaluation of MOZAIC Capacitive
Hygrometer
P. Neis et al.
Title Page
Abstract Introduction
Conclusions References
Tables Figures
◭ ◮
◭ ◮
Back Close
Full Screen / Esc
Printer-friendly Version Interactive Discussion
Discussion
P
a
per
|
Discus
sion
P
a
per
|
Discussion
P
a
per
|
Discussion
P
a
per
|
References
Bange, J., Esposito, M., Lenschow, D. H., Brown, P. R. A., Dreiling, V., Giez, A., Mahrt, L., Malinowski, S. P., Rodi, A. R., Shaw, R. A., Siebert, H., Smit, H., and and Zöger, M.: Measurement of Aircraft State and Thermodynamic and Dynamic Variables, in: Air-borne Measurements for Environmental Research: Methods and Instruments, edited by: 5
Wendisch, M. and Brenguier, J.-L., Wiley-VCH Verlag GmbH & Co. KGaA, Weinheim, Ger-many, doi:10.1002/9783527653218.ch2, 2013. 9823
Gierens, K., Schumann, U., Smit, H., Helten, M., and Zangl, G.: Determination of humid-ity and temperature fluctuations based on MOZAIC data and parametrisation of persis-tent contrail coverage for general circulation models, Ann. Geophys., 15, 1057–1066, 10
doi:10.1007/s00585-997-1057-3, 1997. 9805
Gierens, K., Schumann, U., Helten, M., Smit, H., and Marenco, A.: A distribution law for rela-tive humidity in the upper troposphere and lower stratosphere derived from three years of MOZAIC measurements, Ann. Geophys., 17, 1218–1226, doi:10.1007/s00585-999-1218-7, 1999. 9805
15
Gierens, K., Schumann, U., Helten, M., Smit, H., and Wang, P.: Ice-supersaturated regions and subvisible cirrus in the northern midlatitude upper troposphere, J. Geophys. Res.-Atmos., 105, 22743–22753, doi:10.1029/2000JD900341, 2000. 9805
Goff, J. A. and Gratch, S.: Low-pressure properties of water from-160 to 212 F, Trans. Amer. Soc. Heat. Vent. Eng., 51, 125–164, 1946. 9807
20
Helten, M., Smit, H., Strater, W., Kley, D., Nedelec, P., Zoger, M., and Busen, R.: Cali-bration and performance of automatic compact instrumentation for the measurement of relative humidity from passenger aircraft, J. Geophys. Res.-Atmos., 103, 25643–25652, doi:10.1029/98JD00536, International Workshop on Biogenic Hydrocarbons in the Atmo-spheric Boundary Layer, Univ. Virginia, Charlottesville, VA, August 1997, 1998. 9805, 9807, 25
9808, 9812, 9823, 9826, 9827
Helten, M., Smit, H., Kley, D., Ovarlez, J., Schlager, H., Baumann, R., Schumann, U., Ned-elec, P., and Marenco, A.: In-flight comparison of MOZAIC and POLINAT water vapor measurements, J. Geophys. Res.-Atmos., 104, 26087–26096, doi:10.1029/1999JD900315, 1999. 9805, 9806, 9809, 9813
AMTD
7, 9803–9838, 2014Evaluation of MOZAIC Capacitive
Hygrometer
P. Neis et al.
Title Page
Abstract Introduction
Conclusions References
Tables Figures
◭ ◮
◭ ◮
Back Close
Full Screen / Esc
Printer-friendly Version Interactive Discussion
Discussion
P
a
per
|
Discus
sion
P
a
per
|
Discussion
P
a
per
|
Discussion
P
a
per
|
Kley, D. and Stone, E.: Measurement of water-vapor in stratosphere by photo-dissociation with ly-alpha-(1216 A) light, Rev. Sci. Instrum., 49, 691–697, doi:10.1063/1.1135596, 1978. 9808 Kley, D., Smit, H. G. J., Nawrath, S., Luo, Z., Nedelec, P., and Johnson, R. H.: Tropical Atlantic convection as revealed by ozone and relative humidity measurements, J. Geophys. Res.-Atmos., 112, D23109, doi:10.1029/2007JD008599, 2007. 9805
5
Krämer, M., Schiller, C., Afchine, A., Bauer, R., Gensch, I., Mangold, A., Schlicht, S., Spel-ten, N., Sitnikov, N., Borrmann, S., de Reus, M., and Spichtinger, P.: Ice supersaturations and cirrus cloud crystal numbers, Atmos. Chem. Phys., 9, 3505–3522, doi:10.5194/acp-9-3505-2009, 2009. 9810, 9814
Kunz, A., Schiller, C., Rohrer, F., Smit, H. G. J., Nedelec, P., and Spelten, N.: Statistical analysis 10
of water vapour and ozone in the UT/LS observed during SPURT and MOZAIC, Atmos. Chem. Phys., 8, 6603–6615, doi:10.5194/acp-8-6603-2008, 2008. 9815
Luo, Z., Kley, D., Johnson, R. H., and Smit, H.: Ten years of measurements of tropical upper-tropospheric water vapor by MOZAIC. Part I: Climatology, variability, transport, and relation to deep convection, J. Climate, 20, 418–435, doi:10.1175/JCLI3997.1, 2007. 9805
15
Luo, Z., Kley, D., Johnson, R. H., and Smit, H.: Ten years of measurements of tropical upper-tropospheric water vapor by MOZAIC. Part II: Assessing the ECMWF humidity analysis, J. Climate, 21, 1449–1466, doi:10.1175/2007JCLI1887.1, 2008. 9805
Marenco, A., Thouret, V., Nedelec, P., Smit, H., Helten, M., Kley, D., Karcher, F., Simon, P., Law, K., Pyle, J., Poschmann, G., Von Wrede, R., Hume, C., and Cook, T.: Measurement 20
of ozone and water vapor by Airbus in-service aircraft: the MOZAIC airborne program, an overview, J. Geophys. Res.-Atmos., 103, 25631–25642, doi:10.1029/98JD00977, Interna-tional Workshop on Biogenic Hydrocarbons in the Atmospheric Boundary Layer, Univ. Vir-ginia, Charlottesville, VA, August 1997, 1998. 9805
May, R. and Webster, C.: Data-processing and calibration for tunable diode-laser har-25
monic absorption spectrometers, J. Quant. Spetrosc. Ra., 49, 335–347, doi:10.1016/0022-4073(93)90098-3, 1993. 9810, 9823
Mottaghy, D.: Ozonmessungen in der unteren Stratosphäre, Master’s thesis, Rheinisch-Westfälische Technische Hochschule Aachen, in cooperation with the Institute for Chemistry and Dynamics of the Geosphere, ICG-1: Stratosphere, 2001. 9809
30
AMTD
7, 9803–9838, 2014Evaluation of MOZAIC Capacitive
Hygrometer
P. Neis et al.
Title Page
Abstract Introduction
Conclusions References
Tables Figures
◭ ◮
◭ ◮
Back Close
Full Screen / Esc
Printer-friendly Version Interactive Discussion
Discussion
P
a
per
|
Discus
sion
P
a
per
|
Discussion
P
a
per
|
Discussion
P
a
per
|
Forschungsbericht 2012-17, Deutsches Zentrum für Luft- und Raumfahrt, Oberpfaffenhofen, Germany, 69–76, 2013. 9805
Schlager, H., Konopka, P., Schulte, P., Schumann, U., Ziereis, H., Arnold, F., Klemm, M., Hagen, D., Whitefield, P., and Ovarlez, J.: In situ observations of air traffic emission sig-natures in the North Atlantic flight corridor, J. Geophys. Res.-Atmos., 102, 10739–10750, 5
doi:10.1029/96JD03748, 1997. 9805
Schumann, U.: Pollution from aircraft emissions in the North Atlantic flight corridor (POLINAT), vol. Air Pollut. Res. Rep. 58, Rep. EUR 16978 EN, Europ. Commission, Luxembourg, 1997. 9805
Smit, H., Sträter, W., Helten, M., and Kley, D.: Environmental Simulation Facility to Cali-10
brate Airborne Ozone and Humidity Sensors, Tech. rep., Report No. 3796, Berichte des Forschungszentrums Jülich, 2000. 9808
Smit, H. G. J., Volz-Thomas, A., Helten, M., Paetz, W., and Kley, D.: An in-flight calibration method for near-real-time humidity measurements with the airborne MOZAIC sensor, J. At-mos. Ocean. Tech., 25, 656–666, doi:10.1175/2007JTECHA975.1, 2008. 9805, 9808, 9810 15
Smit, H. G. J., Rohs, S., Neis, P., Boulanger, D., Krämer, M., Wahner, A., and Petzold, A.: Tech-nical Note: Reanalysis of upper troposphere humidity data from the MOZAIC programme for the period 1994 to 2009, Atmos. Chem. Phys. Discuss., 14, 18905–18942, doi:10.5194/acpd-14-18905-2014, 2014. 9805, 9811
Sonntag, D.: Advancements in the field of hygrometry, Meteorol. Z., 3, 51–66, 1994. 9808 20
Spichtinger, P., Gierens, K., Leiterer, U., and Dier, H.: Ice supersaturation in the tropopause region over Lindenberg, Germany, Meteorol. Z., 12, 143–156, doi:10.1127/0941-2948/2003/0012-0143, 2003. 9805
Stickney, T. M., Shedlov, M., and Thompson, D. I.: Rosemount total temperature sensors, Tech. rep., Tech. Rep. 5755, Revision B, Aerosp. Div. Rosemount Inc., 1990. 9806
25
Stocker, T. F., Qin, D., Plattner, G.-K., Tignor, M., Allen, S. K., Boschung, J., Nauels, A., Xia, Y., Bex, V., and Midgley, P. M.: Climate change 2013: the Physical Science Basis, Intergovern-mental Panel on Climate Change, Working Group I Contribution to the IPCC Fifth Assess-ment Report (AR5), Cambridge Univ. Press, New York, 2013. 9804
WMO: World Meteorological Organization: measurement of atmospheric humidity, Tech. rep., 30
AMTD
7, 9803–9838, 2014Evaluation of MOZAIC Capacitive
Hygrometer
P. Neis et al.
Title Page
Abstract Introduction
Conclusions References
Tables Figures
◭ ◮
◭ ◮
Back Close
Full Screen / Esc
Printer-friendly Version Interactive Discussion
Discussion
P
a
per
|
Discus
sion
P
a
per
|
Discussion
P
a
per
|
Discussion
P
a
per
|
Zöger, M., Afchine, A., Eicke, N., Gerhards, M., Klein, E., McKenna, D., Morschel, U., Schmidt, U., Tan, V., Tuitjer, F., Woyke, T., and Schiller, C.: Fast in situ stratospheric hygrom-eters: a new family of balloon-borne and airborne Lyman alpha photofragment fluorescence hygrometers, J. Geophys. Res.-Atmos., 104, 1807–1816, doi:10.1029/1998JD100025, 1999. 9810, 9811, 9823
AMTD
7, 9803–9838, 2014Evaluation of MOZAIC Capacitive
Hygrometer
P. Neis et al.
Title Page
Abstract Introduction
Conclusions References
Tables Figures
◭ ◮
◭ ◮
Back Close
Full Screen / Esc
Printer-friendly Version Interactive Discussion
Discussion
P
a
per
|
Discus
sion
P
a
per
|
Discussion
P
a
per
|
Discussion
P
a
per
|
Table 1.CIRRUS-III flight overview at cruise altitude. Air masses are devided into “troposphere” and “stratosphere” with the ozone VMR threshold of 125 ppmv.
Flight Date Take-off/ Temperature H2O VMR In/out of Stratosphere/
No. Landing (UTC) Range Range Cirrus Troposphere
1 24 Nov 10:47/14:53 −62.6–52.8◦
C 24–107 ppmv 95/96 min 2/190 min 2 28 Nov 08:22/12:07 −62.4–44.1◦
C 17–138 ppmv 4/160 min 11/153 min 3 28 Nov 13:31/17:25 −60.0–42.4◦
C 27–360 ppmv 56/124 min 5/175 min 4 29 Nov 09:16/13:51 −61.2–45.8◦
C 16–216 ppmv 62/158 min 2/218 min
Sum −62.6–42.4◦
AMTD
7, 9803–9838, 2014Evaluation of MOZAIC Capacitive
Hygrometer
P. Neis et al.
Title Page
Abstract Introduction
Conclusions References
Tables Figures
◭ ◮
◭ ◮
Back Close
Full Screen / Esc
Printer-friendly Version Interactive Discussion
Discussion
P
a
per
|
Discus
sion
P
a
per
|
Discussion
P
a
per
|
Discussion
P
a
per
|
Table 2.Instruments and parameters used during CIRRUS-III field campaign (FISH: Fast in situ Stratospheric Hygrometer; OJSTER: Open path Jülich Stratospheric Tdl ExpeRiment; MCH: MOZAIC Capacitive Hygrometer; LT: lower troposphere; UT: upper troposphere; LS: lower stratosphere).
Instrument Detection Remarks Time Uncertainty Source
Quantity Resolution
FISH VMR Lyman-α- 1 s 7 %±0.3 ppmv Zöger et al. (1999) [ppmv] hygrometer (precision 1 %)
OJSTER VMR Open path TDL 1 s 10–15 % May and Webster (1993) [ppmv]
MCH RHliquid Capacitive sensor LT: 1 s MT: 10 s ±(4–7) % @ 10–13 km Helten et al. (1998)
[%] LS: 1 min below 10 km±(4–6) %
AMTD
7, 9803–9838, 2014Evaluation of MOZAIC Capacitive
Hygrometer
P. Neis et al.
Title Page
Abstract Introduction
Conclusions References
Tables Figures
◭ ◮
◭ ◮
Back Close
Full Screen / Esc
Printer-friendly Version Interactive Discussion
Discussion
P
a
per
|
Discus
sion
P
a
per
|
Discussion
P
a
per
|
Discussion
P
a
per
|
Table 3.Medians, 25th/75th percentiles and counts of∆RHliquid (MCH-reference). Data were classified into 5 % RHliquidbins relating to the reference, i.e. OJSTER data in cloud, otherwise FISH data.
0–5 % 5–10 % 10–15 % 15–20 % 20–25 % 25–30 % 30–35 % 35–40 % 40–45 %
∆RHliquid[%] – 3.0+0.2 −0.4 1.0+
1.6 −1.1 0.4+
2.2
−2.9 −1.8+ 2.4 −2.7 −2.3+
5.5 −2.8 −0.1+
5.2 −4.4 3.7+
3.4
−7.3 3.9+ 4.2 −2.9
counts [#] – 13 1276 4037 2335 1471 1606 776 569
45–50 % 50–55 % 55–60 % 60–65 % 65–70 % 70–75 % 75–80 % 80–85 % 85–90 %
∆RHliquid[%] 5.4+3.5 −3.1 4.2+
2.6 −2.9 1.7+
3.8 −4.2 0.4+
3.7
−2.8 −0.8+ 2.7 −3.3 −3.3+
2.9 −2.8 −7.7+
3.8
−4.0 −12.3+ 3.8 −7.1 −8.9+
0.8 −0.8
AMTD
7, 9803–9838, 2014Evaluation of MOZAIC Capacitive
Hygrometer
P. Neis et al.
Title Page
Abstract Introduction
Conclusions References
Tables Figures
◭ ◮
◭ ◮
Back Close
Full Screen / Esc
Printer-friendly Version Interactive Discussion
Discussion
P
a
per
|
Discus
sion
P
a
per
|
Discussion
P
a
per
|
Discussion
P
a
per
|
Table 4.Medians, 25th/75th percentiles of RHliquid of MCH and reference, respectively. Data were classified into 5 % RHliquidbins relating to the reference, i.e. FISH (clear sky) and OJSTER (in-cirrus).
0–5 % 5–10 % 10–15 % 15–20 % 20–25 % 25–30 % 30–35 % 35–40 % 40–45 %
RHliquid[%]
MCH – 12.2+0.4
−0.7 14.7+ 1.1 −1.4 17.5+
2.2 −2.2 20.4+
1.9 −2.5 24.8+
6.9 −3.5 31.9+
6.2 −3.7 41.6+
2.9 −8.9 46.4+
4.9 −3.9
reference – 9.6+−1.20.4 13.9+−1.40.6 17.2+−1.01.3 22.0−1.2+1.5 26.9+−1.11.5 32.5−1.2+1.2 37.0+−1.11.4 42.5+−1.21.2
45–50 % 50–55 % 55–60 % 60–65 % 65–70 % 70–75 % 75–80 % 80–85 % 85–90 %
RHliquid[%]
MCH 53.6+−3.52.9 56.9+−2.63.0 58.8+−3.84.1 62.7+−2.33.8 67.0−3.8+2.1 68.7+−2.72.1 69.3−4.4+3.1 69.1+−7.22.8 77.1+−0.60.1
AMTD
7, 9803–9838, 2014Evaluation of MOZAIC Capacitive
Hygrometer
P. Neis et al.
Title Page
Abstract Introduction
Conclusions References
Tables Figures
◭ ◮
◭ ◮
Back Close
Full Screen / Esc
Printer-friendly Version Interactive Discussion
Discussion
P
a
per
|
Discus
sion
P
a
per
|
Discussion
P
a
per
|
Discussion
P
a
per
|
H2 O-Sensor
AIRCRAFT SKIN SENSORS
RH : HUMICAP-H T : PT100
DEICING HEATER BOUNDARY LAYERS
CONTROL HOLES
RIGHT ANGLE PRODUCES
PARTICLE SEPARATION
CAP
AMTD
7, 9803–9838, 2014Evaluation of MOZAIC Capacitive
Hygrometer
P. Neis et al.
Title Page
Abstract Introduction
Conclusions References
Tables Figures
◭ ◮
◭ ◮
Back Close
Full Screen / Esc
Printer-friendly Version Interactive Discussion
Discussion
P
a
per
|
Discus
sion
P
a
per
|
Discussion
P
a
per
|
Discussion
P
a
per
|
Figure 2.Sampled air flow is heated through adiabatic heating effects when entering the inlet. ∆Temperature describes the increase relative to the ambient temperature Tambient (Static Air
AMTD
7, 9803–9838, 2014Evaluation of MOZAIC Capacitive
Hygrometer
P. Neis et al.
Title Page
Abstract Introduction
Conclusions References
Tables Figures
◭ ◮
◭ ◮
Back Close
Full Screen / Esc
Printer-friendly Version Interactive Discussion
Discussion
P
a
per
|
Discus
sion
P
a
per
|
Discussion
P
a
per
|
Discussion
P
a
per
|
Figure 5.Top-down:∆RHliquid(MCH-reference), RHliquidand VMR measured by the MCH (red) and the reference (blue), i.e. FISH (clear sky) and OJSTER (in-cirrus), as a function of flight time during flight 2 on 28 November 2006. Sensor temperatureTsensor(black) as well as ambient
temperatureTambient(green) are shown in the bottom panel of the figure. The blue-shaded area
AMTD
7, 9803–9838, 2014Evaluation of MOZAIC Capacitive
Hygrometer
P. Neis et al.
Title Page
Abstract Introduction
Conclusions References
Tables Figures
◭ ◮
◭ ◮
Back Close
Full Screen / Esc
Printer-friendly Version Interactive Discussion
Discussion
P
a
per
|
Discus
sion
P
a
per
|
Discussion
P
a
per
|
Discussion
P
a
per
|
Figure 6.Differences in relative humidity RHliquid of MCH and reference, i.e. FISH (clear sky) and OJSTER (in-cirrus), are scattered against the sensor temperatureTsensor. A drift towards
too dry MCH measurements below the calibration limit of−40◦
C is clearly seen. The median values (red lines in the box) of the 1◦
AMTD
7, 9803–9838, 2014Evaluation of MOZAIC Capacitive
Hygrometer
P. Neis et al.
Title Page
Abstract Introduction
Conclusions References
Tables Figures
◭ ◮
◭ ◮
Back Close
Full Screen / Esc
Printer-friendly Version Interactive Discussion
Discussion
P
a
per
|
Discus
sion
P
a
per
|
Discussion
P
a
per
|
Discussion
P
a
per
|
Figure 8. Correlation of RHliquid data from MCH and FISH/OJSTER during CIRRUS-III; the straight line indicates the linear regression line while the dashed lines illustrate the sensor uncertainty range±5 % RHliquid. The top panel shows the number of data points per 5 % RHliquid
AMTD
7, 9803–9838, 2014Evaluation of MOZAIC Capacitive
Hygrometer
P. Neis et al.
Title Page
Abstract Introduction
Conclusions References
Tables Figures
◭ ◮
◭ ◮
Back Close
Full Screen / Esc
Printer-friendly Version Interactive Discussion
Discussion
P
a
per
|
Discus
sion
P
a
per
|
Discussion
P
a
per
|
Discussion
P
a
per
|
Figure 13.Probability density function (PDF) of the complete (a–c) and reduced (d–f) MCH
(a, d)and reference(b, e), i.e. FISH (clear sky) and OJSTER (in-cirrus), water vapour volume mixing ratio (VMR) data related to the ambient temperatureTambient, respectively. Water vapour
volume mixing ratio is binned in the logarithmical space between 0 and 8.8 with a bin size of 0.8, the temperature in 1◦